Duncanson M, Roy M, van Asten H, Oben G, Wicken A, Tustin K, McAnally H and Adams J. (2022)
Child Poverty Monitor 2022 Technical Report. Dunedin. NZ Child and Youth Epidemiology Service, University of Otago
Introduction
The Child Poverty Monitor is a partnership between the J R McKenzie Trust, the Office of the Children’s Commissioner, and the New Zealand Child and Youth Epidemiology Service (NZCYES) at the University of Otago.
This tenth annual Child Poverty Monitor technical report begins with stories from communities in Aotearoa where mokopuna are supported to thrive. These stories point to the world we are committed to, a society where every child is valued, and enjoys their rights to thrive and to achieve their potential.1, 2 Mokopuna know only too well the barriers that stop them from enjoying their right to a good life. Because of poverty, racism and discrimination, whānau and children struggle to meet everyday needs and miss out on opportunities that are taken for granted by most in Aotearoa.3 In reflecting on what makes a good life, children and young people talk about the importance of strong family relationships, with supported parents, in a community that loves and accepts them.4
The technical report presents the most recent child poverty statistics with commentary on how well Government targets are being met for different groups of children. Conditions in which children and whānau live their lives day-by-day are reflected in statistics regarding financial assistance, good work, suitable housing and food security. Child poverty related indicators in health include access to primary care, as well as deaths and hospitalisations of children, and immunisation coverage. Data on aspects of child safety underscore the importance of children being loved and nurtured in safe environments. Education indicators provide an indication of the opportunities for learning available to mokopuna.
There is a lag between collection of data in national surveys and publication of the results. The child poverty statistics are based on data collection for the 2020/21 Household Economic Survey (HES) that concluded in June 2021. Data collection for the HES has been interrupted in the past two years due to the protections in place during phases of the COVID-19 pandemic. Most health data are presented to the end of the 2021 calendar year, but mortality data were available only to the end of the 2018 calendar year.
Expanded data collection in the household economic survey allows disaggregation of child poverty statistics by ethnicity and by disability status of the child and members of the child’s household. These analyses reveal inequity in the outcomes of measures to reduce child poverty. European children have met the population level targets for proportions living in low-income households or in households experiencing material hardship. Implementation of policies that overcome systemic disadvantage are needed to extend this achievement to all children and their households, including tamariki Māori, Pacific children and disabled children.
This report will be launched as Aotearoa, with the rest of the world, comes to the end of the third year of the COVID-19 pandemic. In May 2020 the Government Budget anticipated increases in levels of income poverty and material hardship for children in Aotearoa.5
This budget secured access to a $50 billion COVID Response and Recovery Fund. This was an unprecedented amount of stimulus for the economy to prevent and mitigate the risks of COVID-19 in Aotearoa New Zealand.
The pandemic response included easily accessible wage subsidies to try to prevent job losses. It included changes to criteria for accessing emergency grants, food bank services, and other systems that mitigate poverty.
However, some communities bore the brunt of the pandemic more than others. For example, a study found almost one in five (18%) of Pacific households lost half or more of their household income due to COVID-19.6 The impacts of the pandemic and of additional government investments cannot easily be dissected from the data in this report. Substantial investment during 2020-2021 might have masked some ongoing and underpinning factors related to poverty. Ongoing measures of child poverty among different cohorts and communities will be needed to determine long-term changes to rates of poverty throughout the population.
The foundations for Aotearoa to be the best place in the world to be a child have been set in place with the commitment of Parliament to the Child Poverty Reduction Act 20187 and the setting of Government targets, as well as in the Oranga Tamariki Act 1989 and Children’s and Young People’s Well-being Act 1989.8 No child should be left behind as Aotearoa moves to meet these targets. This report identifies actions taken within communities to overcome barriers to mokopuna, especially Māori, Pacific and disabled children, living their best lives. This is the time to be ambitious for all mokopuna, not just some, and achieve positive outcomes for all children.
All people should be able to live their best lives with all mokopuna being supported to thrive and realise their potential. Children and young people have told us that their communities and whānau are a critical factor in their wellbeing. In general, for children and young people to be well, their whānau, friends and communities must also be well. Wellbeing is about relationships, not just about having things.
“If the parents are good then the kids are good.” Rangatahi from Rotorua (What Makes a Good Life? series, Office of the Children’s Commissioner)
The stories presented in this section of the report provide examples of community-led solutions and demonstrate the importance of hearing from whānau and their communities about what works for them.
Communities / hapori provide the environments in which families / whānau / aiga live and thrive. The strength of communities is what supports families to survive and flourish. We have found, in the stories people have told us and we have read and heard, that communities hold the power to provide the best and most bespoke supports to people in their communities, in holistic and non-stigmatising ways. The Children’s Commissioner advocates for greater devolvement of funding, solutions and supports to communities – so they can decide for themselves what is needed and deliver it appropriately.
The Office of the Children’s Commissioner were supported by some key community organisations in Aotearoa New Zealand to connect to the people involved in the stories on the following pages. We acknowledge their support with thanks. (Links to these agencies are provided for information only and are current as of 1 December 2022). We also acknowledge all communities who are enabling their whānau to flourish and wish to emphasise that the stories presented here are just a few examples of the many amazing initiatives and support networks that exist across Aotearoa New Zealand.
Inspiring Communities has a strategy for ‘Child Rich Communities’ that aims to grow a movement of people who think and work in community-led ways to improve child, family and whānau well-being. It is driven by a set of principles that enable people in local places to make positive changes for themselves, their children, their family, and the wider community. They connected us with a story about Te Roopu Tiaki Rangatahi, known as Voyage, who have developed a by-rangatahi for-rangatahi programme called ‘Ko Au’ that grows wellbeing and resilience among young people.
Kore Hiakai Zero Hunger Collective brings together community, business, philanthropy, and government to increase food security in Aotearoa New Zealand. They made us aware of the Sowing Machine initiative of Healthy Families Far North, where mokopuna are supported to learn about growing kai and community space is given over to growing mara kai (gardens), thereby increasing food sufficiency in the community.
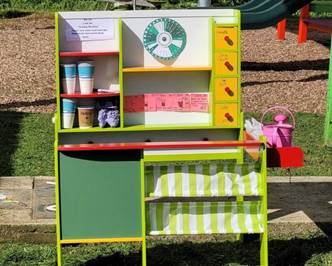
The Peter McKenzie Project supports poverty reduction through community organisations who are delivering systems-level change. These include areas such as housing, youth access to employment, wellbeing for rangatahi, and a programme called ‘Uptempo’, within Auckland Council’s The Southern Initiative. Uptempo supports Pacific peoples to improve their income potential, and interviewed aiga and their tamaiti to tell us about what they have noticed change in their homes.
St Vincent de Paul, Auckland is a story about a foodbank that was ‘taken over’ temporarily during lockdown 2020 by young people associated with St Vinnies youth programme. It has become a key community food hub.
E fofō le alamea, le
alamea (Samoan proverb) -
The solutions for our issues lie within our community
Inspiring Rangatahi to inspire rangatahi
A programme designed and delivered by rangatahi is helping young people in Porirua who have experienced challenges including intergenerational and current trauma, poverty, mental health problems and whānau breakdowns.
Called ‘Ko Au’ the programme was created by Te Roopu Tiakai Rangatahi – a leadership group developed by rangatahi with the support of four local community groups (Maraeroa Marae Health Clinic, Taeaomanino Trust, Tumai Hauora ki Porirua, and Wesley Community Action). The kaupapa for the group is to grow wellbeing and resilience among young people. They have called the journey they are on, and their group, ‘The Voyage’.
The Ko Au programme consists of facilitated workshops that support local youth to take control of their own narratives through stories they’ve seen or heard about their tupuna, ancestors, parents, whānau, teachers and peers.
The programme encourages inclusiveness, leadership, teamwork and using the participants’ strengths to support them to learn, grow and heal. The workshops are followed up with the participants to help them reflect and unpack what is happening in their lives, to create a sense of belonging and connectedness to others. Voyage members support Ko Au participants to leave the workshops with a different and more positive perspective of themselves, those around them and those who have gone before them.
The Ko Au programme is now in action in a number of places in Porirua including high schools.
“As a revolving model of co-designed ‘collaborative planning, delivery and reflective debrief’ that evolves with every workshop, it is run “By Rangatahi, For Rangatahi, With Rangatahi”. We have created an actively engaged network of safety for our young people to fall back on.”
“We see the change in their personalities and the way they carry themselves during this programme”. (Member of Voyage leadership team)
This story was brought to the Child Poverty Monitor by Inspiring Communities - a virtual organisation that promotes community-led development through providing resources, training, and consulting to community groups. It endorses Community-led Development (CLD) principles, such as growing collaborative local leadership and learning by doing, as well as an ongoing adaptive cycle of regular planning, action, reflection, and learning. They promote these principles through the Child Rich Communities framework across Aotearoa.
Read a report on Te Roopu Tiakai Rangatahi (TRTR), Voyage, and their many initiatives here
Watch a clip from a Voyage member about Ko Au here.
Read about Inspiring Communities here.
The Sowing Machine
This story is used with permission, from the July 2022 Monthly Pānui of Kore Hiakai and Healthy Families Far North. Other stories from Kore Hiakai can be found among their ‘Catalyst & Champion stories.’
Mā mua ka kite a muri, mā muri ka ora a mua.
Those who lead give sight to those
who follow,
those who follow give life to those who lead.
There is more than one way to cook a potato – and there is more than one way to create a food resilient community.
With the hurt of rising food prices and growing need for those requiring food assistance, impacting on overall community wellness, there are many champions throughout Aotearoa looking for innovative ways to strengthen their rohe.
One approach taken by Healthy Families Far North Lead Systems Innovator and former chef, Paul Condron, is to minimize reliance on supermarkets by guiding others on how to grow their own kai.
Through listening and working with whānau, Paul discovered that knowing how to grow fresh kai has become a thing of the past, and healthy kai is seen as “posh”. Paul, also known as Paora in the Far North, wants to make good kai available to all and to revitalise knowledge by teaching tamariki through play.
Through multiple workshops with whānau, and many trials, the kaupapa has taken
shape in the form of a ‘Sowing Machine' - a vending machine for growing
seedlings.
This sowing machine makes growing fresh kai a simple and fun activity, while also embedding healthy practices into the spaces where tamariki already interact and play.
Stocked with seasonal seeds, potting mix, and recycled paper cups, tamariki use the recycled cups to plant the seeds, which they can take home to their māra kai or keep in the whare kākāriki (green house) until they are ready to plant in the local community māra.
Tamariki are developing their kaitiaki of te Taiao (environmental protection) skills, so local whānau can stop in and pick up some fruit and vegetables at their local community park.
Paul said it's about making healthy kai available for all. Playgrounds are a place of learning, so why not utilize that space to teach our tamariki how to grow healthy kai, while also making healthy kai more available for the community?

“The tamariki love it and the best part is they don't feel like they're in a classroom… they’re just getting their hands dirty and having fun!” (Paul Condron, Healthy Families Far North)
Uptempo – Pasifika-led systemic change
Uptempo is an initiative focused on creating transformative change for Pasifika in Aotearoa. Uptempo’s focus is to provide learnings and insights into how Pasifika-led, workforce innovations can create the solutions needed for Pasifika people to grow and thrive. To deliver these outcomes, they work within The Southern Initiative (TSI), and alongside ‘aiga, The Fono, Oceania Career Academy and First Union.
Uptempo is supported by the Peter McKenzie Project which funds systems-changing community organisations tackling the root causes of child and whānau poverty in Aotearoa New Zealand.
Leader Anna-Jane Edwards says statistics have shown a $1.8b gap between Pasifika incomes and the rest of Auckland – that equates to about $270 per household per week.
The recent findings of MSD’s Child Poverty in NZ report, as well as evidence in this Child Poverty Monitor show that for many households, full-time paid employment on its own doesn’t provide enough income to meet even the most basic needs of a household - especially where there are children.
Anna-Jane says the problem needs a systemic approach – that working family by family will not reach the scale needed.
Uptempo achieves this by working with government, social agencies and employers to create sustainable, intergenerational wealth for Pasifika. They work with ‘aiga to develop their skills, grow their networks, and access holistic support to meet their needs and aspirations, so Pasifika are leading their own futures.
They also work with employers to help them become more culturally responsive workplaces that respect, uphold and nurture Pasifika values.
At the same time, they work across communities to strengthen connections, celebrate Pasifika values, build partnerships and promote positive Pasifika stories.
Their work helps Pasifika to pursue learning, training and employment opportunities that will help them reach their family goals.
All of the learning from working alongside 'aiga, training providers, employers and community, are packaged and shared with government to create scale by informing policy, commissioning, and designing future activities in Pasifika communities.
The experiences reported by Pasifika families working with Uptempo shows it is working.
We heard about one family who immigrated just as Covid hit and were struggling to cope. Through working with Uptempo both parents have taken up training and work opportunities, the children are at school, and they are all engaging with their community. The mum says: “We just needed a little support and direction, the rest we can do for ourselves.”
Another family were juggling the responsibilities of fulltime work and five children. Through their involvement in Uptempo they became more connected to their community, introducing more families to the group and helping them connect to new opportunities. The process has also led the family themselves to learning opportunities and better leadership skills which has helped them into higher paid jobs that will enable them and their children to live lives of dignity and thrive across multiple generations.
A third family of a sole parent and six children were living on one low wage, while the parent was also trying to up-skill to improve the whole family’s prospects. Uptempo helped her get all the government support she was entitled to, and also helped her connect to the community for support. She has now moved into full time work in education and is helping other Pasifika families improve their prospects.
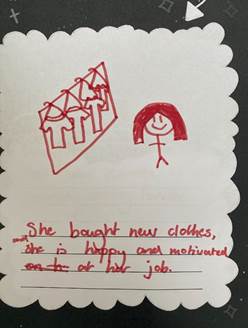
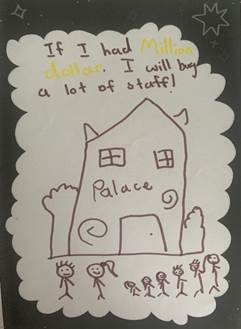
Below are some quotes from Pasifika children who told Uptempo about changes they have already noticed, and that these changes will mean some of their dreams for themselves and their families can come true:
“My mum and dad going to training they know about internet. They are happy all the time.”
“My mum and dad would buy our own house and my mum would do some shopping on clothes.”
“Enjoy having dinner with my whole family.”
“Buy the car and get a house.”
(Children in ‘aiga involved with Uptempo, who drew the pictures.)
Heads, Hearts and Hands
There’s a saying “doing good does you good” – and the young people of Auckland Vinnies, are proving the truth of that saying, with their work to support those doing it tough in their local community.
St Vinnies, which is formally known as the Society of St Vincent de Paul, is a Catholic faith-based, international organisation. The Vinnies Hub in Onehunga houses the Vinnies Auckland youth team that runs school programmes across Auckland. It also houses a large foodhub and advocacy centre that supports families across Auckland.
Young people have always been involved in the Vinnies hub, but challenges presented by COVID meant they felt they really had to step up.
During the first lock down in 2020 the Vinnies hub made the decision to keep the doors open, and recruit family ‘bubbles’ to do all the processing and packing of food parcels. They called on their community – and the community responded, mainly in the form of young people.
As one young Pasefika woman explained “We figured we were all healthy, and Mum and my sister couldn’t work in lockdown, and I was a student – so we just had to. Other families couldn’t because they had immunocompromised people living with them.”
This young woman had already been volunteering at the foodbank - so knew all the systems there and was able to support her mother and three older siblings to put their values and their faith into action to become part of the solution.
Having weathered the first lockdown the new and improved Vinnies hub was well set up to deal with the extended Auckland lockdown in 2021, increasing their distribution of food parcels from about 70 a week to reach 1800 referrals for food per week. In the process this provided the young people helping out with an opportunity to build their own mana, by witnessing the need and then working to help others who were doing it tough in their community.
For one young man, starting as a driver meant he saw firsthand the hardship people faced in run-down, often crowded, homes. The experience opened his eyes to others’ situations and he recognised they really needed the support. He became part of the Vinnies youth programme which visits schools to raise awareness of key aspects of poverty: social exclusion, food insecurity and homelessness.
Under the school programme students collect non-perishable foods for the food bank, visit the food banks and do cooking after school.
As one Year 13 student said he’d learned that food insecurity is a multi-faceted problem which “comes in different shapes and sizes, you don’t know who is affected. People are too shy to talk about their struggles. We need to accept everyone as they are with open arms and treat everyone with respect.”
The combination of education and volunteering – heads, hearts and hands – is what changes the lives of young people and the communities they support. The education provided by Vinnies along with the real world experience means students “understand the deeper meaning of poverty and how it impacts people in our communities. Teaching rangatahi helps them teach others around them. We have a lot of Māori and Pacific peoples around here, and our backgrounds have oral traditions. Word of mouth is a big way of teaching others empathy” (year 12 female student, Vinnies School leader and volunteer).
There is also a skills development aspect – the young people learn leadership skills, develop strong relationships in their communities and “establish a ‘giving’ habit.” (year 13 male student, Vinnies youth leader). It is “stressful but powerful. I had a sense of myself being moulded through being exposed to people in need. It shifts your perspective in life going forward. I can understand the mana and dignity that other people hold.” (Female graduate, Vinnies School leader and volunteer).
“I have a busy life with study but this is an investment in myself and leaving a legacy - you’re changing the world where it’s needed.” (Male university student, Vinnies Tuakana leader)
Key points
Ending child poverty
At a national level there has been progress toward the child poverty reduction targets set by Government as required in the Child Poverty Reduction Act 2018. When data are disaggregated by ethnicity or by disability status it becomes clear that we need strong decisive action so that all children and young people enjoy equal opportunity to thrive and do well. Many children growing up in households with very low income or material hardship experience love and support from their whānau, families and aiga around them. This does not overcome the association between measures of child poverty and adverse outcomes with potential negative long-term impacts.
In the 2021/22, for children aged under 18 years:
-
Using the fixed-line measure of equivalised disposable income after housing costs below 50% of the 2017/18 median, all groups of children have met the 2020/21 target of 18.8% and European children have already met the 2023/24 target of 15%. The target for 2027/28 is 10%. Overall, approximately 187,300 children (16.3%) still live in households below this poverty line and a gap remains between European children and those identifying with other ethnic groups, and between disabled children and non-disabled children. (European children 14.1%; tamariki Māori 17.8%; Pacific children 16.3%. Disabled children 17.6%; non-disabled children 16.2%).
-
The target of 10.5% of children living in households with equivalised disposable income before housing costs below 50% of the contemporary median was not met overall in the 2020/21 survey year, with around 156,700 children (13.6%) in this category. The target for 2027/28 is 5%. The advantage enjoyed by European children means they were the only population group to have met this target, and European children also met the 2022/23 target of 10%. (European children 9.7%; tamariki Māori 18.1%; Pacific children 17.2%. Disabled children 15.5%; non-disabled children 13.7%).
-
The 2020/21 target of 10.3% of children living in households experiencing material hardship was met when the sampling error was taken into account, with 125,700 (10.0%–12.0%) experiencing a lack of six or more essentials. The target for 2027/28 is 6%. Material hardship decreased for all groups of children between 2019/20 and 2020/21, with a persistent high level of disparity between population groups. The 2020/21 and 2022/23 targets (9.0%) were met for European and non-disabled children. (European children 7.8%; tamariki Māori 20.2%; Pacific children 24%. Disabled children 20.5%; non-disabled children 9.7%).
Health
Access to primary care
Government initiatives have significantly reduced cost as a barrier to children accessing primary care when they have a medical problem needing attention. In 2020/21 almost two-thirds of children (64.5%) had visited or talked with a GP in the previous 12 months.
The most frequent barrier to accessing primary care in 2020/21 was the inability to make an appointment within 24 hours. Around 145,000 children were unable to get an appointment within 24 hours when they needed it. This barrier affected children in all population groups.
COVID-19 was a barrier to 35,000 children accessing GP care when they needed it; barriers related to the pandemic could include fear of being infected, pandemic restrictions, not wanting to have a virtual consultation, or other concerns.
Lack of transport and lack of childcare for other children remain barriers to primary care for around 9,000 and 14,000 children respectively.
Immunisation
Immunisation rates have fallen well below the target of 95% needed for a protected community. In 2020/21 only 85.7% of all babies were fully immunised at age 8 months, with 84.2% of Pacific babies and 72.1% of Māori pēpi fully vaccinated at this age.
The proportion of 8-month-olds fully immunised in areas with high deprivation scores on the New Zealand index of deprivation (NZDep) has been consistently lower than the proportion in less deprived areas. This gap based on deprivation level increased markedly from 2016/17 to 2021/22.
Children in Aotearoa are now less protected from vaccine-preventable disease than they were before the COVID-19 pandemic. There is an urgent need to prioritise childhood vaccinations and to overturn the inequity in vaccine delivery that has increased markedly during the pandemic and response.
Vaccine preventable diseases
From 2017–2021 there were almost 5,000 potentially avoidable hospitalisations for vaccine preventable diseases. Hospitalisation rates for all common VPD declined sharply in 2020 and stayed low in 2021. The fall in vaccination rates raises concerns about the ongoing potential for further outbreaks of vaccine-preventable diseases.
Some children were better protected than others from vaccine-preventable illness serious enough to need hospital treatment. Children living in the most deprived neighbourhoods (NZDep quintile 5) had a hospitalisation rate for vaccine-preventable diseases that was almost three times as high as the rate for children living in the least deprived neighbourhoods (NZDep quintile 1).
Pacific children had the least protection with a hospitalisation rate for vaccine-preventable diseases almost four times as high as rates for European/Other and Asian/Indian children. The hospitalisation rate for vaccine-preventable diseases for Māori children was twice as high as the rates for European/Other and Asian/Indian children.
Food security
In 2020/21, around one in six children (14.9%) were living in households where food ran out sometimes or often due to lack of money.
A higher proportion of children living in areas with the highest deprivation scores (NZDep quintile 5) lived in households that sometimes or often ran out of food due to lack of money, compared with 4.6% of children living in neighbourhoods with the lowest NZDep scores (Quintile 1).
Over one-third of Pacific children (37.3%) and 26.4% of Māori children lived in households that sometimes or often ran out of food. European children were better protected from inadequate nutrition, with 10.9% living in households that sometimes or often ran out of food.
A place to call home
Affordable homes
Housing is classified as unaffordable when households spend more than 30% of disposable income on housing costs, which includes rates, dwelling insurance, mortgage and rent. For the year ending 30 June 2021, 34% of all households with children aged 0–17 years spent more than 30% of their disposable income on housing.
Housing unaffordability disproportionately affects lower income households.
Approximately 60% of households with children in quintile 1 (lowest 20% of income distribution) spend more than 30% of their disposable income on housing, compared to only 11% of children in households in the top 20% of income distribution (quintile 5). More than one in three quintile 1 households with children spend more than 50% of their disposable income on housing costs.
More than 40% of households with children who are renting spend more than 30% of their income on housing costs. Quintile 1 households with children who pay private rent and receive the Accommodation supplement payment spend close to 50% of their income on housing.
More than half of all single-parent households spend more than 30% of income on housing, and over one in five single-parent households have housing costs of more than 50% of their disposable income.
Healthy homes
Healthy homes protect children and their whānau from communicable disease transmission and other health problems. In 2020/21, 6% of children aged 0–17 years lived in households with major problems with dampness or mould (down from 9% of households in 2017/18).
Poor quality housing disproportionately affects children in low income households (10% of children in quintile 1 households), children of Māori (10%) and Pacific (12%) ethnicity.
Ten percent of households with a child with a disability or households with a disabled person live in poor quality housing.
Major problems with dampness and mould are reported by 11% of households who live in rented accommodation compared with 2% in owner-occupied homes.
Household crowding
Children need adequate shelter, space, and privacy within their homes, taking account of the number of people living there. Reducing household crowding is an important intervention to reduce the high rates of hospitalisation for infectious diseases among children in Aotearoa.
In each census year since 1991 there have consistently been 16% or 17% of New Zealand children aged under-15 years living in crowded households, including around 5% of children living in severely crowded households.
The highest levels of household crowding were experienced by Pacific children, over 40% of whom lived in crowded households including 18% who lived in homes with severe crowding.p>
Over one-fifth of tamariki Māori lived in crowded households (23.5%). This group includes 9% of Māori children who were living in severely crowded households (17,410 children).
Ending child poverty
Adequate income
Adequate disposable household income is important to provide children with the necessities of living, and the opportunities to participate fully in society. A household with sufficient income is better equipped to provide the nurturing and enriching relationships that are critical to children’s growth and development.9,10,11
To measure how many children live in households with income poverty, household incomes are compared to poverty lines that are set based on the overall distribution of incomes in the population. For example, a threshold for income poverty can by defined as having a disposable household income that is less than half of the median (or middle) disposable household income.
Disposable (or net) income for an individual is the total of all sources of income including tax credits, less tax payable and ACC earner’s levy. Disposable household income is the sum of the disposable incomes for all household members aged 15 years and older.
To allow for comparison between households, disposable household incomes are equivalised - adjusted for household size and composition. This reflects that larger households require more income overall than a smaller household, but there are also economies of scale for larger households. The modified Organisation for Economic Co-operation and Development (OECD) equivalence scale is used for equivalisation. This scale assigns a value of 1.0 to the first adult in the household, and 0.5 to each additional adult (aged 14 years or older), then 0.3 for each child aged under 14 years).12
Equivalised household disposable income is an indicator of the economic resources available to the members of the household. The household income is then compared to a threshold based on the ‘middle point’ for all households – the median equivalised disposable income. A median income is used for comparison rather than the mean, because it is less sensitive to extremes. Thresholds for income poverty are defined as less than 40%, 50% and 60% of the median equivalised disposable income.13
The income thresholds can be set using a fixed line or moving-line approach. A moving-line approach (e.g. below 50% of the (contemporary) median household income) compares a household’s income in a given year to the current median for all households in the same year. Contemporary median household incomes will change each year due to inflation and economic changes. Using this approach, a low-income household is deemed better off if it moves closer to the median, even with no change in real income. Moving-line approaches are better for assessing long-term change.13,14
The fixed line approach compares incomes to the median income in a particular base financial year: this is a constant threshold, which is adjusted for inflation. Fixed-line measures show short and medium-term change. It shows how a household income changes between years, irrespective of what happens to the incomes of other households. The fixed line measure indicates whether the real income of a household is increasing or decreasing.14
These income measures are presented before housing costs are deducted (BHC), and after housing costs are deducted (AHC), because the expense of housing (including rent, mortgage repayments, property rates and insurance) are not discretionary – all families need somewhere to live.
Child Poverty Reduction Act
In December 2018, Parliament passed the Child Poverty Reduction Act 20187 which seeks to “help achieve a significant and sustained reduction in child poverty in New Zealand” through encouraging government and society to focus on child poverty reduction, facilitating political accountability to achieve published targets, and requiring transparent reporting. The Act mandates ten primary and supplementary child poverty measures which are reported by Stats NZ.7 Data are available to monitor progress on nine of these measures. The definition for a poverty persistence measure must be decided and reported on for the financial year beginning on 1 July 2025.
Low income measures specified in the Child Poverty Reduction Act are listed below ( primary measures in bold) :
· Percentage of children living in households with less than 50 percent of the median equivalised disposable household income for the 2017/18 base financial year after housing costs are deducted
· Percentage of children living in households with less than 50 percent of the median equivalised disposable household income before housing costs are deducted (contemporary financial year)
· Percentage of children living in households with less than 60 percent of the median equivalised disposable household income without deducting housing costs (contemporary financial year)
· Percentage of children living in households with less than 60 percent of the median equivalised disposable household income after housing costs are deducted (contemporary financial year)
· Percentage of children living in households with less than 50 percent of the median equivalised disposable household income after housing costs are deducted (contemporary financial year)
· Percentage of children living in households with less than 40% of the median equivalised disposable household income after housing costs are deducted (contemporary financial year)
In 2019 the Government set three-year and ten-year targets to reduce the proportion of children living in households with equivalised income less than 50% of the contemporary median before housing costs, and less than 50% of the base financial year (2017/18) median after housing costs.15 Further three-year targets for the 2023/24 year were set in June 2021.16 All targets are shown in Table 1.
Table 1. New Zealand Government low-income targets set under the Child Poverty Reduction Act 2018.
| Primary measure |
Intermediate | Second intermediate (3‑year) target rate16 |
Long-term |
| Low-income: less than 50% of median equivalised DHI (without deducting housing costs) for financial year [Before housing costs, BHC 50% moving line] | 10.5% of children in the 2020/21 financial year | 10% of children in the 2023/24 financial year | 5% of children in the 2027/28 financial year |
| Low-income: less than 50% of median equivalised DHI (after deducting housing costs) for base financial year [after housing costs, 50% fixed line] | 18.8% of children in the 2020/21 financial year | 15% of children in the 2023/24 financial year | 10% of children in the 2027/28 financial year |
The United Nations Global Goals for Sustainable Development (SDGs) were adopted by Aotearoa and other nations in 2015. Governments must reduce the proportion of children in poverty, in all its dimensions, by at least half by 2030 (Goal 1.2).18 These goals are used in this report for the supplementary child poverty indicators
This section of the Child Poverty Monitor presents information on children living in households with low disposable incomes, using the equivalised income of the household that includes the child, as reported by the official measures of child poverty produced by Stats NZ Child Poverty Statistics19 and as reported in Child Poverty in New Zealand20 reports produced by the Ministry of Social Development.
Data sources and methods
Indicators
*Children in households below 50% of median income poverty threshold before housing costs (BHC)
Children in households below 60% of median income poverty threshold before housing costs (BHC)
Children in households below 40% of median income poverty threshold after housing costs (AHC)
Children in households below 50% of median income poverty threshold after housing costs (AHC)
Children in households below 60% of median income poverty threshold after housing costs (AHC)
* This indicator is presented by current financial year (contemporary median) and by base financial year (fixed-line)
Definitions
Children are persons aged under 18 years.
A household is one person who usually resides alone or two or more people who usually reside together and share facilities (e.g. eating, cooking, bathroom and toilet, living area).
A child is a member of a household if they live there for four or more nights per week, or spend equal time in this and another household and were present during the survey week.
Equivalised household income is the household disposable income for the previous twelve months adjusted for household size and composition.
Disposable income is calculated for each household as the: sum of taxable income, non-taxable income, working for families’ tax credits, and total rebates, less ACC earner’s levy and tax payable.
Contemporary median poverty measures are set relative to the median income for the same year. This gives a low-income threshold that rises and falls with changes in contemporary median incomes. This type of measure is also called a moving-line or relative approach. Improvement is considered to have occurred when a poor household moves closer to the median irrespective of whether income in real terms has increased or decreased.13
Base financial year poverty measures are anchored in a reference year (in this report, the reference year is 2017/18), adjusted for inflation, and kept at a constant value in real terms over other years. This type of measure is also called a constant value or anchored approach. Because it is considered most useful for examining short to medium term change, it is necessary to re-set the reference year to continue to calculate realistic rates of poverty where there have been considerable changes in New Zealand’s economy, adjusted using the consumer price index. Improvement is considered to have occurred when household income rises in real terms irrespective of what is happening to the incomes of other households .
Households are low-income where they have an income <60% of the contemporary median income
Data source
Stats NZ Child Poverty Statistics
New Zealand Household Economic Survey (NZHES) via Perry (2022).20
Additional information
The median is a more stable measure of household incomes than the mean. A few households with a very high income will shift the mean upwards, and the number of very-high-income households varies from year to year.
All dates are for year ended June 30. Data collection finished in March 2020 due to the COVID-19 pandemic, so the sample size is smaller for the 2019/20 survey than for other years.
The 2009 financial year is the first year for which data are available using the 2017/18 base financial year (fixed-line measure). Data for the contemporary median measures are available from 2007 (Table 2 ).
Table 2. Children in low-income households, by selected poverty thresholds, Aotearoa 2006/07–2020/21
| Year | Before housing costs (BHC) | After housing costs (AHC) | ||||||||||
| Children in low-income households | ||||||||||||
| <50% contemporary median | <60% contemporary median | <40% contemporary median | <50% contemporary median | <60% contemporary median | <50% fixed-line median* | |||||||
| n | % | n | % | n | % | n | % | n | % | n | % | |
| 2006/07 | 150,800 | 14.0 | 256,800 | 23.9 | 163,900 | 15.3 | 240,500 | 22.4 | 314,200 | 29.3 |
|
|
| 2007/08 | 155,900 | 14.5 | 251,800 | 23.4 | 155,900 | 14.5 | 257,800 | 23.9 | 355,200 | 33.0 |
|
|
| 2008/09 | 150,600 | 14.0 | 239,500 | 22.2 | 165,200 | 15.3 | 256,300 | 23.8 | 338,700 | 31.4 | 328,600 | 30.5 |
| 2009/10 | 152,500 | 14.1 | 242,400 | 22.4 | 160,400 | 14.8 | 237,400 | 21.9 | 321,900 | 29.7 | 291,100 | 26.9 |
| 2010/11 | 161,900 | 14.9 | 253,400 | 23.3 | 175,500 | 16.1 | 238,000 | 21.9 | 328,100 | 30.2 | 335,300 | 30.9 |
| 2011/12 | 160,900 | 14.8 | 252,800 | 23.3 | 176,800 | 16.3 | 240,700 | 22.2 | 314,300 | 28.9 | 315,600 | 29.1 |
| 2012/13 | 169,000 | 15.6 | 255,500 | 23.6 | 169,000 | 15.6 | 237,600 | 21.9 | 318,300 | 29.3 | 292,300 | 26.9 |
| 2013/14 | 157,500 | 14.5 | 253,900 | 23.4 | 171,700 | 15.8 | 248,800 | 23.0 | 317,800 | 29.3 | 295,900 | 27.3 |
| 2014/15 | 177,200 | 16.3 | 267,900 | 24.6 | 168,200 | 15.5 | 258,500 | 23.8 | 331,200 | 30.5 | 295,600 | 27.2 |
| 2015/16 | 168,300 | 15.4 | 254,400 | 23.3 | 177,600 | 16.2 | 244,200 | 22.3 | 325,700 | 29.8 | 265,400 | 24.3 |
| 2016/17 | 156,300 | 14.2 | 243,300 | 22.1 | 178,000 | 16.1 | 235,600 | 21.4 | 313,600 | 28.4 | 247,500 | 22.4 |
| 2017/18 | 183,400 | 16.5 | 281,200 | 25.3 | 174,300 | 15.7 | 253,800 | 22.8 | 341,100 | 30.6 | 253,800 | 22.8 |
| 2018/19 | 153,200 | 13.5 | 250,300 | 22.1 | 156,100 | 13.8 | 227,900 | 20.1 | 313,200 | 27.7 | 207,700 | 18.3 |
| 2019/20 | 151,200 | 13.2 | 248,900 | 21.8 | 151,400 | 13.2 | 222,800 | 19.5 | 318,100 | 27.8 | 203,300 | 17.8 |
| 2020/21 | 156,700 | 13.6 | 249,000 | 21.7 | 150,400 | 13.1 | 236,900 | 20.6 | 322,900 | 28.1 | 187,300 | 16.3 |
There has been an overall decline in the proportion of children living in households with equivalised disposable income less than 50% of the fixed-line median income after housing costs since 2008/09. The rate of decline in this measure will need to continue in order to achieve the 2023/24 Government target of 15.0% (Figure 1). In 2020/21 there were an estimated 187,300 children (16 children in every 100) living in households with equivalised disposable income below 50% of the 2017/18 base financial year after housing costs.
The proportion of children living in households with equivalised disposable income less than 50% of the contemporary (moving-line) median income before housing costs rate has shown year-to-year fluctuation but has not substantially changed since 2006/07, and at 13.6% is well above the 2020/21 target of 10.5%. There will need to be a significant decline in this proportion to meet the 2023/24 Government target of 10%.
Figure 1. Children in low-income households (less than 50% contemporary median income before housing costs and less than 50% fixed-line median income after housing costs), Aotearoa, 2006/07–2020/21 with extrapolations to Government targets
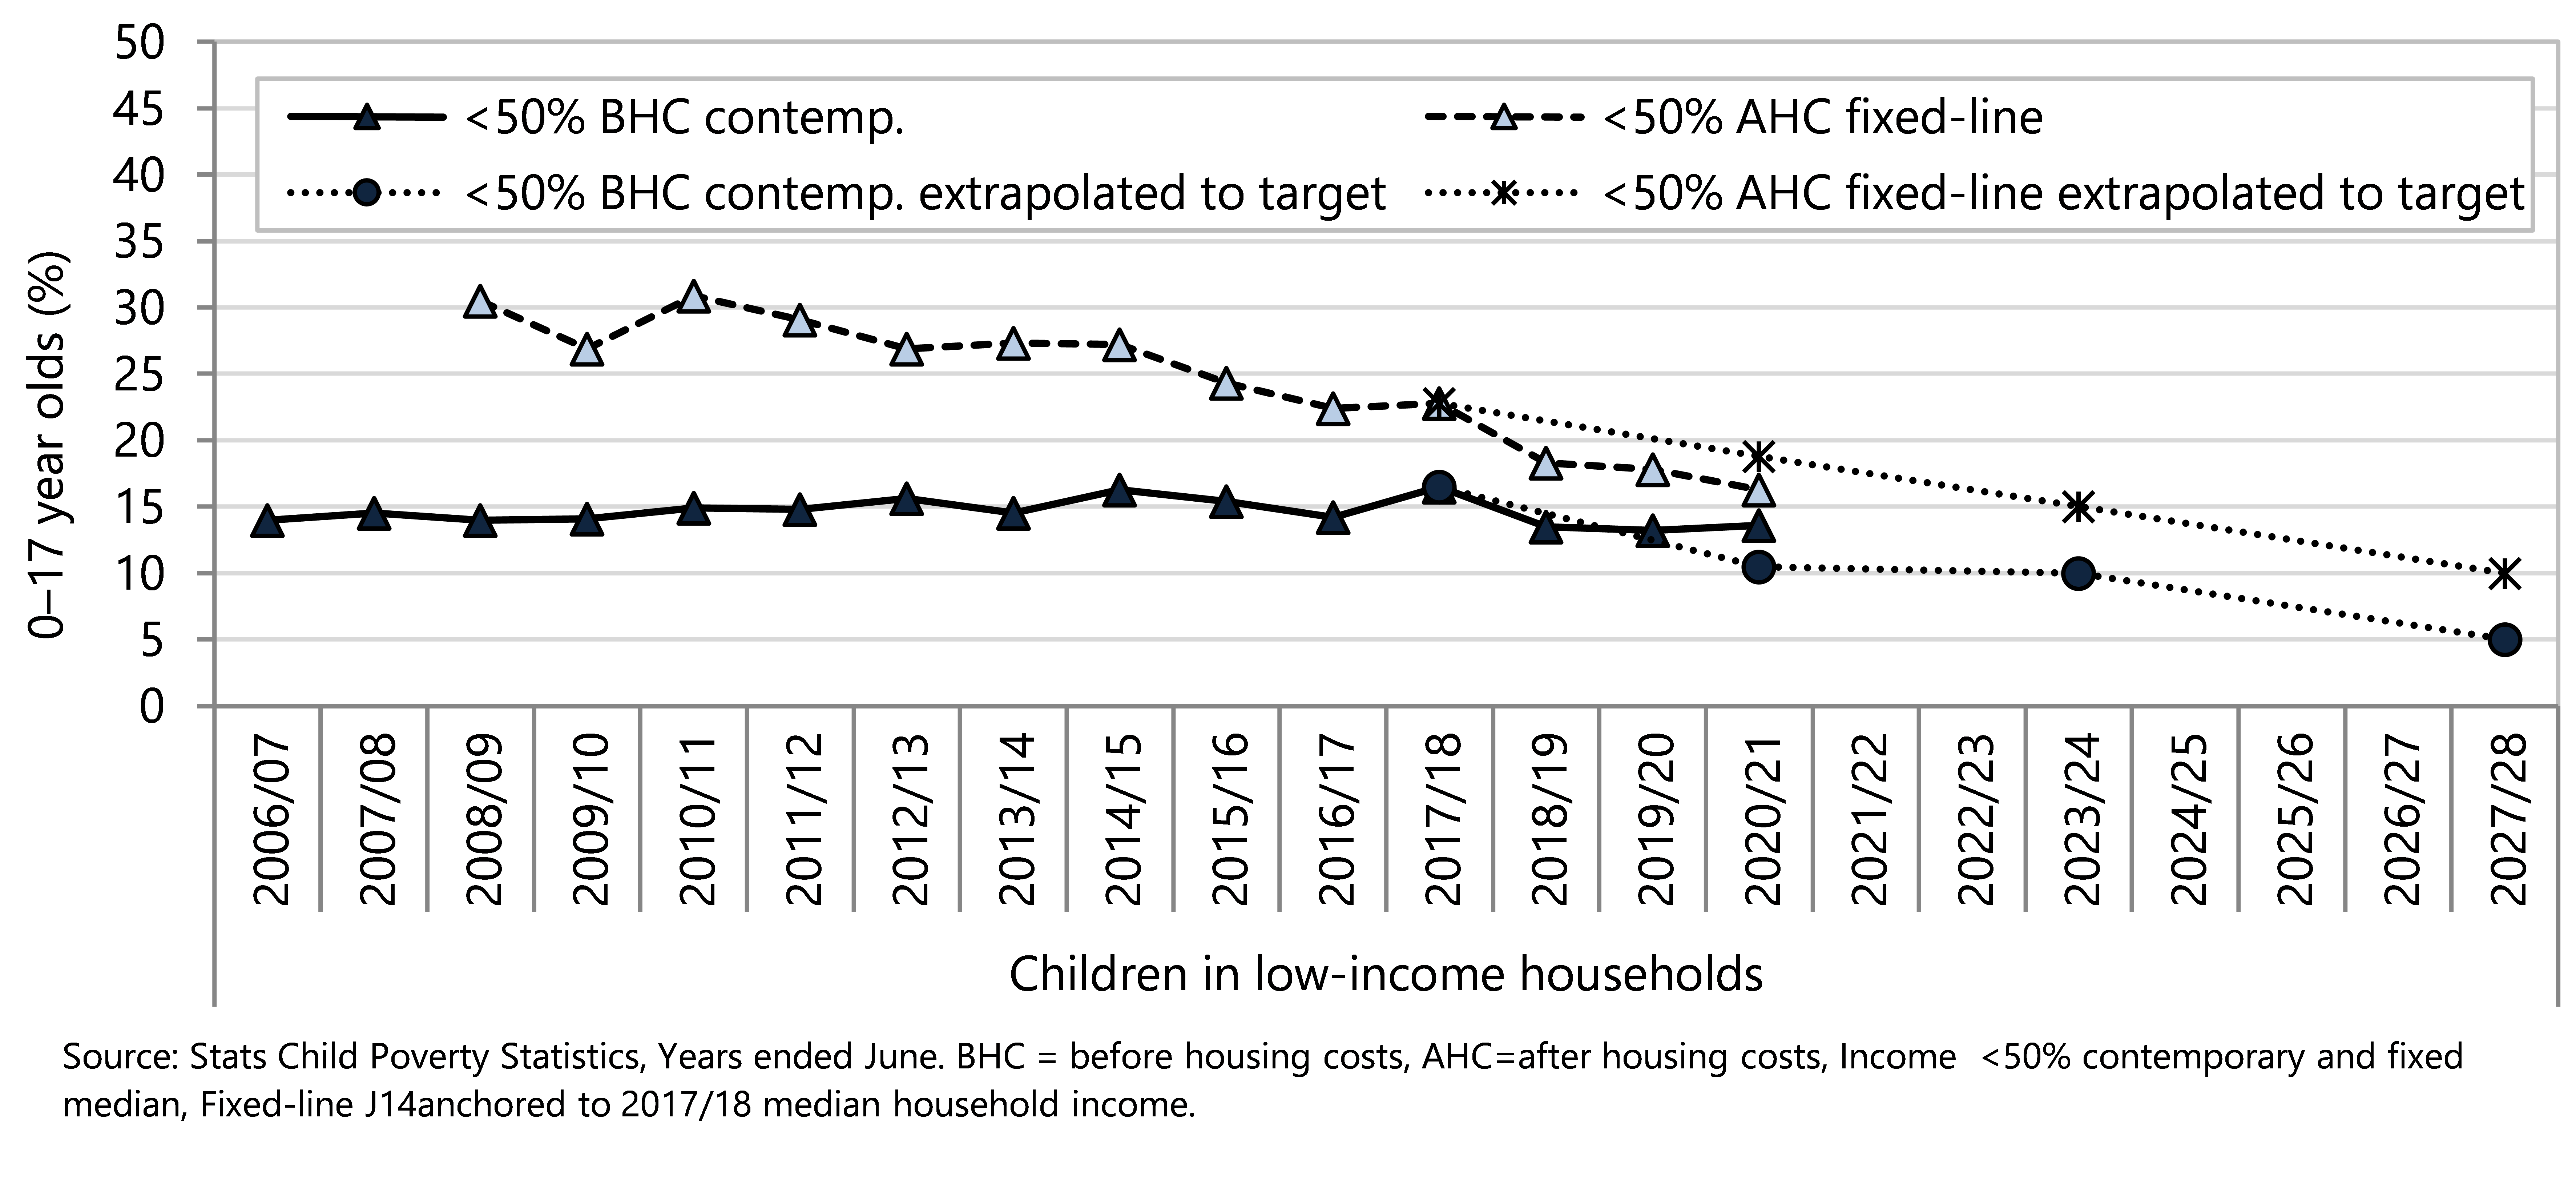
Figure 2 shows the impact of housing costs on the proportion of children living in households with equivalised disposable income less than 50% and less than 60% of the contemporary (moving-line) median income. The effect of housing costs on the proportion of children living in income-poor households has been consistent since around 2012 (Table 2, Figure 2). Before housing costs were deducted, an estimated 249,000 children (21.7%, more than one in five children) lived in households with an equivalised disposable income less than 60% of the contemporary median household income in 2020/21 (Table 2, Figure 2). The impact of housing costs meant that an additional 73,900 children lived in a low-income household (less than 60% of the contemporary median) after housing costs were deducted (Table 2, Figure 2). This is equivalent to an additional 6.4% of children living in households experiencing income poverty (less than 60% contemporary median) due to the impact of housing costs on disposable household income.
A similar pattern is seen for children living in households with equivalised disposable income less than 50% of the contemporary median income. Using this measure, an additional 80,200 children lived in a household with an income less than 50% of the contemporary median after housing costs were deducted (Table 2, Figure 2). Accounting for housing costs increased the proportion of children living in low-income households (less than 50% contemporary median) from 13.6% to 20.6%.
Figure 2. Children in low-income households (less than 50% and less than 60% of the contemporary median income) before and after housing costs, Aotearoa 2006/07-2020/21
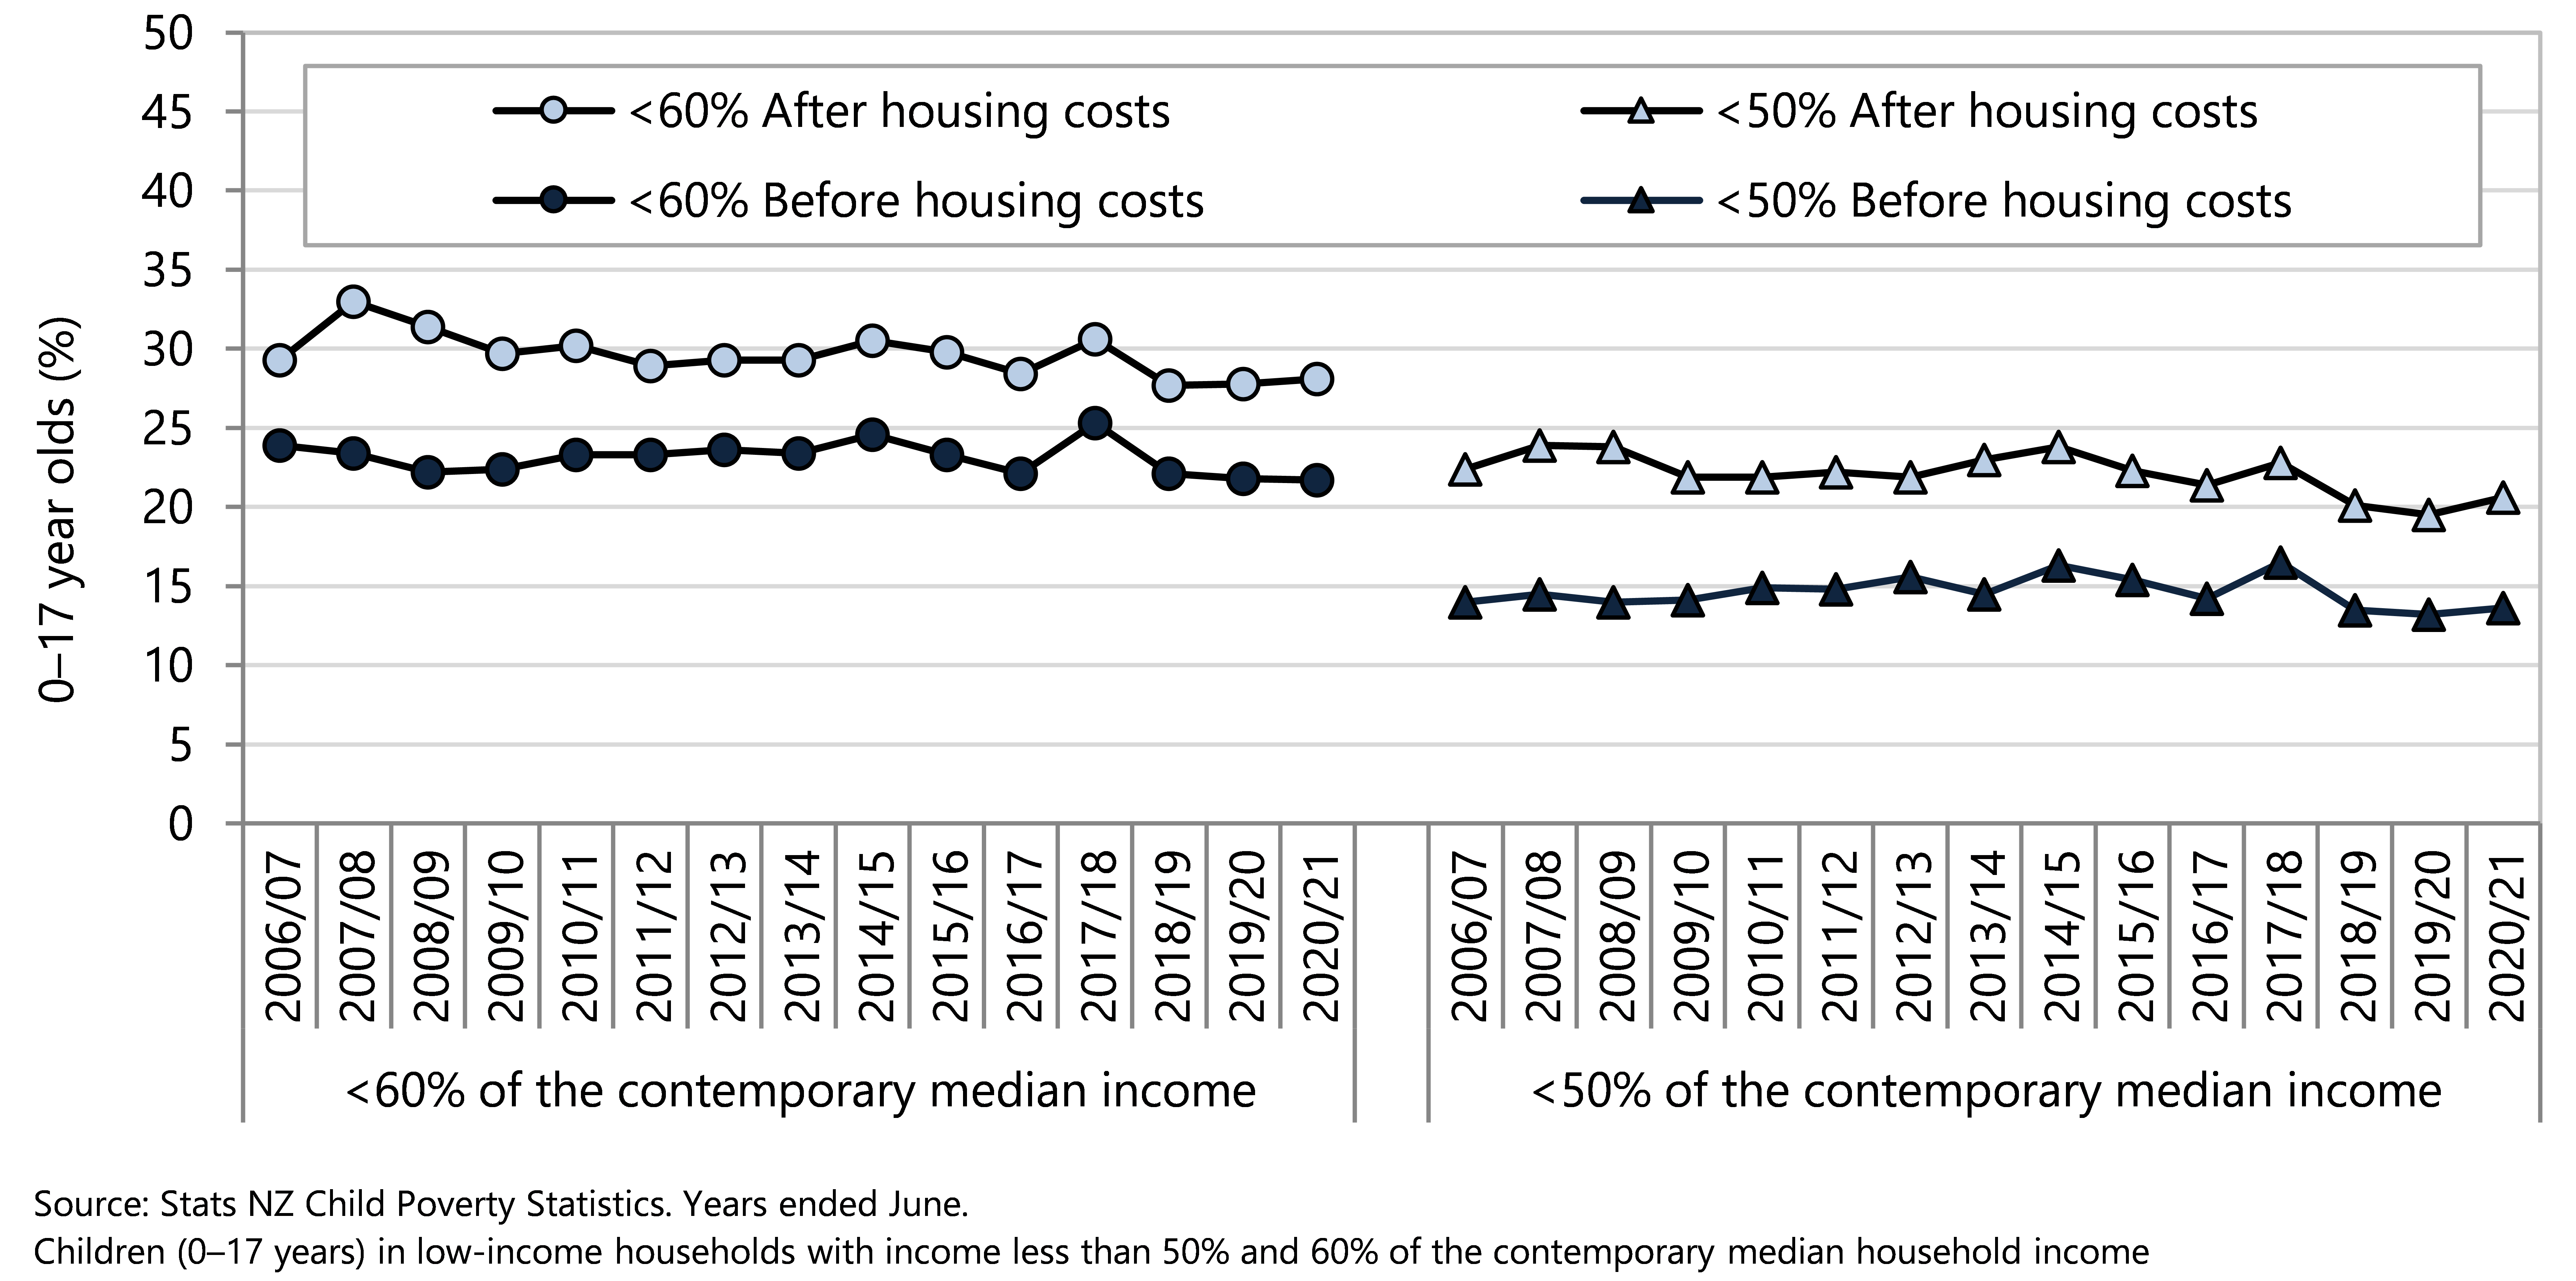
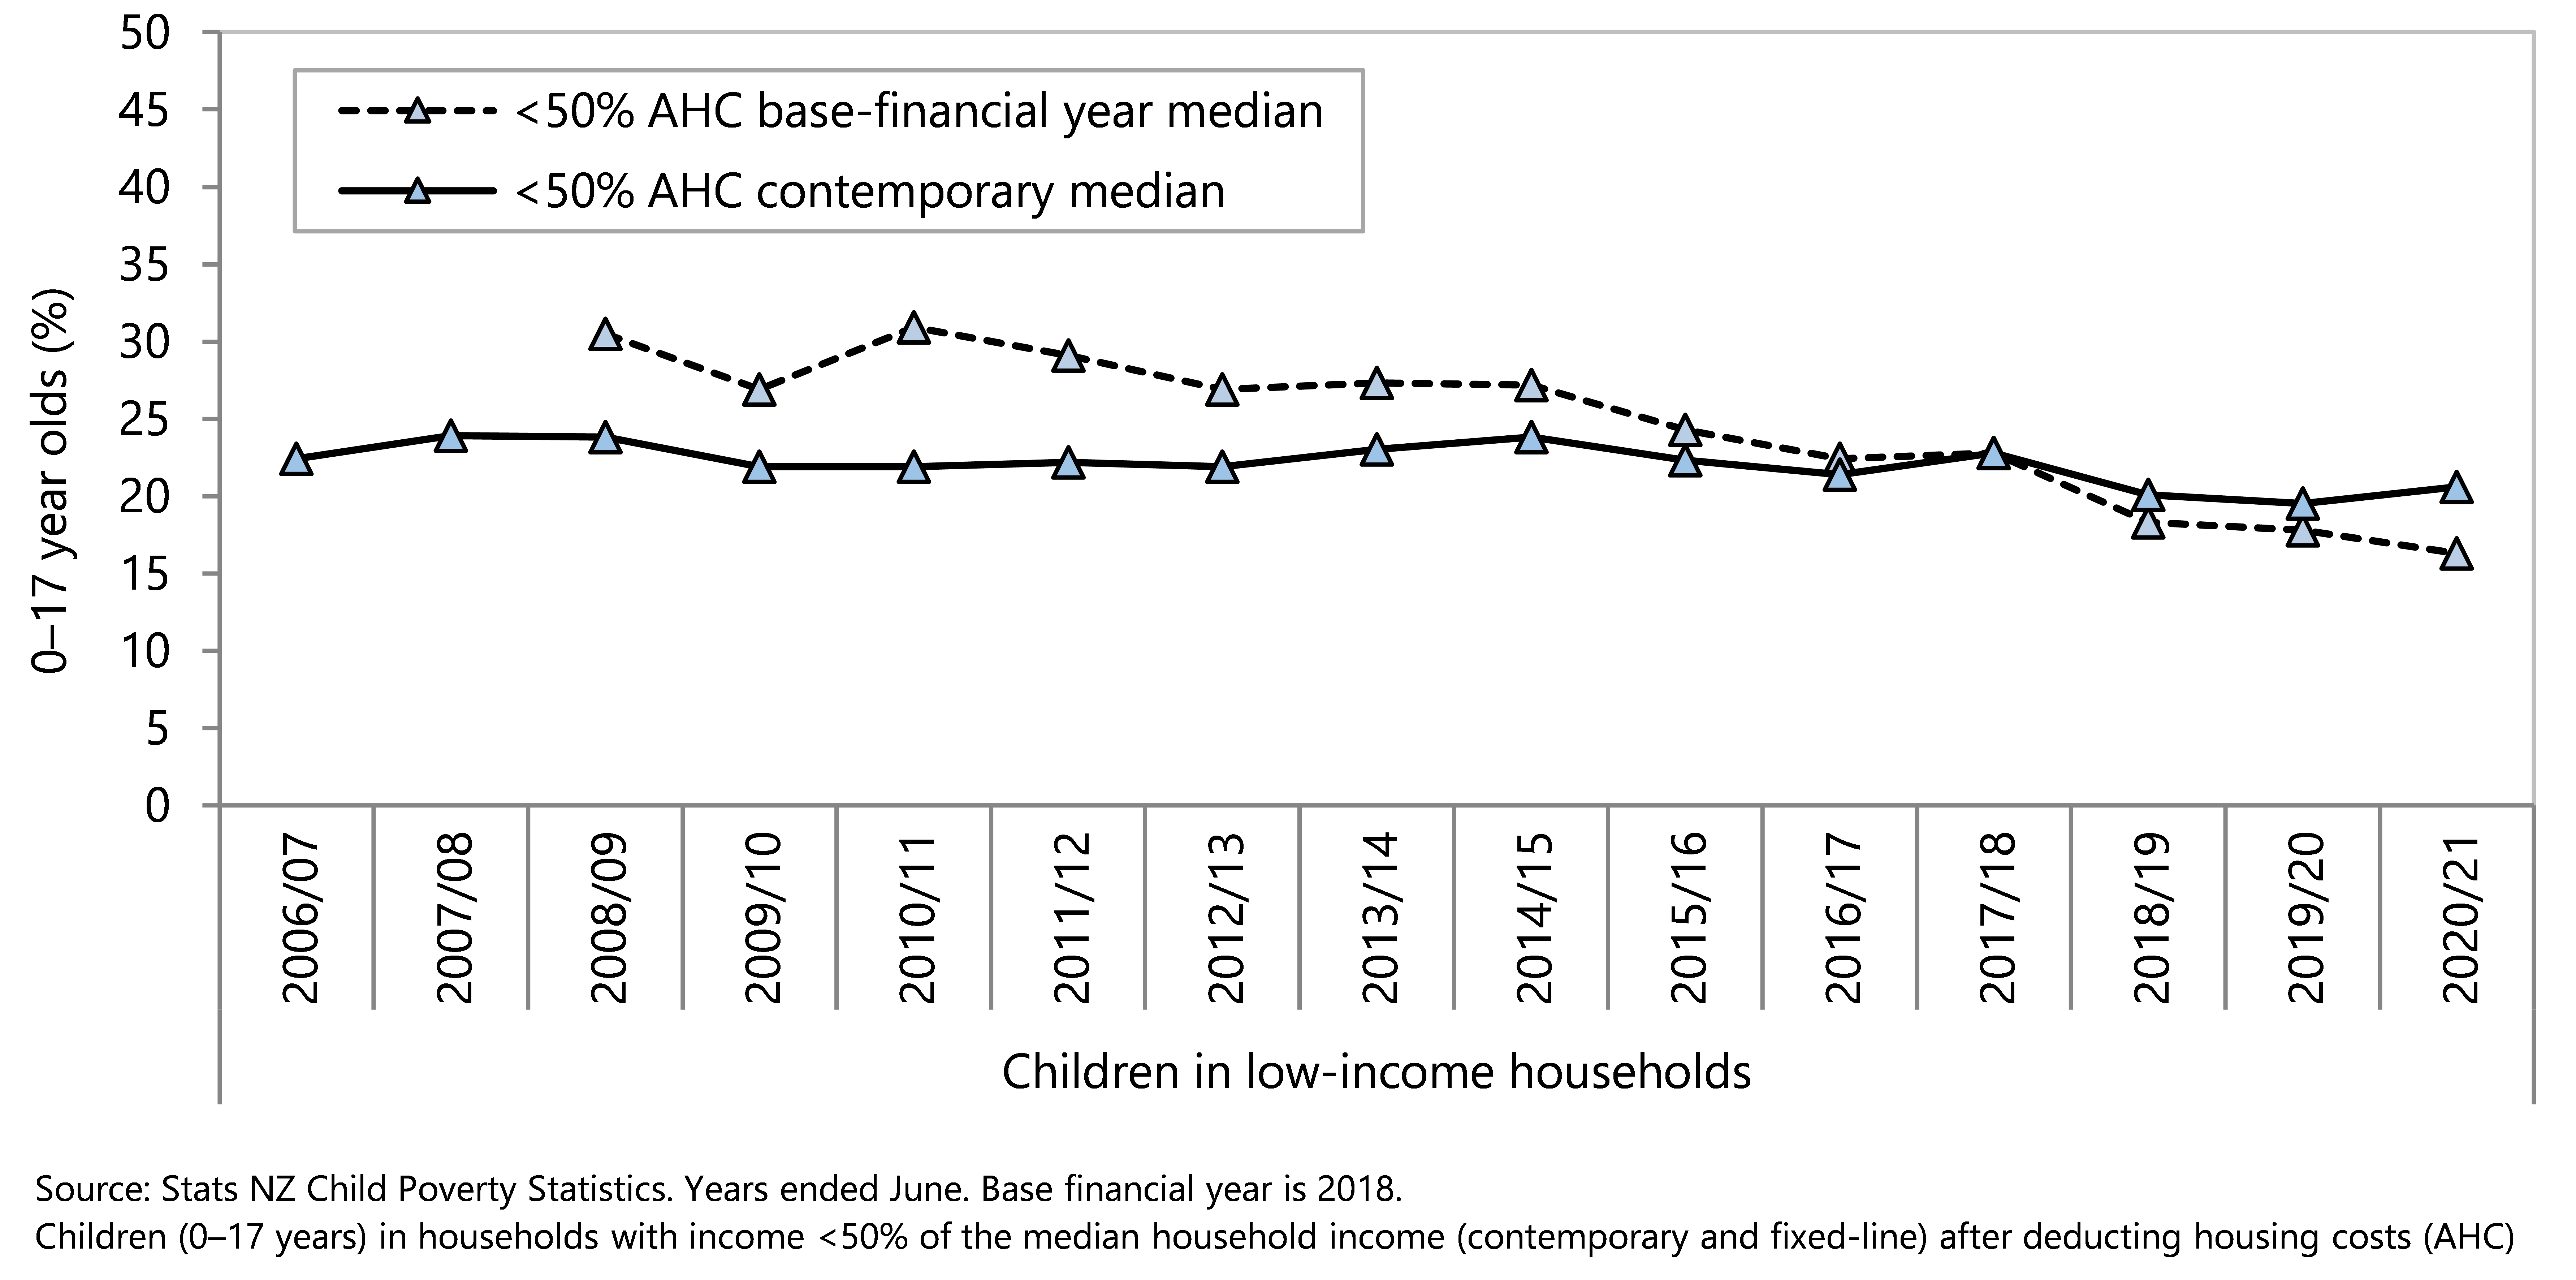
Figure 3 compares base financial year (fixed line) low-income measures with financial year (contemporary median) measures for the proportion of children in low-income households using a less than 50% of the median equivalised disposable income threshold. The base financial year for the fixed-line measure is 2017/18.
Without consideration of the income changes experienced by other households, disposable incomes in some low-income households with children have increased in real dollar terms between 2010/11 to 2020/21 with a decline of the proportion of children in low-income households (Table 2, Figure 3).
When taking into account income changes experienced by all households, the disposable incomes in low-income households have remained relatively stable compared to the (contemporary) median household income for each year, with 20.6% of 0–17 year olds living in low-income households (Table 2, Figure 3).
Figure 3. Children in low-income households (income less than 50% of the contemporary and fixed-line median household income) after housing costs (AHC), Aotearoa 2006/07-2020/21
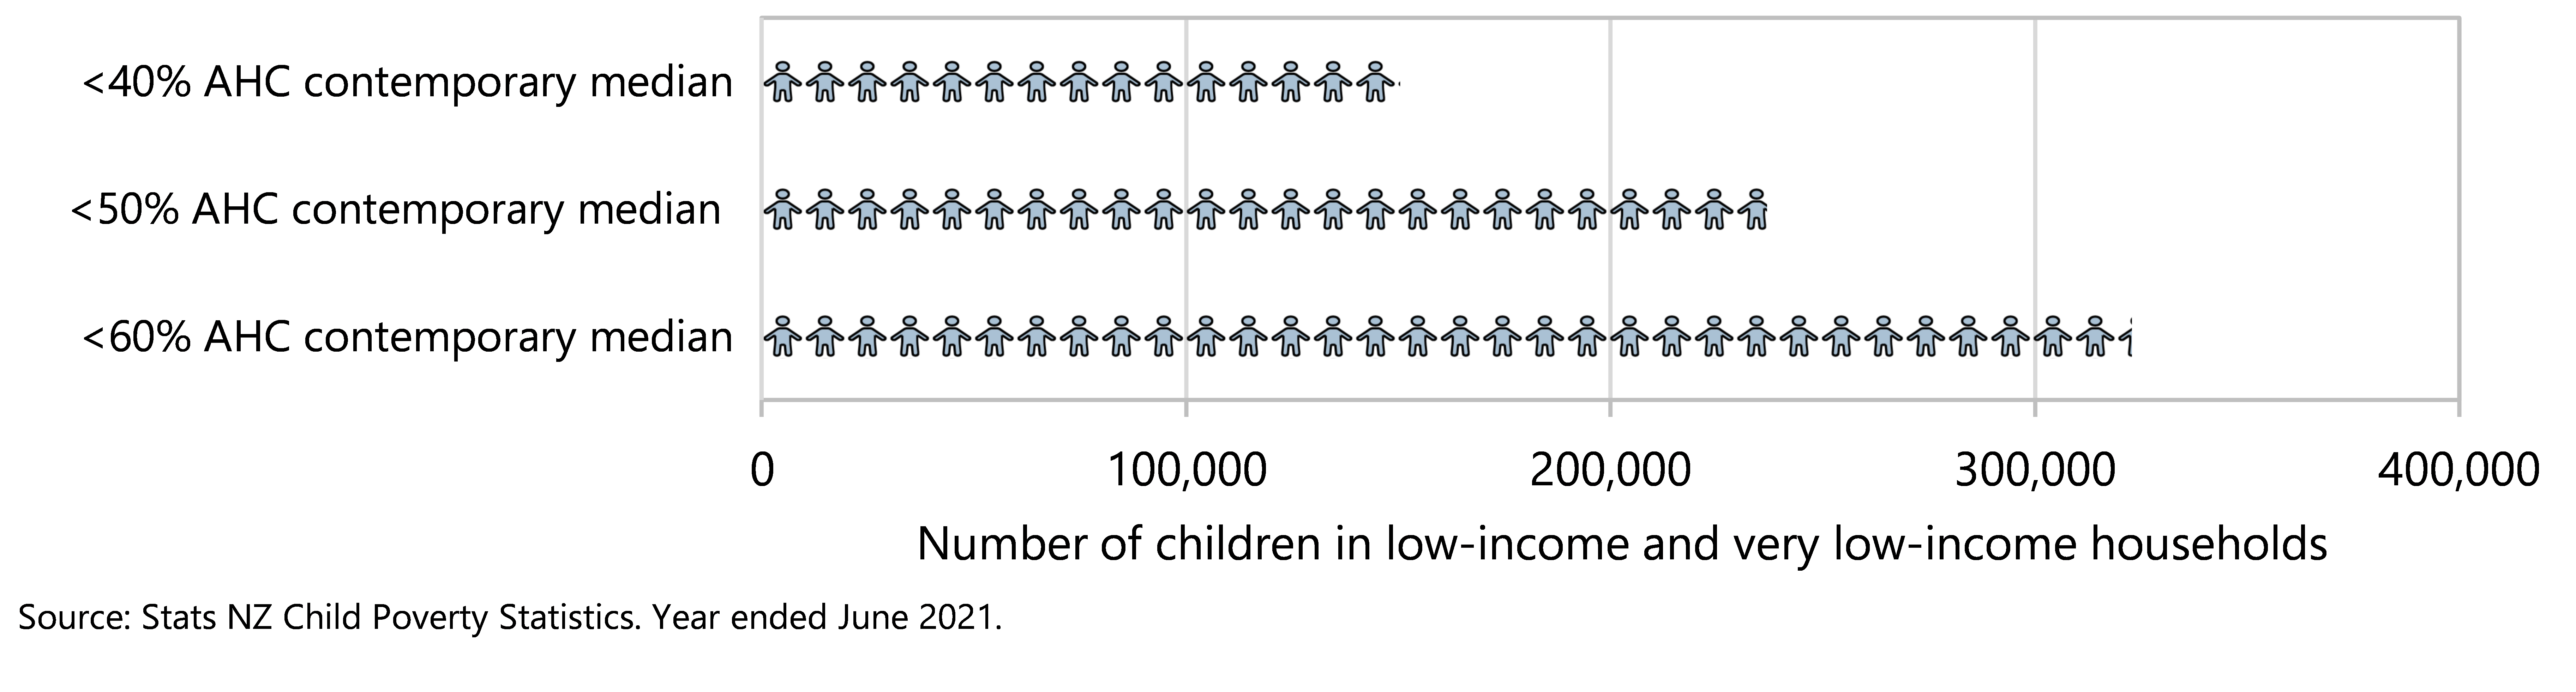
For every 100 children in 2020/21, an estimated 13 children lived in a household with an equivalised disposable income less than 40% of the median household income for that year, after housing costs; 21 children lived in a household with income less than 50% of the median, and 28 children lived in a household with income less than 60% of the median (Table 2). In numerical terms, after taking housing costs into consideration, as shown in Table 2 and Figure 4, there were approximately:
· 150,400 children (13.1%) living in a very-low-income household (equivalised disposable income less than 40% of the contemporary median)
· 236,900 children (20.6%) living in a low-income household (equivalised disposable income less than 50% of the contemporary median)
· 322,900 children (28.1%) living in a household with equivalised disposable income less than 60% of the contemporary median.
Figure 4. Children in low-income and very low-income households (income less than 40%, 50% and 60% of the median household income) after housing costs (AHC), by income threshold, Aotearoa 2020/21
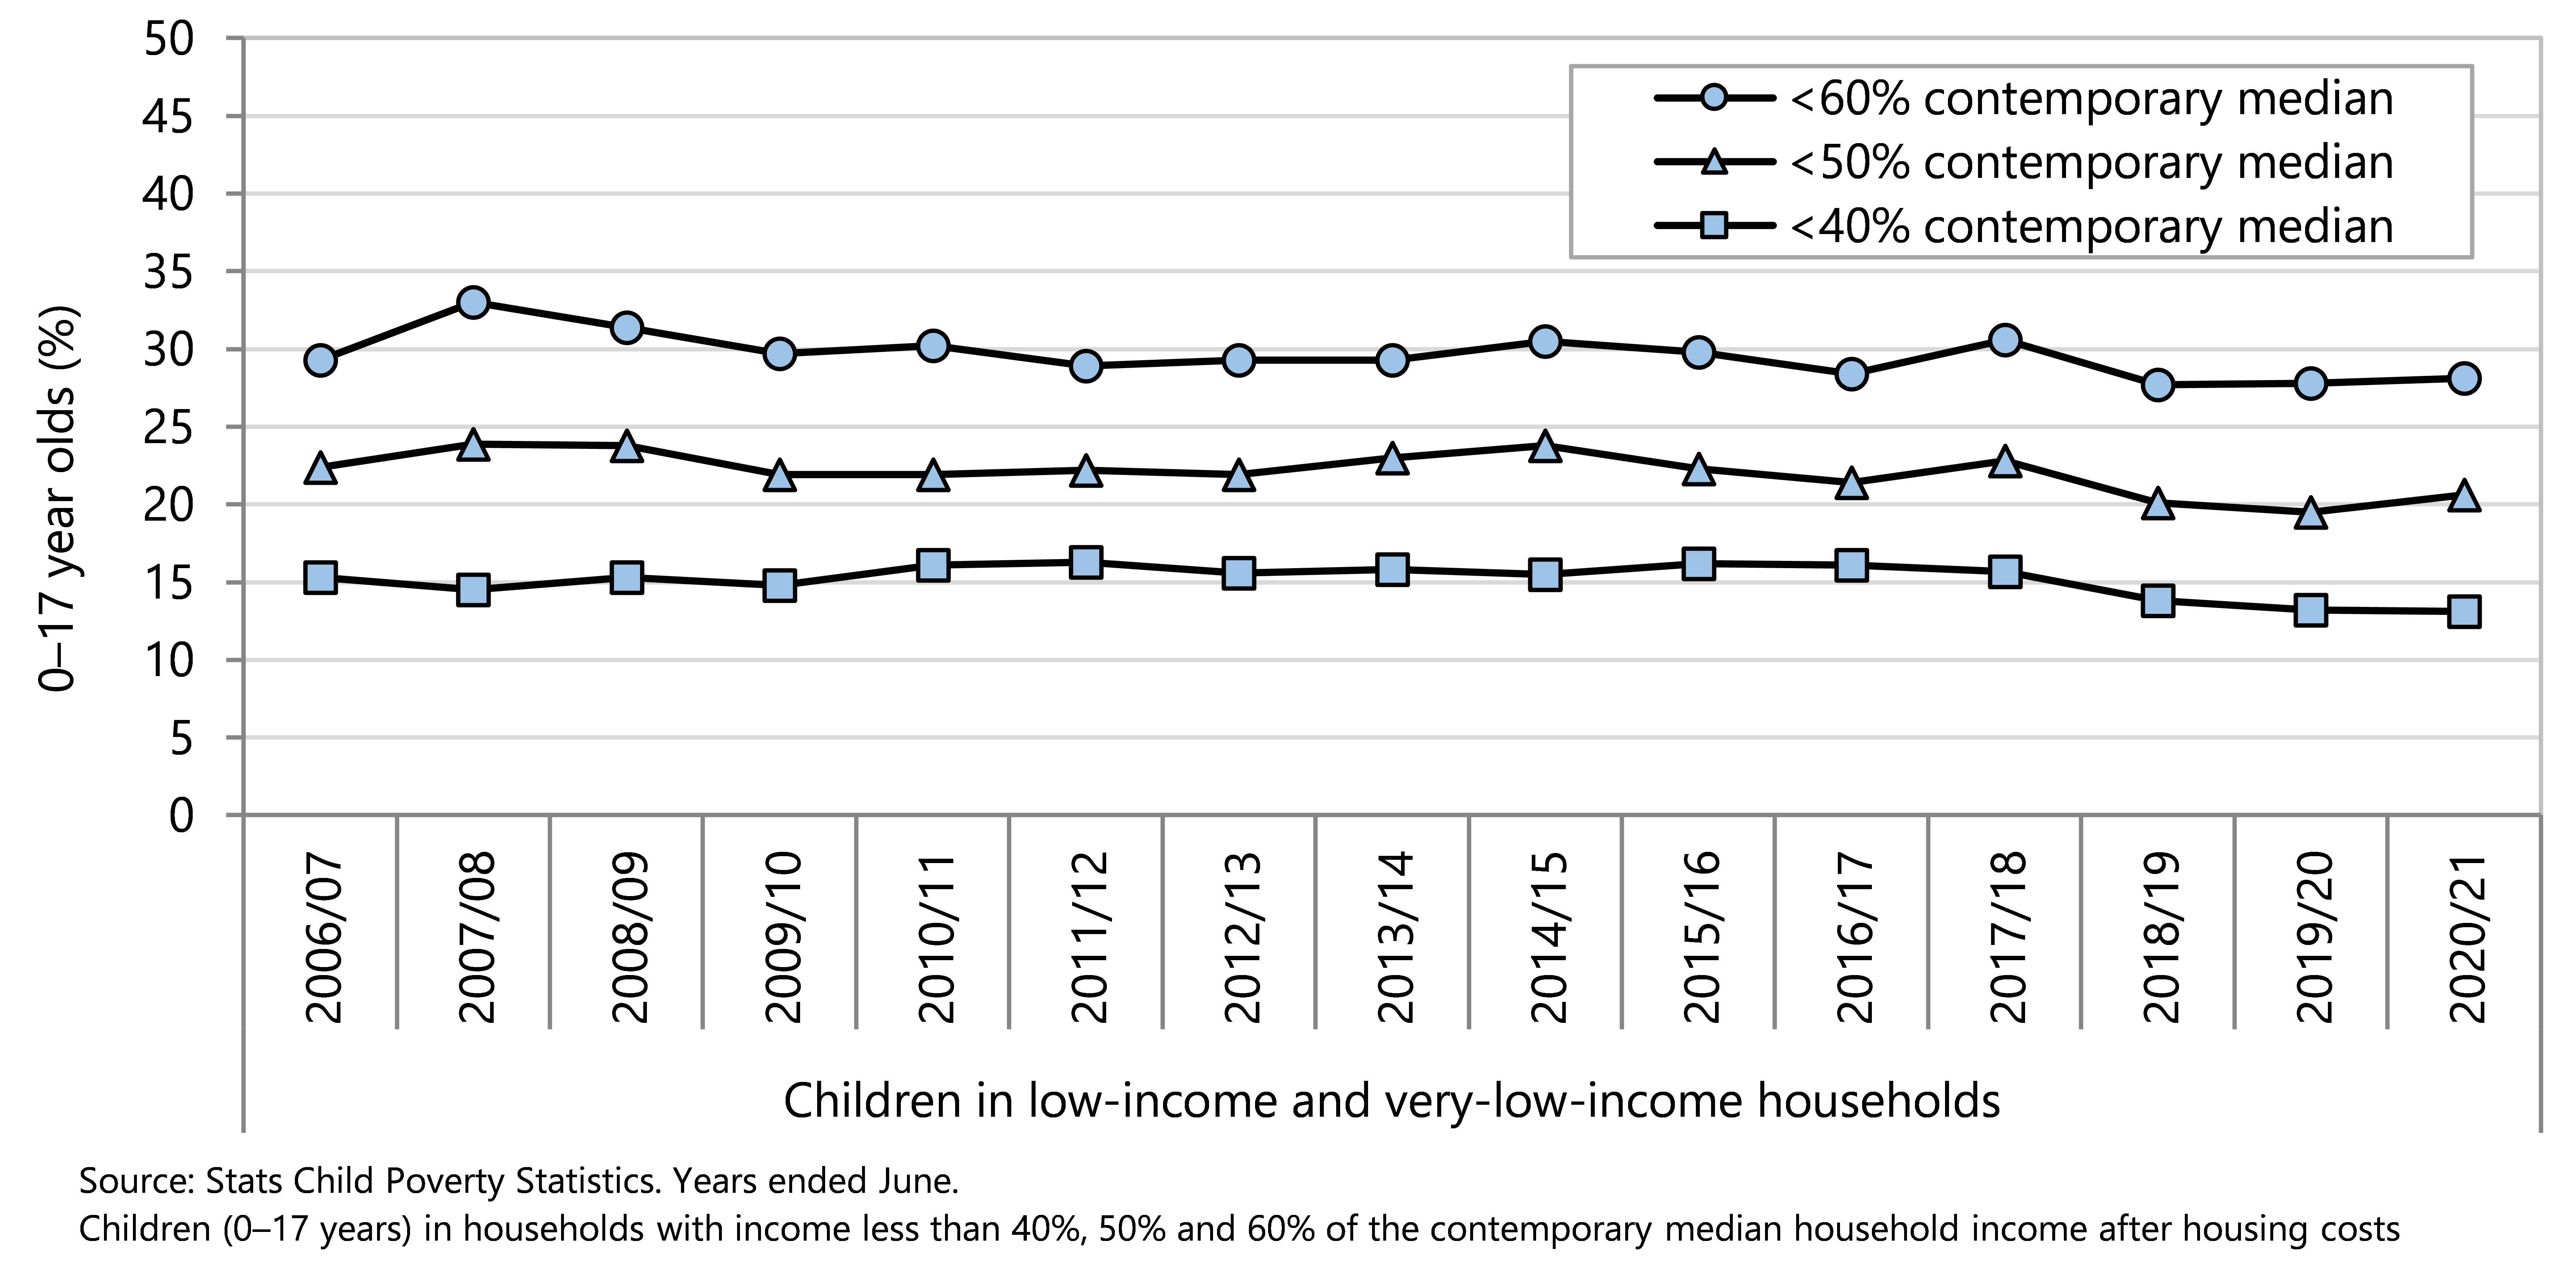
Since 2006/07, over 300,000 children have lived in a household with an equivalised disposable income less than 60% of the median after housing costs for that year, and in 2020/21, almost one in seven lived in households experiencing severe income poverty (less than 40% of the median income) ( Table 2, Figure 5). Since 2010/11, there has been a slight decline in the proportion of children living in low‑income households using the contemporary median measures (Figure 5). Data collection for the 2019/20 year stopped in March 2020 and was interrupted in 2020/21 due to COVID-19 pandemic protections, and so the sample sizes were smaller than planned in those survey years.21 Despite the reduction in sample size with higher margins of error, Stats NZ is confident the data are fit for purpose.
Figure 5. Children in low-income and very low-income households (less than 40%, 50% and 60% contemporary median after housing costs), Aotearoa 2006/07–2020/21
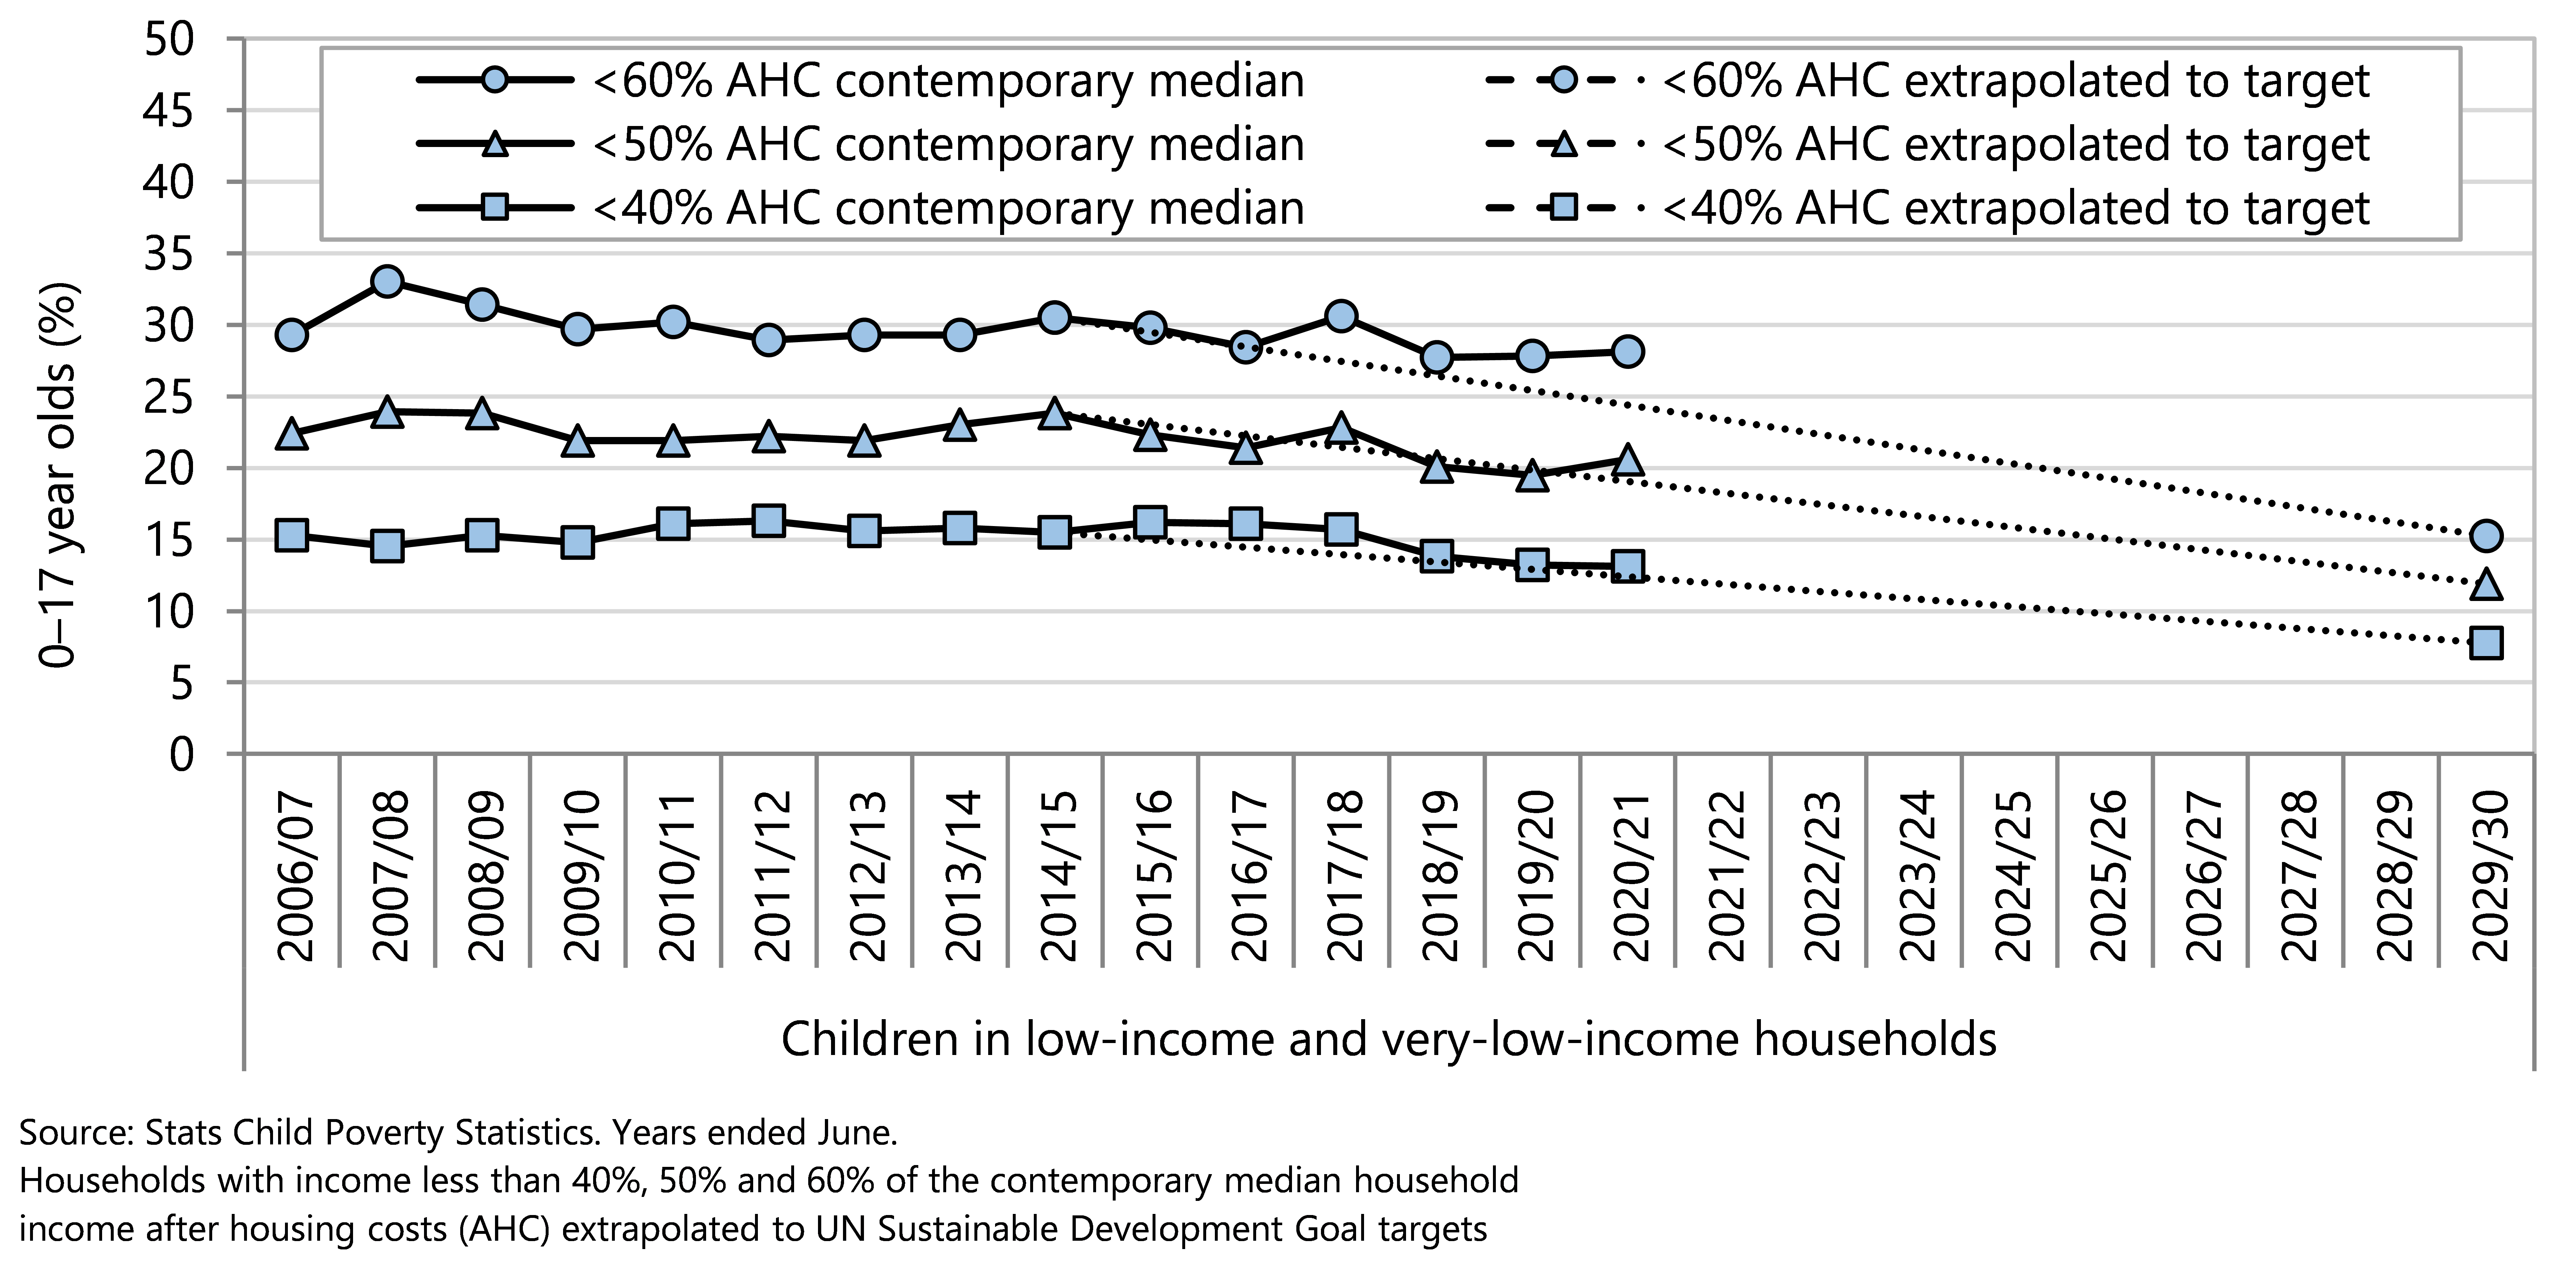
The United Nations (UN) global goals for sustainable development (SDGs) include reducing all forms of poverty to at least half of the values as at 2015.18 Figure 6 applies the SDG targets to contemporary median thresholds for child poverty, after housing costs, which are supplementary measures set out in the Child Poverty Reduction Act 2018.7
Government will need to implement effective policies to reduce the proportion of children living in low-income and very-low-income households in order to achieve the 2030 SDG targets for child poverty reduction (Figure 6).
Figure 6. Children in low-income and very low-income households (less than 40%, 50% and 60% contemporary median after housing costs) extrapolated to UN Sustainable Development Goal targets, Aotearoa 2006/07–2029/30
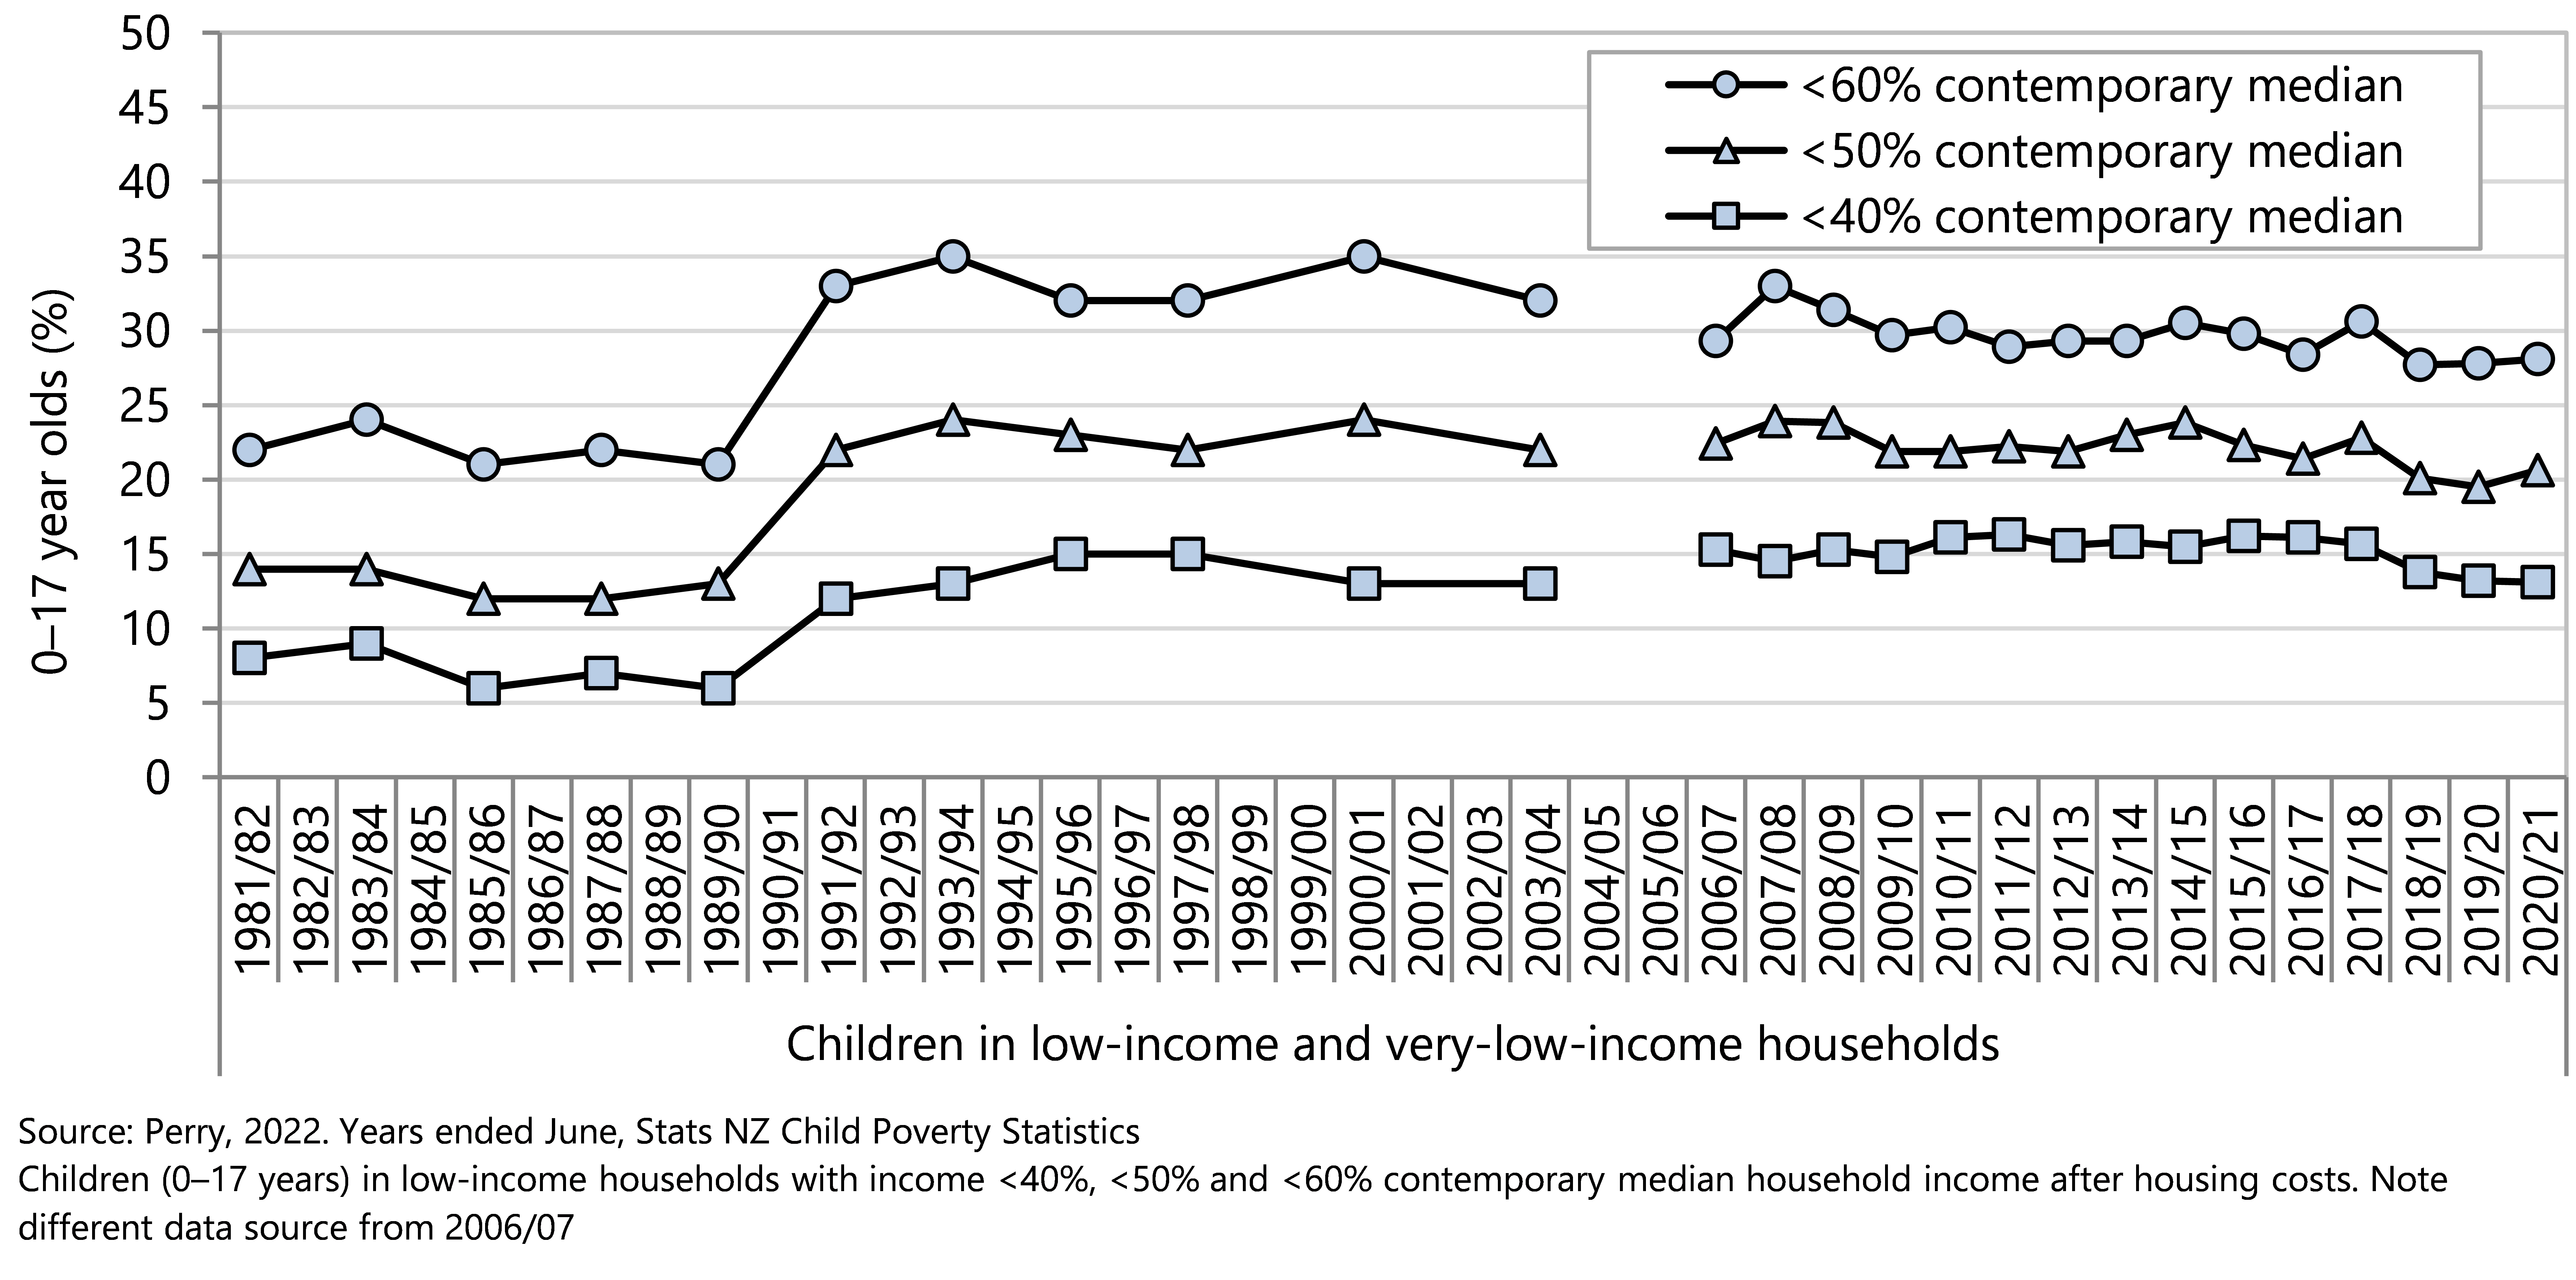
A longer-term perspective
A long-run time series from the Ministry of Social Development13,20 (using older methodology for calculating income poverty) shows the proportion of children living in low- and very-low-income households. In the 1980s, 18-20% of households with children experienced income poverty after housing costs, when compared to the fixed median incomes. This proportion sharply increased in the early 1990s; at this time there was high unemployment, decreased average wages, benefit cuts, and introduction of market rents for social housing.13 Since this time, there have been changes in taxation/tax credits (Working for Families), higher employment (especially for women), increased average wages, and income-related rents for social housing, which has decreased the proportions of households with income poverty from the 1990s.13
Since 2013, the proportion of households with children in low-income households, after housing, (compared to fixed median incomes) has declined, reflecting good economic conditions, a rising minimum wage and, more recently, higher housing support through changes to the Accommodation Supplement and increases in incomes for beneficiary families and households.
The proportion of children who have income poverty after housing costs, (relative to the contemporary median) remained fairly stable from 1993 to 2018, with a slight decline since then; this suggests that there has not been a marked change in income inequality (after housing costs) at the lower end of the income distribution (Figute 7).
Figure 7 . Children in low-income and very low-income households (income less than 40%, 50% and 60% of the contemporary median household income) after housing costs (AHC), Aotearoa 1981/82–2021
Essentials for a good life
Day-to-day living conditions in which children live, learn, grow, and play affect their health and wellbeing.22,18 Access to essential items is associated with equitable opportunities for children and young people to thrive and reach their potential.22 Material hardship at household level in Aotearoa is monitored using a 17-item index (DEP-17) that determines whether households experience enforced lack of essentials due to cost, a high level of economising in order to afford essentials, insufficient funds to pay for essential services, or high levels of financial stress and vulnerability. All 17 items in the DEP-17 index are considered essential and are enjoyed by almost all households. An enforced lack is where a household misses out on an item in the DEP-17 index because of cost.23 Material hardship is defined where a household experiences the enforced lack of six or more essentials. Severe material hardship is when a household experiences the enforced lack of nine or more essentials on DEP-17.24 Material hardship reflects the day-to-day living conditions of the households in which children live.
The New Zealand Government has set intermediate and long-term targets for reduction of material hardship, as shown in Table 3 .
Internationally, the Sustainable Development Goals require that material hardship, or unacceptably low material wellbeing,13 be reduced by at least half between 2015 and 2030 (Goal 1.2) as a dimension of poverty.
This section of the Child Poverty Monitor presents information on children aged 0–17 years living in households experiencing material hardship using data gathered in the New Zealand Household Economic Surveys (NZHES) and analysed using DEP-17. The most recent data are from the 2021 NZHES year (ending June 2021).
Table 3. New Zealand Government material hardship target set under the Child Poverty Reduction Act 2018.
| Primary measure | Intermediate (3-year) target | Second intermediate (3-year target) | Long-term (10-year) target |
| Material hardship | 10.3% of children in the 2020/21 financial year | 9% of children in the 2023/24 financial year | 6% of children in the 2027/28 financial year |
| Source: New Zealand Gazette 16,17
| |||
Data sources and methods
Indicator
Children in households experiencing material hardship
Children in households experiencing severe material hardship
Definitions
Children are persons aged under 18 years.
A household is one person who usually resides alone or two or more people who usually reside together and share facilities (e.g. eating, cooking, bathroom and toilet, living area).
A child is a member of a household if they live there for four or more nights per week, or spend equal time in this and another household and were present during the survey week.
Material hardship is unacceptably low material wellbeing.13 Experienced by children, material hardship is living in households who were lacking basic/essential child-specific items because of cost. Where a household does not have the opportunity to have or do an essential because of cost, it is considered an enforced lack .
The material hardship threshold is an enforced lack of six or more (≥6) DEP-17 items.23
The severe material hardship threshold is an enforced lack of nine or more (≥9) DEP-17 items.23
Data sources
Stats NZ Child Poverty Statistics 19, Perry report: Child Poverty in New Zealand.20
Additional information
DEP-17 is an index of material hardship or deprivation, particularly suited to capturing the living standards of those at the low end of the material living standards continuum.25
DEP-17 items
Enforced lack of essentials (because of cost)
Do not have a meal with meat, fish or chicken (or vegetarian equivalent) at least each 2nd day
Do not have two pairs of shoes in good repair and suitable for everyday use
Do not have suitable clothes for important or special occasions
Do not give presents for family and friends on special occasions
Do not have home contents insurance
Economised, cut back or delayed purchases ‘a lot’ because money was needed for other essentials
Went without fresh fruit and vegetables
Bought cheaper cuts of meat or bought less than would have liked
Postponed visits to the doctor
Postponed visits to the dentist
Did without or cut back on trips to the shops or other local places
Put up with being cold (to keep costs down)
Delayed repairing or replacing broken or damaged appliances
Restrictions
Feel ‘very limited’ by money available when thinking about purchasing clothes or shoes for self
Could not pay an unexpected and unavoidable bill of $500 within a month without borrowing
Financial stress and vulnerability
In arrears more than once in last 12 months, because of shortage of cash at the time, not through forgetting:
Rates, electricity, water
Vehicle registration, insurance or warrant of fitness
Borrowed from friends or family more than once in last 12 months to cover everyday living expenses
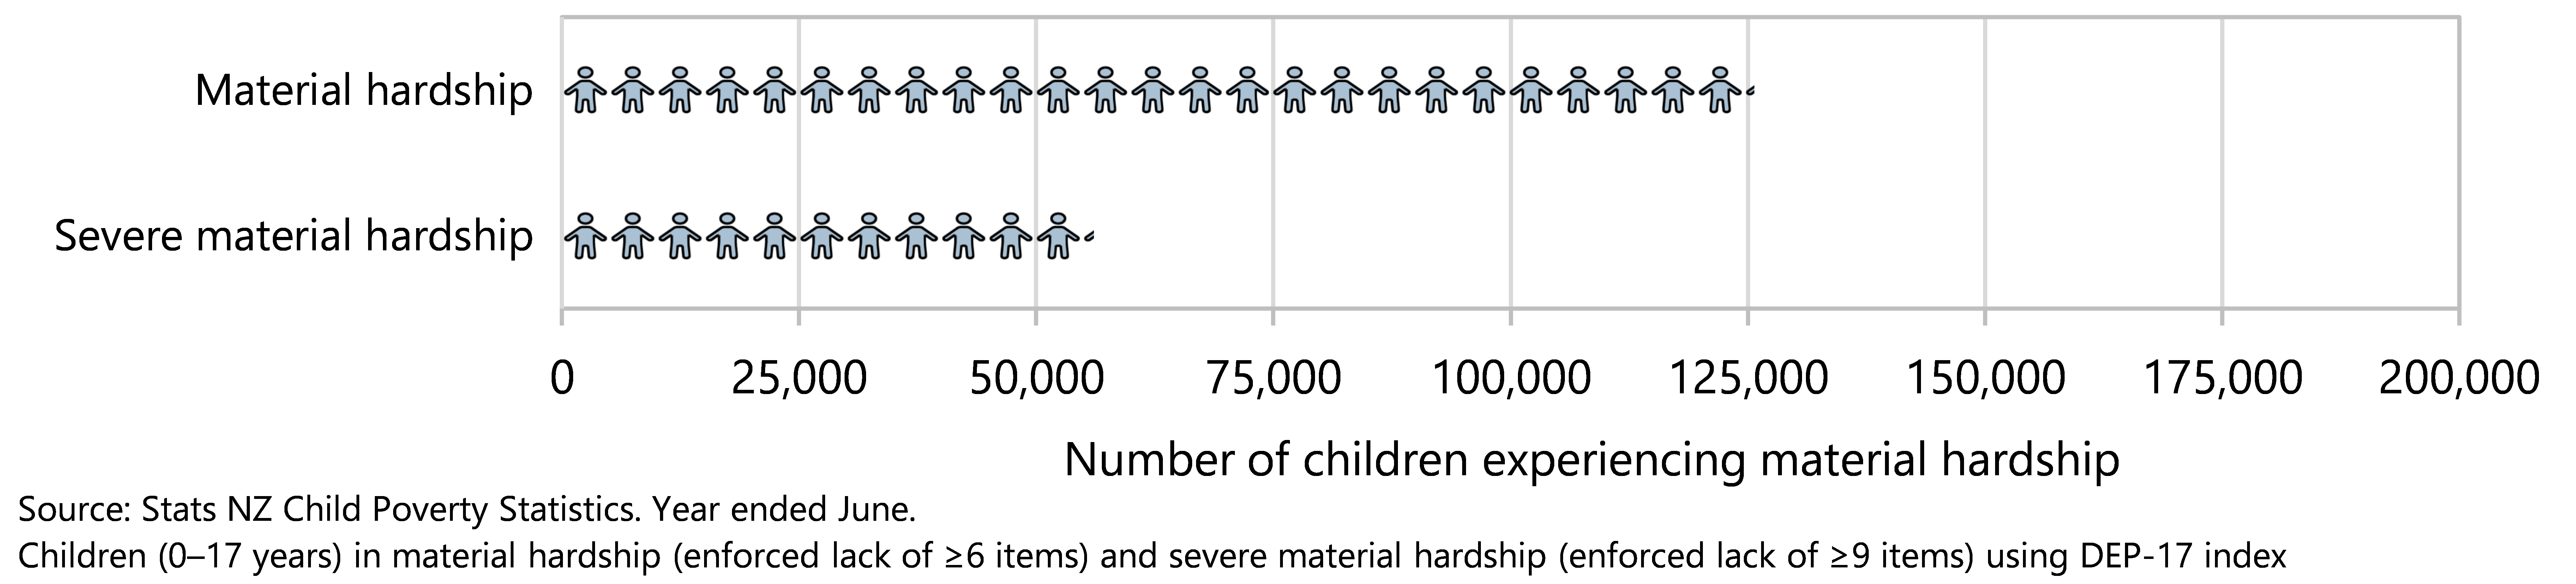
In 2020/21 almost 126,000 children in Aotearoa were in households that experienced unacceptably low material wellbeing, having to go without six or more of the essentials in DEP-17 (Figure 8). This represented 11.0% of all children. Essential lacks (due to cost) included in the DEP-17 index include postponing a visit to the doctor, putting up with feeling cold, not having two pairs of good shoes, going without fresh fruit or vegetables, or inability to pay the electricity or gas bills on time.
In the same year, 4.9% of children (approximately 56,100) experienced severe material hardship, having to go without nine or more essentials due to cost (Figure 8).
Figure 8. Children in households experiencing material hardship, by hardship threshold, Aotearoa 2020/21
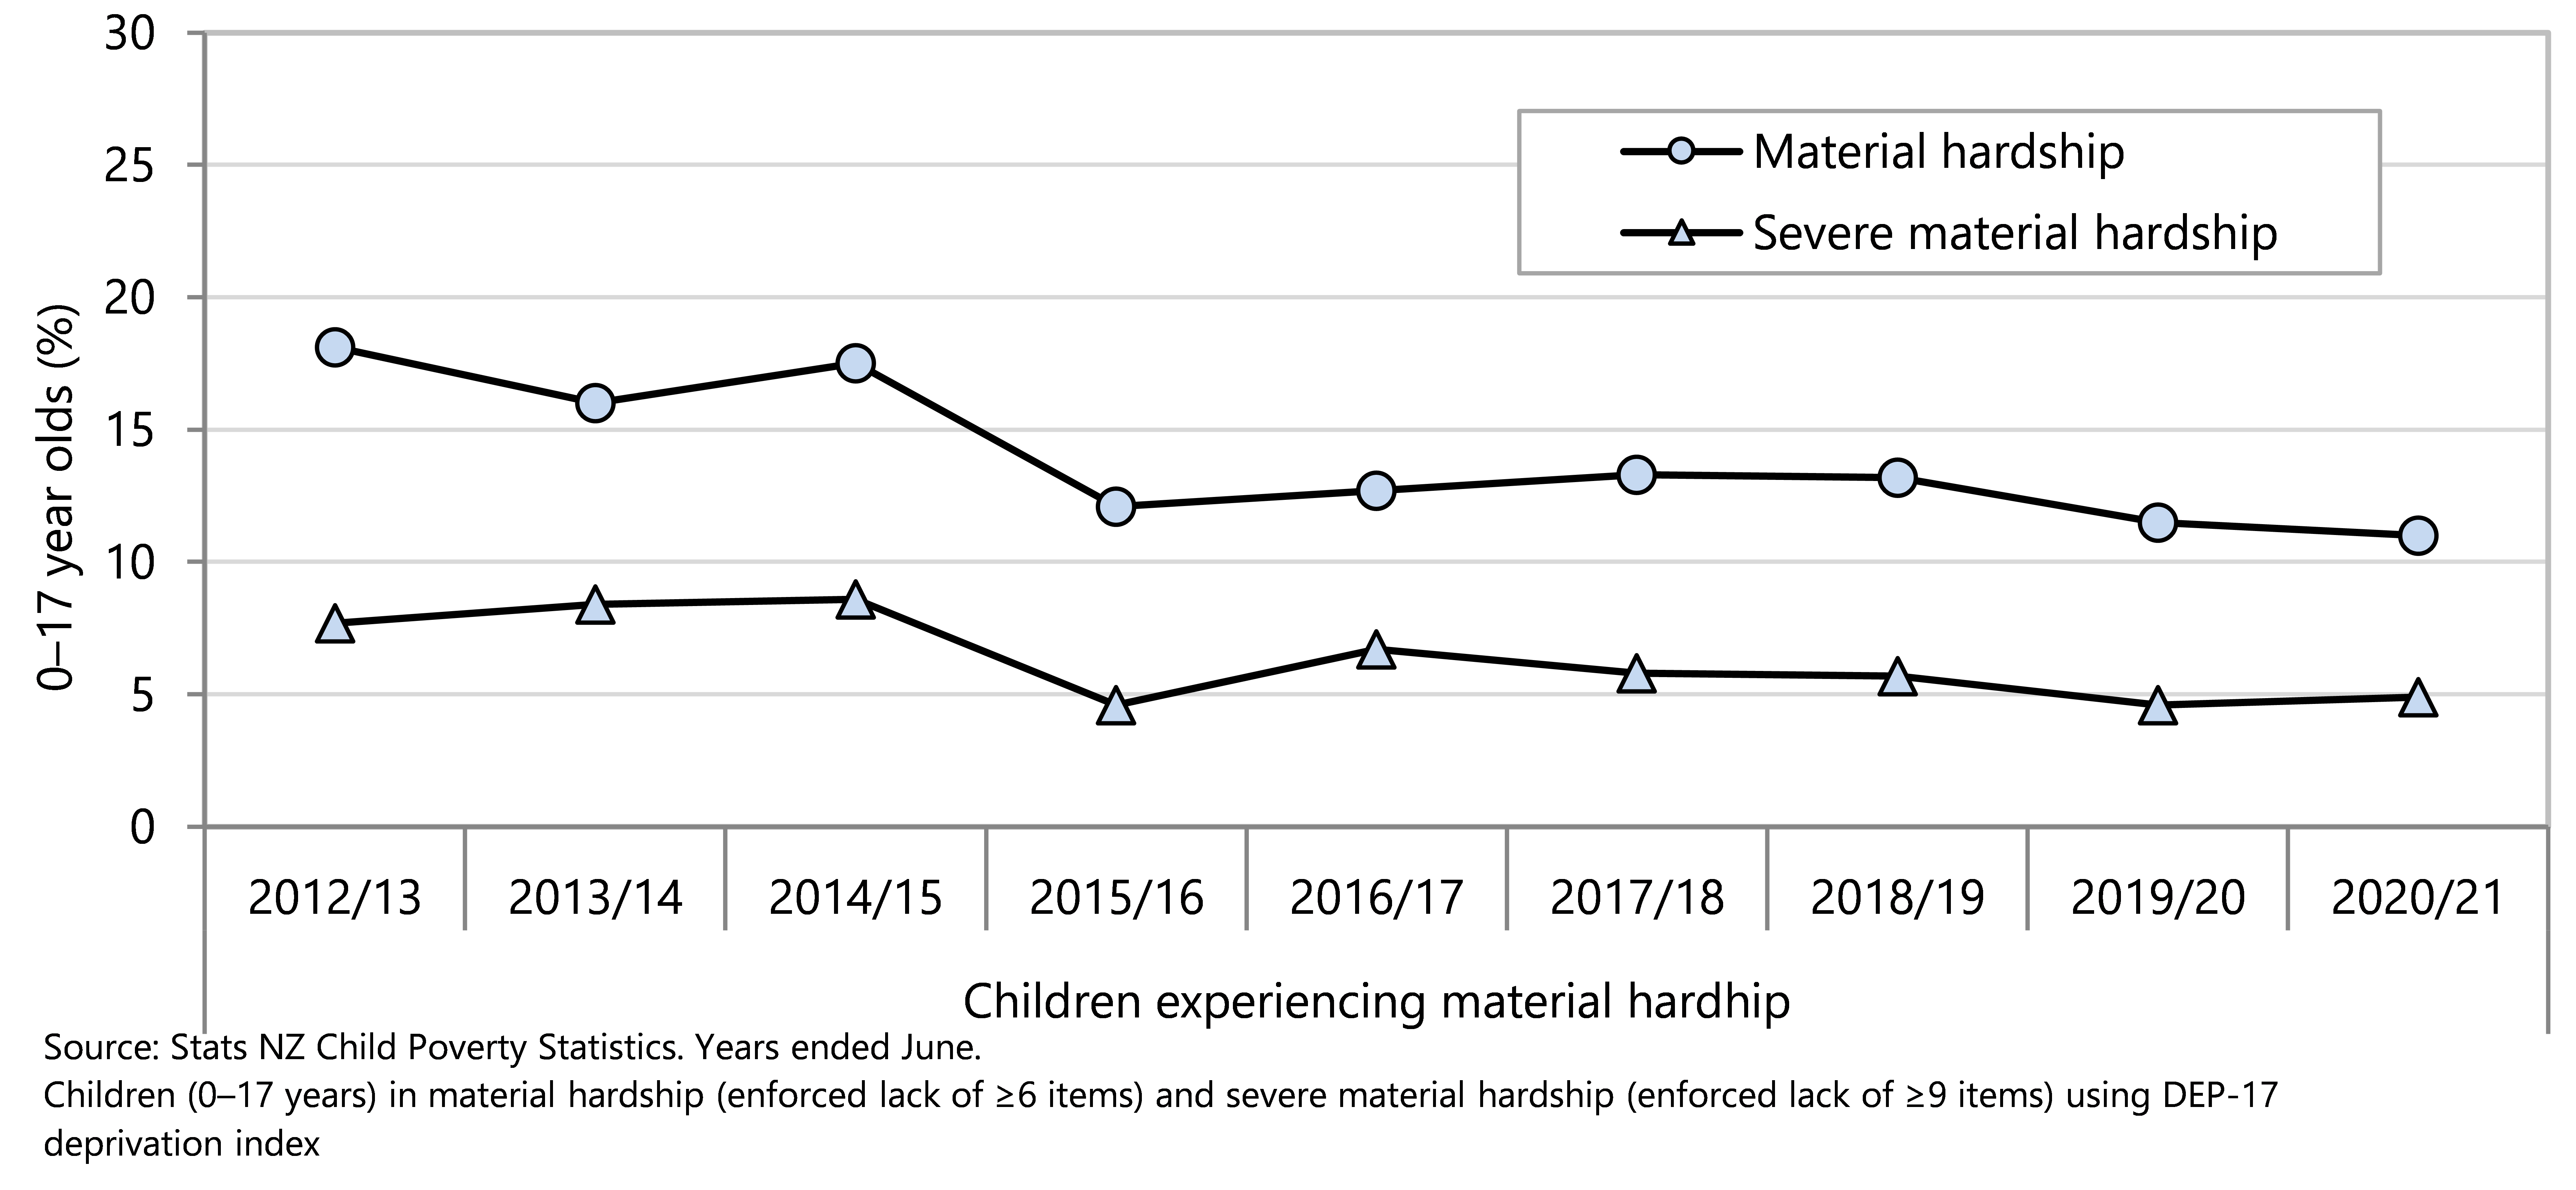
Since 2012/13, there has been an overall decline in the percentage of children in households experiencing material hardship and severe material hardship. Over this time-frame, an estimated 70,100 fewer children are living in households missing out on six or more essentials in 2020/21 compared with 2012/13 (Figure 9). The lower rate of material hardship in 2015/16 needs to be interpreted with caution, noting that in the household economic survey ending June 2016 there were fewer than expected sole parent households and households with children receiving financial assistance.24
Figure 9. Children in households experiencing material hardship, by hardship threshold, Aotearoa 2012/13-2020/21
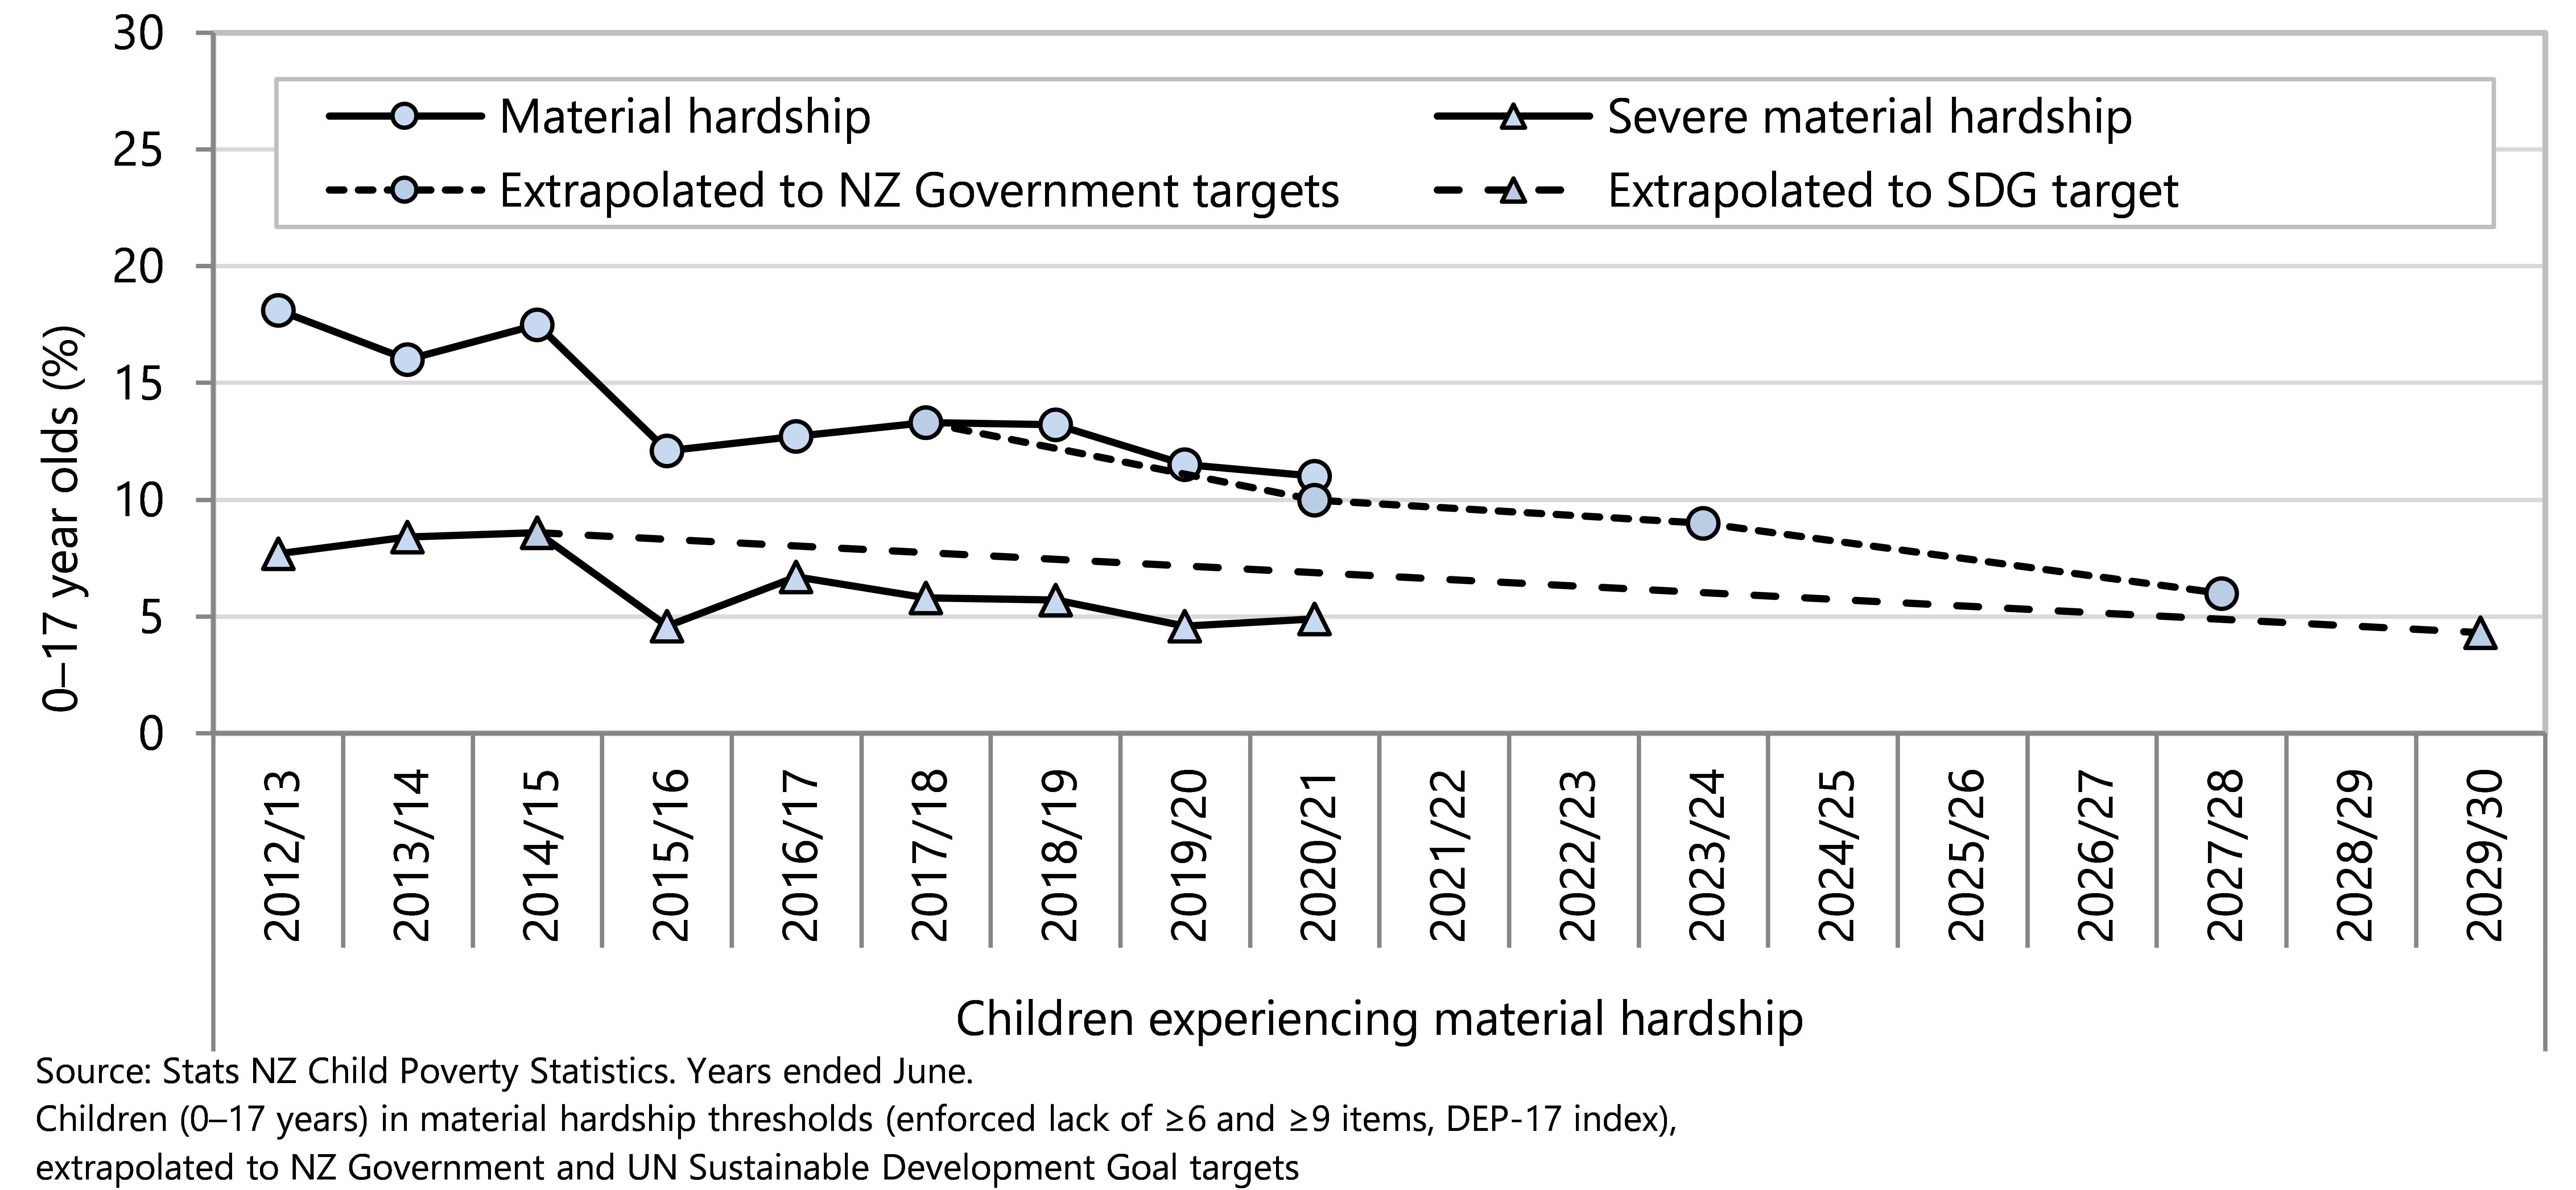
In 2020/21 the percentage of children in material hardship was 0.7% above the target and 5.0% from the 2027/28 target (Figure 10). In the case of severe material hardship, where there is no government target, Figure 10 shows that the percentage of children living in households with enforced lack of nine or more essentials in DEP-17 in 2020/21 was lower in 2019/20 and 2020/21 than in most previous years.
Figure 10 . Children in households experiencing material hardship, by hardship threshold, extrapolated to NZ Government and UN Sustainable Development Goal targets, Aotearoa, 2012/13–2030
Combined measures of income and access to essentials
Children in households that experience low income and material hardship have the greater restrictions on day-to-day activities than either households that are income-poor but not in material hardship, or households that experience material hardship but do not meet a low-income threshold.20 Not all households with low income experience material hardship; protective factors include the availability of liquid financial assets (savings and accessible investments), low levels of debt, whanau and community support, the ability to grow food, and access to less expensive housing such as papakāinga. Conversely it is possible to experience hardship while having a household income above the threshold, if there are significant costs for housing, health, or debt servicing.
In 2020/21 there were an estimated 76,100 children (6.6%) living in households with equivalised incomes less than 60% of the contemporary median household income after housing costs who also experienced an enforced lack of six or more of essentials in the DEP-17 index. There was an overall decline in the percentage of children in households experiencing both material hardship and income poverty from 2012/13 to 2020/21, with an estimated 37,700 fewer children in these circumstances in 2020/21 compared with 2012/13 (Figure 11). This overall decline will need to be sustained in order to at least meet the UN Sustainable Development Goal target of halving this measure of poverty for children in Aotearoa by 2030 (Figure 12).
The combined measure specified in the Child Poverty Reduction Act is:
· Percentage of children living in households with less than 60% of the median equivalised disposable household income after housing costs are deducted and experiencing material hardship
Figure 11. Children in households with both low income and material hardship, Aotearoa 2012/13–2020/21
Figure 12. Children in households with both low income and material hardship extrapolated to UN Sustainable Development Goal target, Aotearoa 2012/13–2029/30
Leave no child behind
In looking at overall progress toward the Government targets it is possible to overlook inequity in outcomes between groups of children. The 2020/21 Child Poverty Statistics presented data for disabled children, non-disabled children, children living in households with at least one disabled person and children living in households with no disabled people. Data by ethnicity are available in the Child Poverty Statistics from 2018/19 to 2020/21. 19
This indicator presents information from the Child Poverty Statistics dataset on progress toward Government targets for the three current primary measures of child poverty. Stats NZ uses total response ethnicity data, in which children who identify with more than one ethnic group will be counted in both groups. Percentages may therefore add to more than 100%.
As seen earlier in this section, in 2020/21 overall 13.6% of under-18-year-olds were living in households with equivalised disposable income before housing costs below 50% of the contemporary median, and 16.3% were living in households with equivalised disposable income after housing costs below 50% of the fixed-line median (anchored to the 2017/18 financial year). These figures were on track to meet, or had already met, the Government’s 2020/21 targets.
When disaggregated by ethnicity it is evident that the combination of historical and recent policies has advantaged European children (Figure 13). Interventions to date have left Māori and Pacific children behind with 18.1% of Māori children living in households with equivalised disposable income before housing costs below 50% of the contemporary median (2020/21 target is 10.5%) and 17.2% of Pacific children in this category. The 2020/21 Government target is for 18.8% of children to be living in households with equivalised disposable income after housing costs below 50% of the fixed-line median; in 2020/21 this figure was 17.8% for Māori children and 16.3% for Pacific children.
The difference was even greater for material hardship, with European 0–17 year olds already well below the target of 10.3% of children living in households experiencing material hardship whereas 20.2% of Māori and 24% of Pacific children were living in households experiencing significant restrictions or deprivations of essential items (Figure 13). These disparities were even more marked for severe material hardship, when households go without nine or more essentials. In 2020/21, 9.5% of Māori children and 10.6% of Pacific children were living in households experiencing severe material hardship, compared to 3.5% of European children (Figure 13).
Figure 13. Children in low-income households, and children in households experiencing material hardship and severe material hardship, by ethnicity, Aotearoa 2020/21
On all primary measures a higher proportion of disabled children, and children living in a household with at least one disabled person, experienced household-level low income and material hardship compared with non-disabled children and children living in households where no member was disabled (Figure 14). Children aged 2–4 years are disabled if they have serious difficulty with at least one of the following: seeing (even with glasses), hearing (even with hearing aids), walking, manual dexterity, communicating, learning, playing or controlling their own behaviour. For older children, further difficulties are added, including: difficulty feeding or dressing themselves, remembering or concentrating, accepting change, making friends, anxiety, or depression. Adults aged over 18 years are disabled if they have at least one of the difficulties already mentioned or have difficulties with upper body strength or manual dexterity. Children aged under 2 years are not assessed for disability.19
In 2020/21, 15.5% of disabled children, and 17.3% of children living in a disabled household, were in households with median equivalised disposable income before housing costs below 50% of the contemporary median (2020/21 target is 10.5%). At this same time, 17.6% of disabled children, and 18.8% of children living in a disabled household, were in households with equivalised disposable income after housing costs below 50% of the fixed-line median.
One in five disabled children (20.5%) live in households experiencing material hardship, which is more than double the rate for non-disabled children (9.7%) (Figure 14). Severe material hardship is experienced by 10.3% of children who are disabled, or by those living in a household with a disabled person, compared to much lower rates of severe material hardship experienced by non-disabled children (4.2%), and those living in a non-disabled household (2.5%) (Figure 14).19
Figure 14. Children in low-income households, and children in households experiencing material hardship and severe material hardship, by disability status, Aotearoa 2020/21
Households that pay rent experience much higher proportions of income poverty and material hardship than those who own their own homes, (with or without a mortgage).
In 2020/21, 20% of children living in households that pay rent were in low-income households with equivalised disposable income before housing costs below 50% of the contemporary median, compared to 7.5% of households who were living in their own dwelling and making mortgage payments. Similarly, 24.6% of children who live in households paying rent had an equivalised disposable income after housing costs below 50% of the fixed-line median, compared with 11.6% of those households living in their own home (Figure 15).19
Over the same time-frame, 22% of households who pay rent were also experiencing material hardship, compared to other kinds of households, who had rates of material hardship of less than 5%. More than 10% of households with children who were paying rent experienced severe material hardship in 2020/21, while this proportion was less than 1% of those households with children living in their own homes (Figure 15).19
Figure 15. Children in low-income households, and children in households experiencing material hardship and severe material hardship, by housing tenure, Aotearoa 2020/21
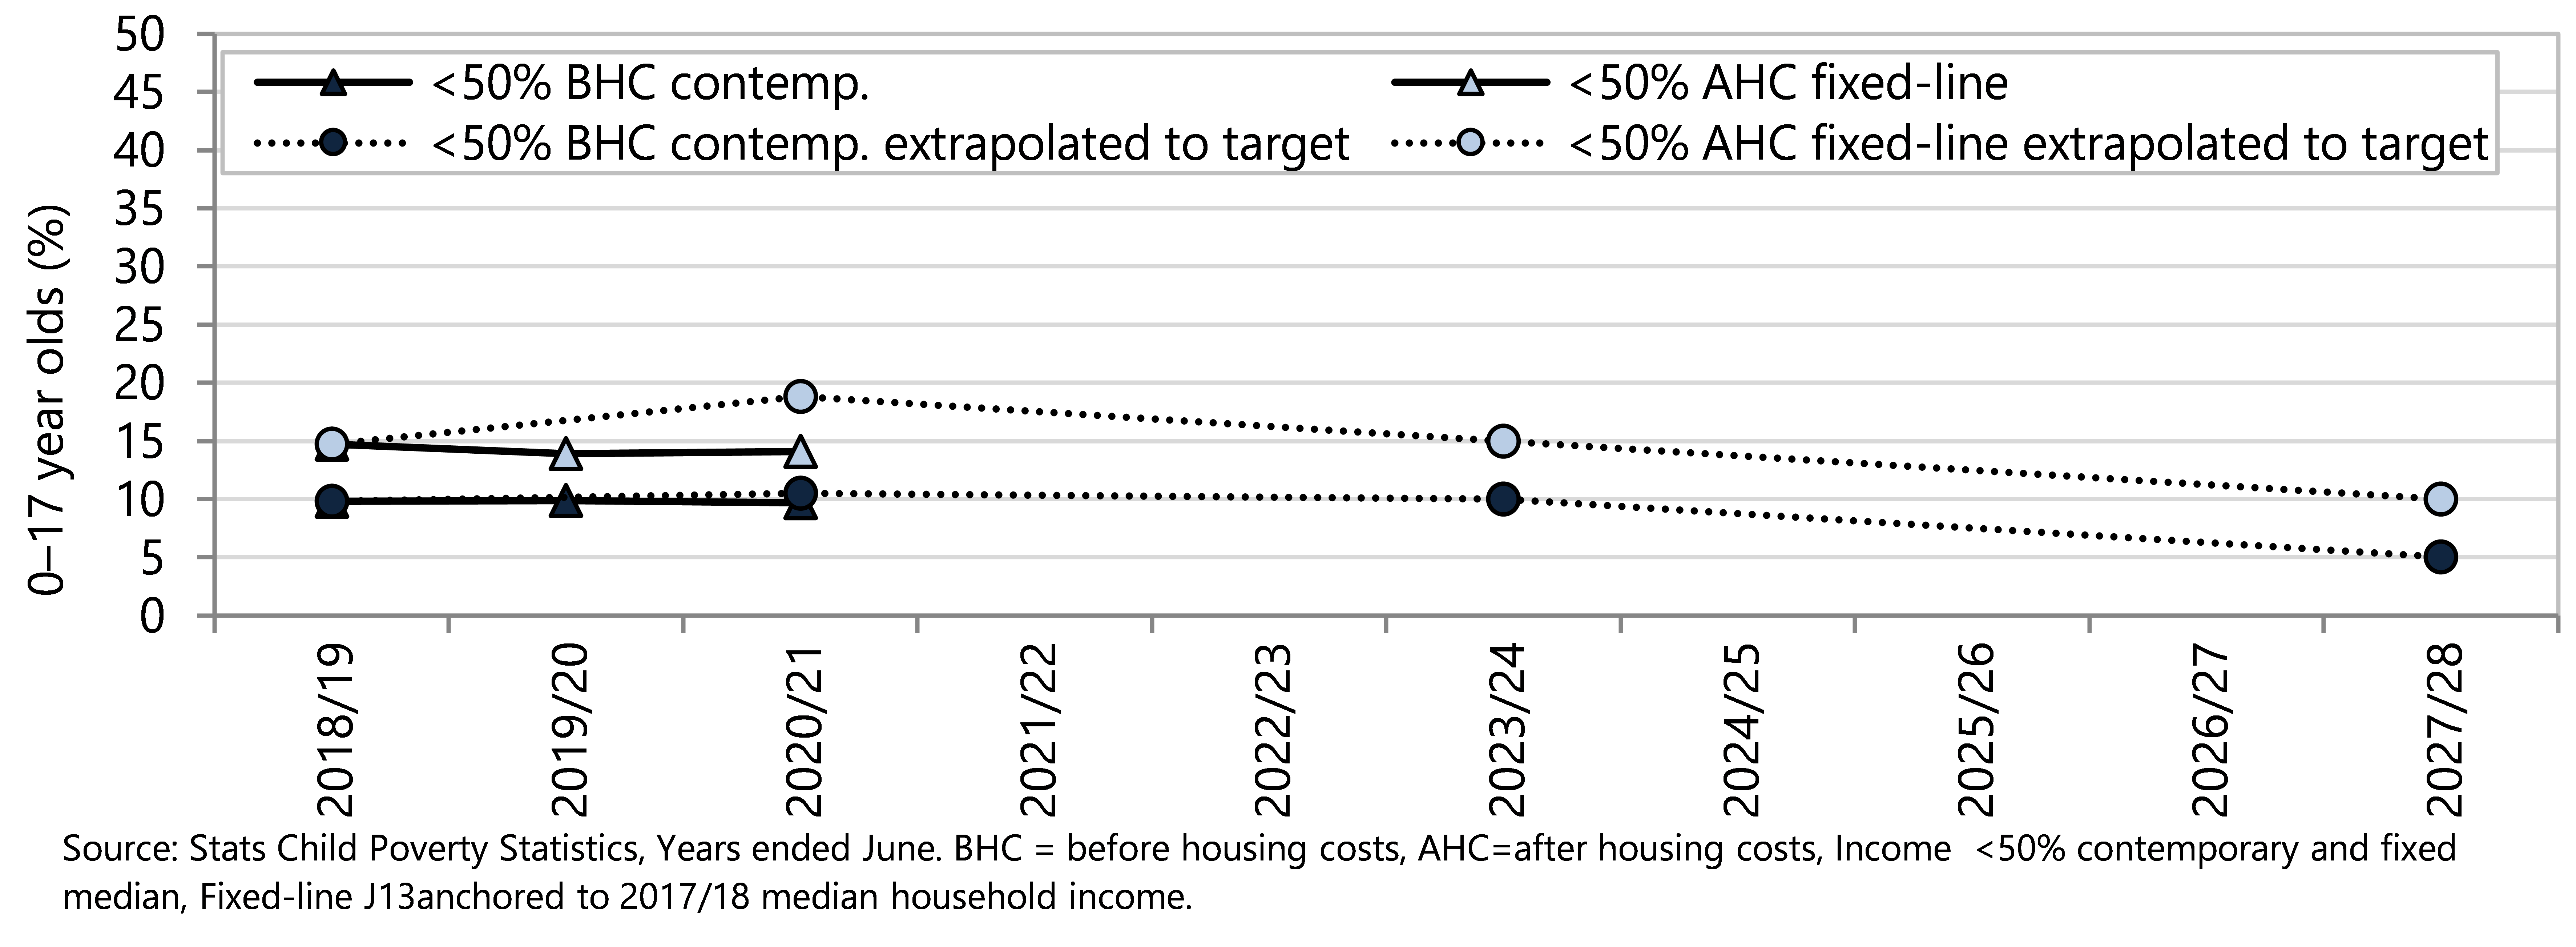
It is acknowledged that low-income and material hardship rates do not necessarily result in children being deprived of a ‘good life’ - many children growing up in hardship experience love and support from their whānau, families and aiga around them. However, missing out on essentials can make children sick, affect their education, and have long term impacts on their lives. A much more targeted effort will be needed to get fair and just outcomes for all children. Strong policy and practice initiatives are needed for every child in Aotearoa to have the resources that they need to thrive. From 2018/19 to 2020/21 the proportion of European children living below the poverty line (defined as less than 50% of the fixed-line median equivalised household income after housing costs) was already below the 2020/21 target (Figure 16).
Figure 16. European children in low-income households extrapolated to Government targets Aotearoa 2018/19 extrapolated to 2027/28
This intermediate target has now also been met for Māori children (Figure 17) and Pacific children (Figure 18), (2020/21 fixed-line target <50% median AHC).
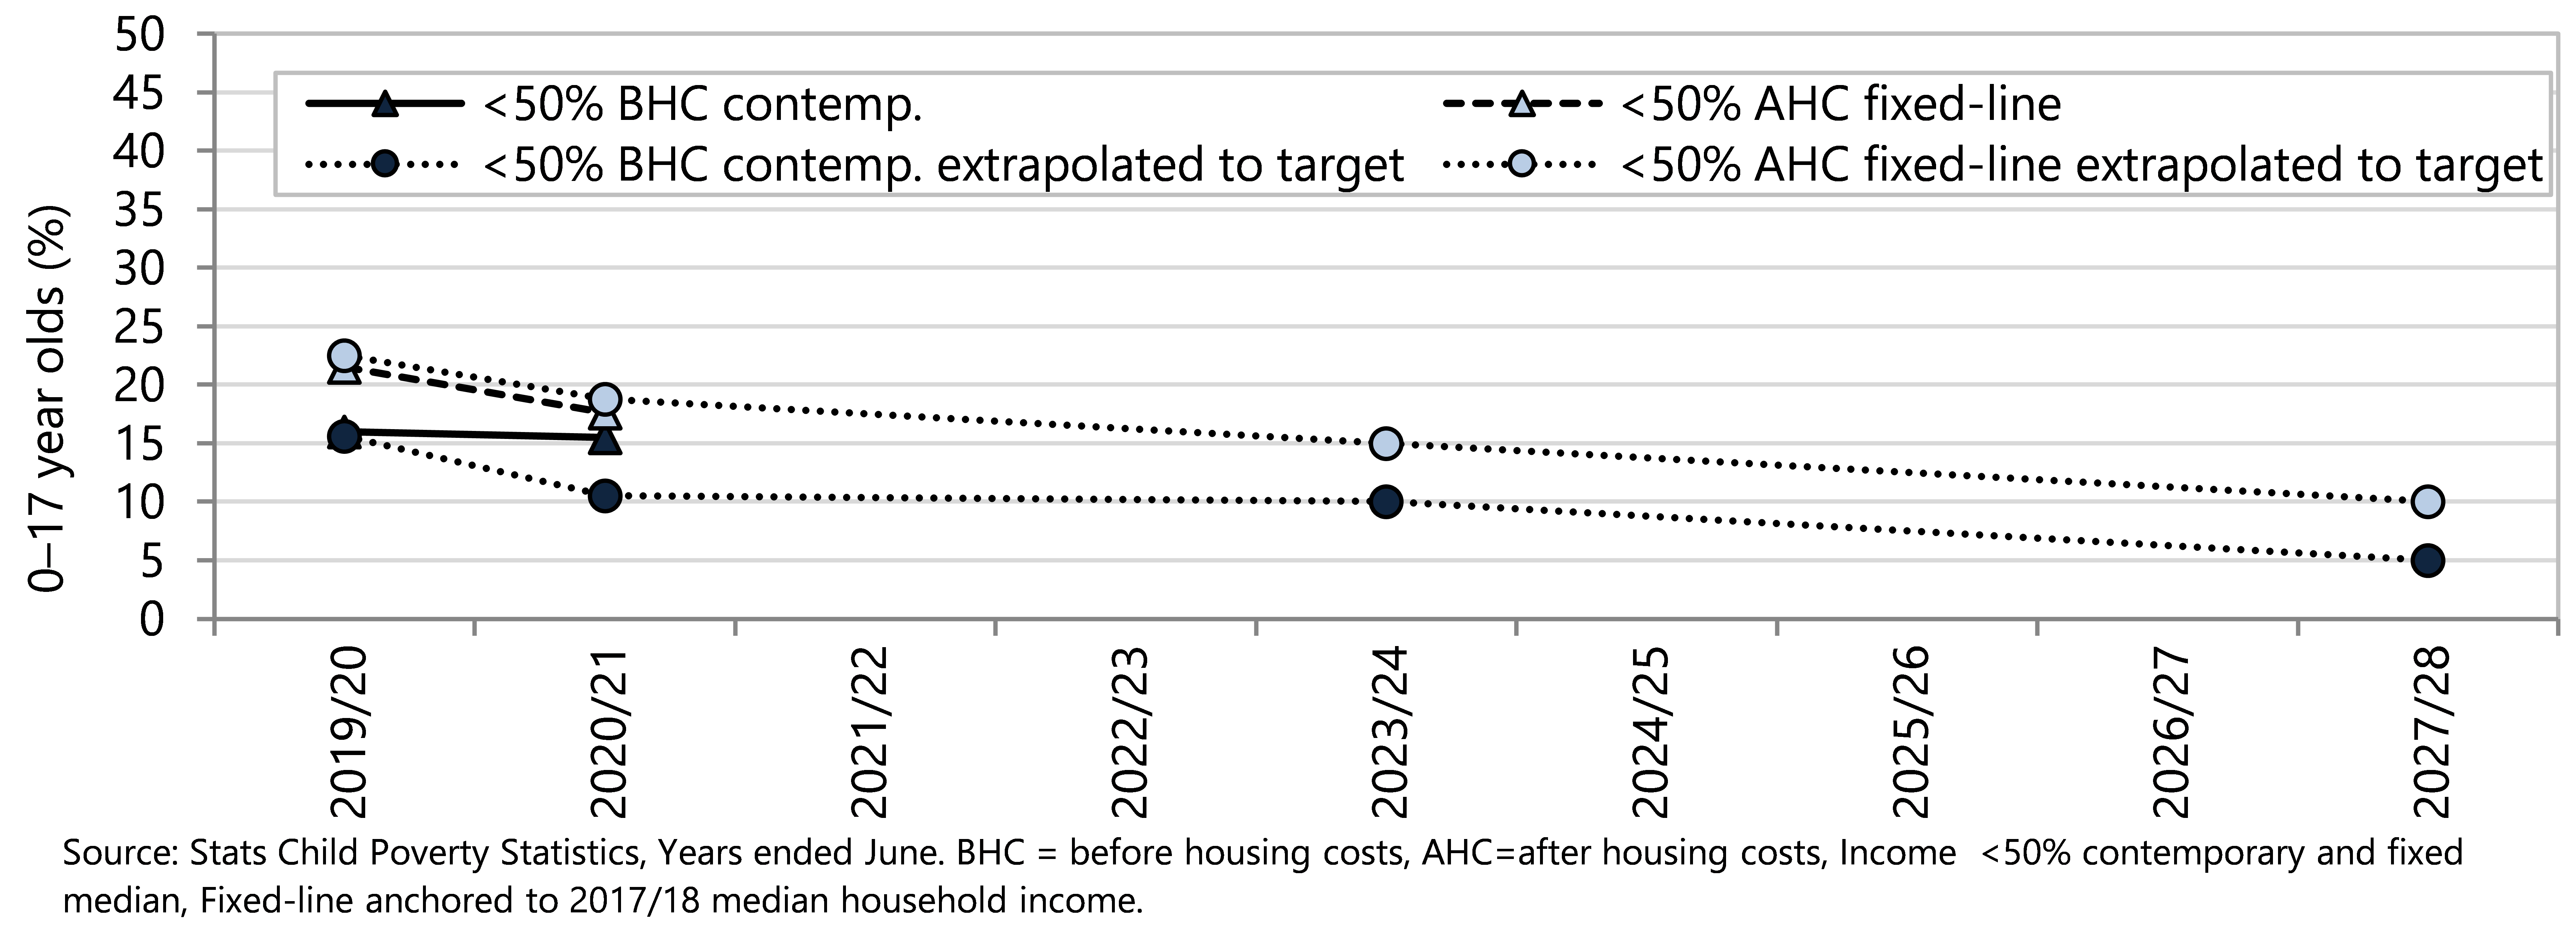
However, the intermediate target for the before housing cost poverty measure (10.5% at June 2021) has not been met either overall (13.6%) or for any cohort described below.
Policy and practice resulted in no change from 2018/19 to 2020/21 in the percentages of Māori children living in households with equivalised disposable income below 50% of the contemporary median before housing costs (Figure 17), while there was a slight reduction in the proportion of Pacific children living in these households (Figure 18).
Data for disabled children were provided for the first time in the 2019/20 child poverty statistics. As shown in Figure 19, the proportions of disabled children living in low income households before housing costs is well above the 2020/21 Government target.
Figure 17. Māori children in low-income households extrapolated to Government targets Aotearoa 2018/19 extrapolated to 2027/28
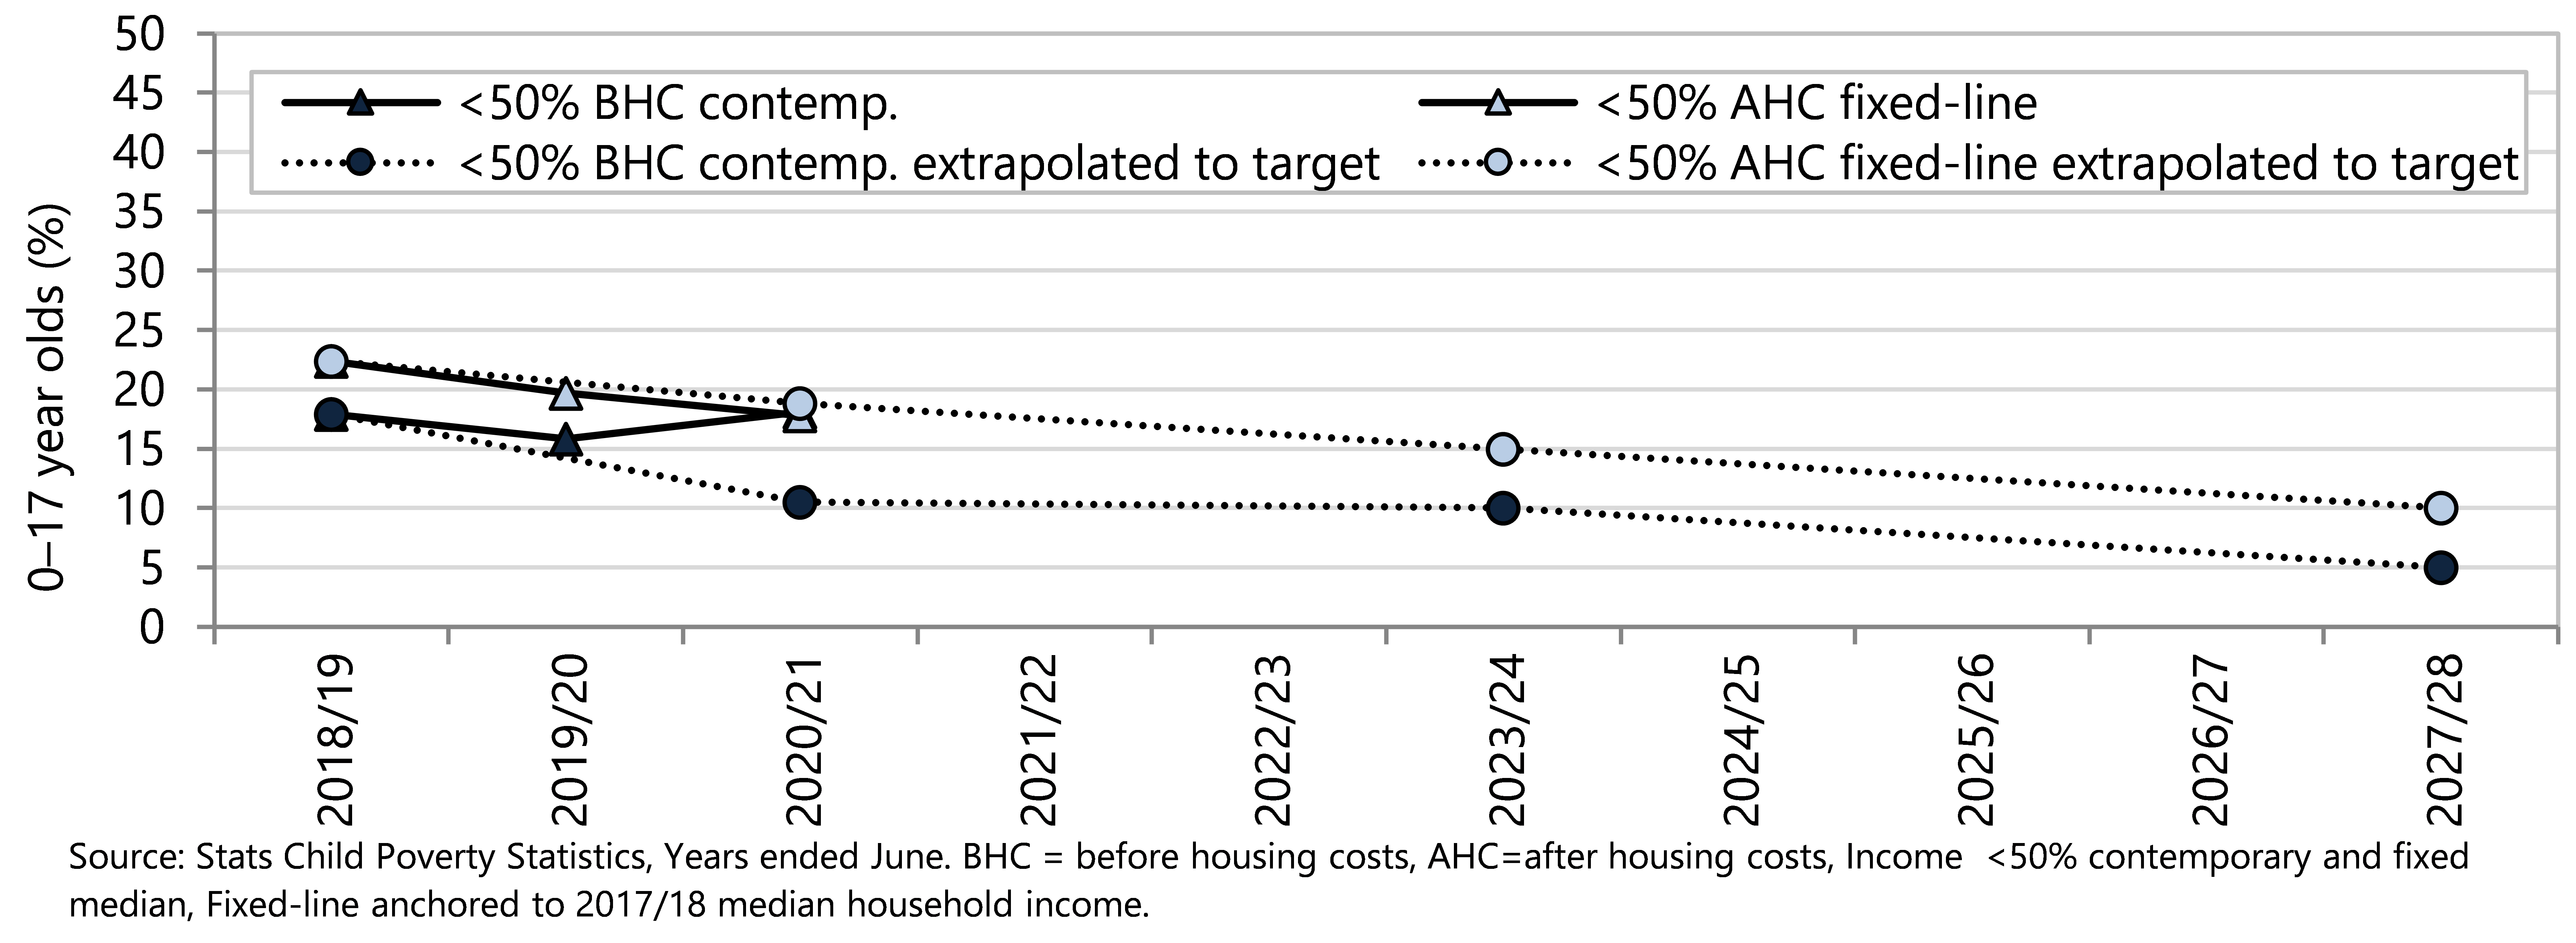
Figure 18. Pacific children in low-income households extrapolated to Government targets Aotearoa 2018/19 extrapolated to 2027/28
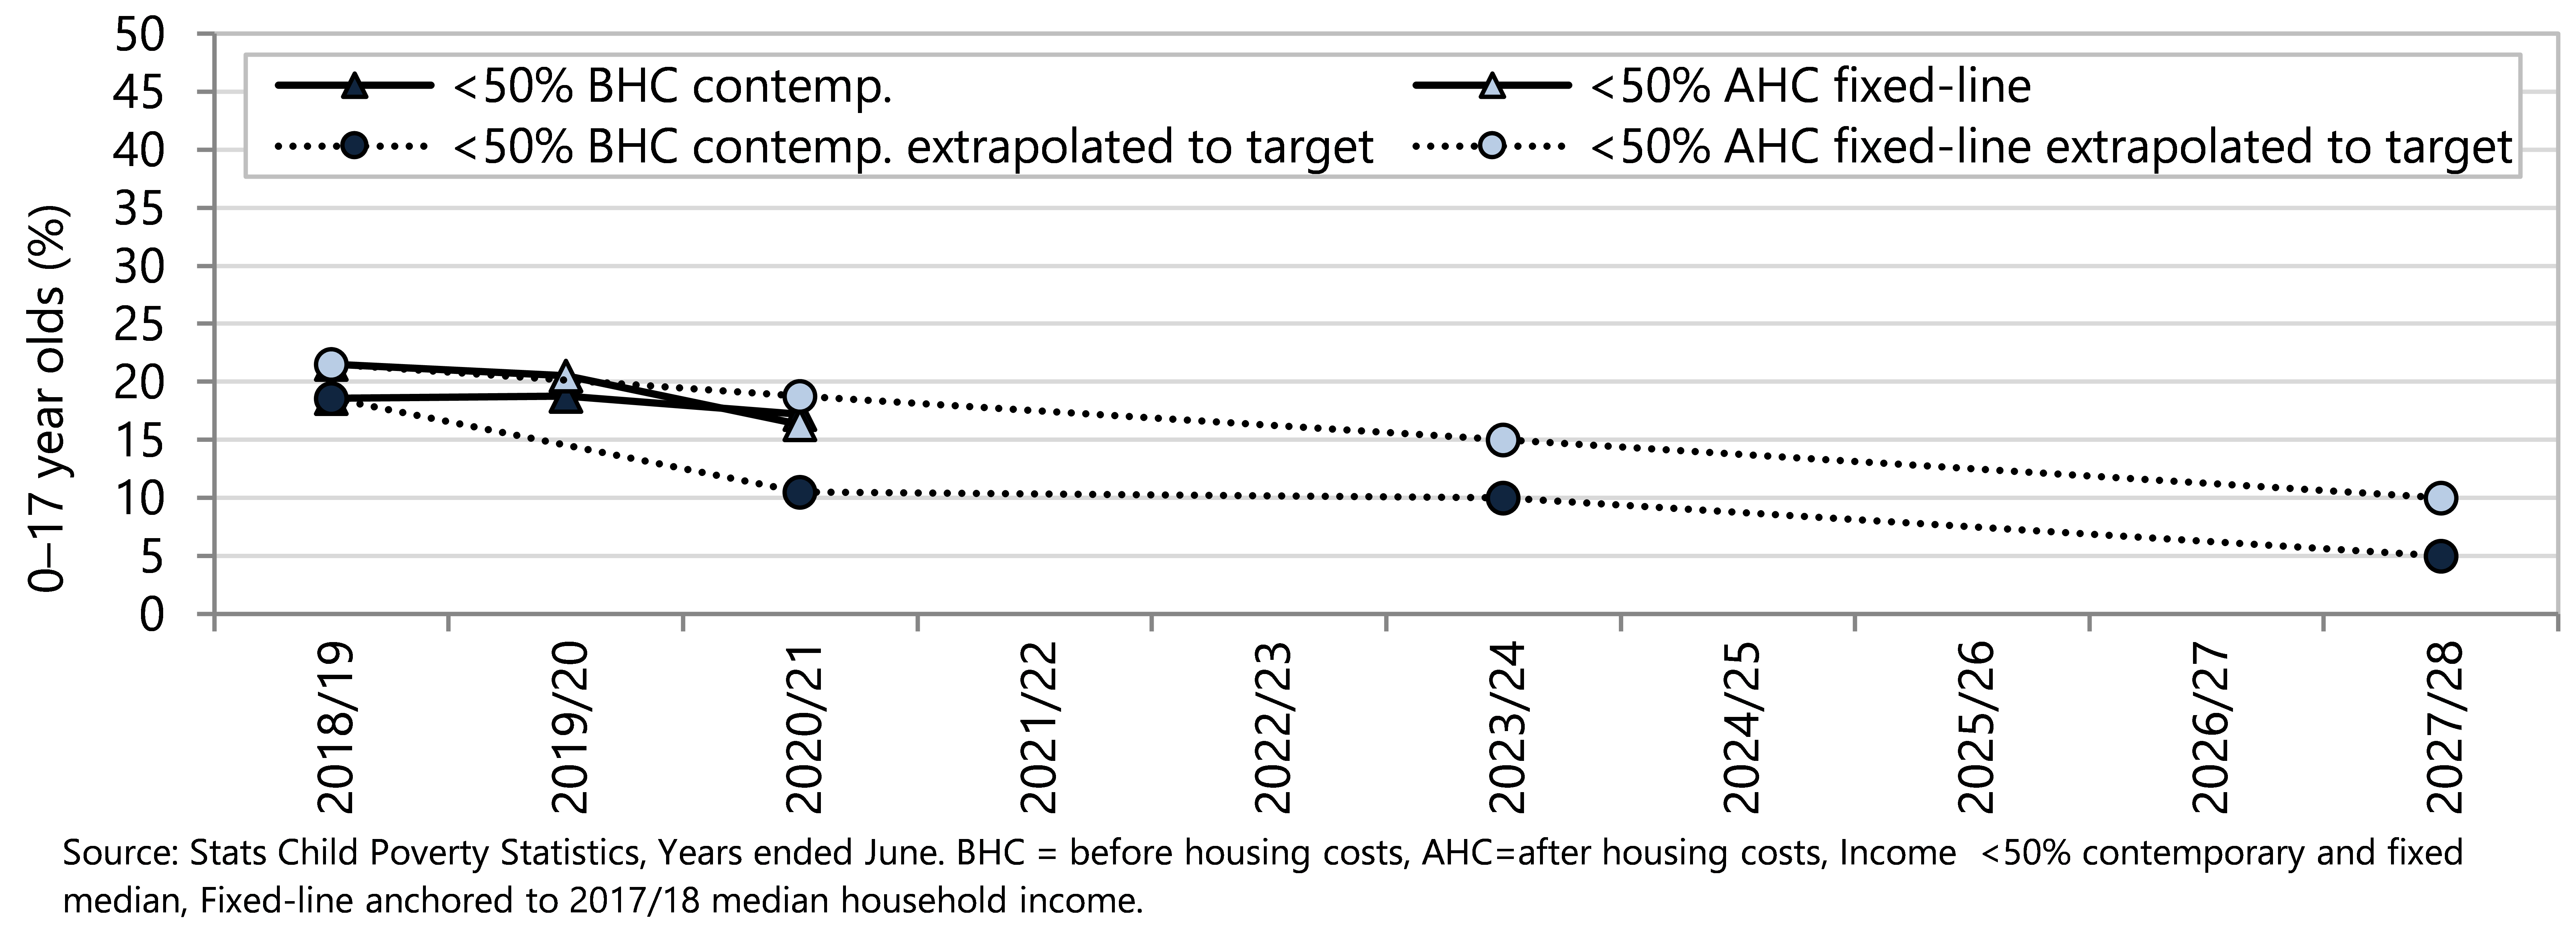
Figure 19. Disabled children in low-income households extrapolated to Government targets 2027/28 Aotearoa
Household levels of material hardship for Māori children, Pacific children, and disabled children are all well above the 2020/21 targets (Figure 20, Figure 21, Figure 22).
Figure 20. Māori children in households experiencing material hardship against government targets Aotearoa 2018/19 extrapolated to 2027/28
Figure 21. Pacific children in households experiencing material hardship, extrapolated to NZ Government targets, Aotearoa 2020/21 extrapolated to 2027/28
Figure 22. Disabled children in households experiencing material hardship, extrapolated to NZ Government target, Aotearoa 2020/21 extrapolated to 2027/28
How is hardship experienced?
In the year ended June 2021, 11% of children live in households experiencing material hardship – households that cannot afford specific items that most people regard as essential.
Households in hardship prioritise their basic needs differently than those not experiencing hardship. Less than one percent of children living in households that are not in material hardship are deprived of meals with a protein component, lack two pairs of shoes or go without fresh fruit and vegetables. Less than ten percent of households that are not in hardship are limited in purchasing adequate meat and clothing. The great majority (95% or more) of households that are not in hardship report they can give presents on special occasions, are able to go on local trips, replace broken appliances and do not need to put up with being cold.
In contrast, while most children in households experiencing hardship are still provided with meals containing protein, and have two pairs of shoes, almost a quarter report they go without fresh fruit and vegetables, and approximately 70% restrict meat in meals. Nearly 40% of households in hardship report putting up with cold, and one in four are unable to give presents on special occasions.
Almost three in four households in hardship report being very limited in their ability to purchase clothes and shoes, 61% cannot place broken appliances, and more than half cannot pay for utilities such as power or rates on time. Households experiencing hardship report being especially vulnerable to extra financial shocks, with 85% unable to pay an unexpected $500 debt, and 68% forgoing home contents insurance. Over half of these households need to borrow from friends and family in order to meet everyday costs. The percentages of children living in households going without basic needs, by material hardship status are shown in Figure 23 .
Figure 23 Children living in households going without basic needs, as measured using Dep-17 index items, by material hardship status, Aotearoa 2020/21.
How low income affects population groups
This section reports on low-income rates for households with children by region and household type, and briefly describes how material hardship is experienced by low-waged families.
These data have been collated from the child poverty statistics19 and wellbeing statistics26 collected by Stats NZ, and the original analyses describing income poverty and hardship by household type and low-waged families contained in the Child Poverty in New Zealand report from the Ministry of Social Development.20
Region
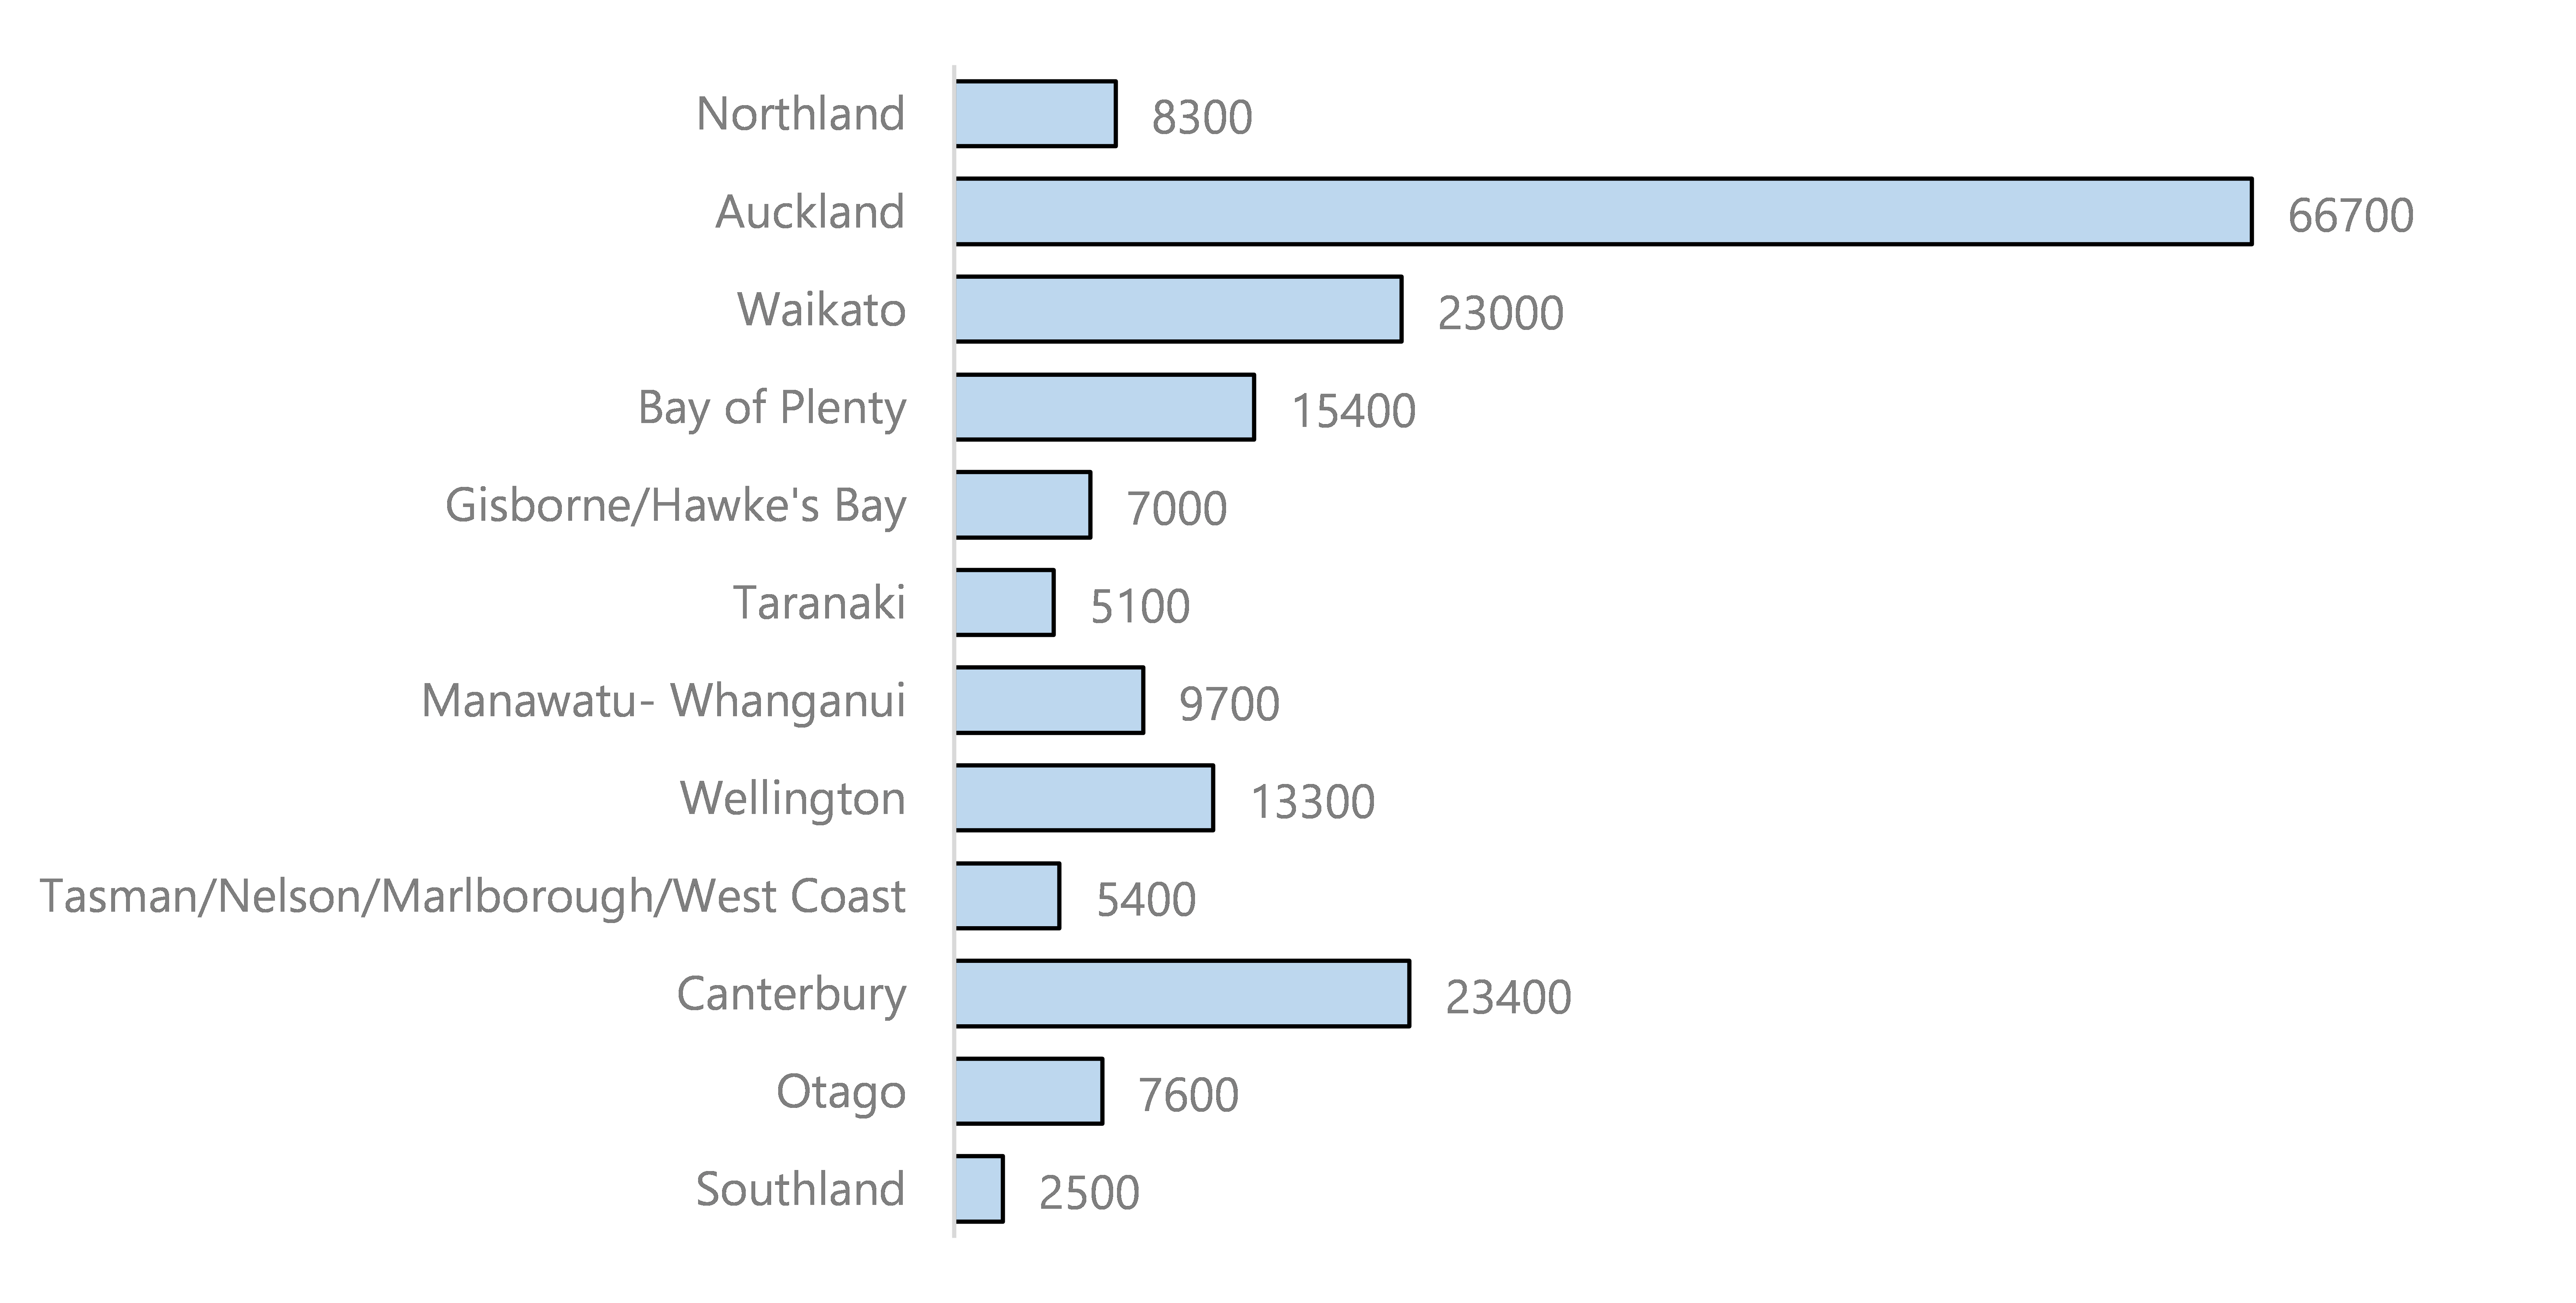
The proportions of children living in households with low income varies by region of Aotearoa, as shown in Figure 24. The regions with the highest proportions of children living in households with less than 50% median equivalised disposable income after housing cost (fixed measure) were Bay of Plenty (18.8%), Waikato (18.2%) and Northland (17.8%), while the region with the lowest rate was Southland (10.9%). However, due to the large population, the region with the largest number of children living in households experiencing income poverty was Auckland where an estimated 66,700 children are living in households with less than 50% median equivalised income (AHC), in 2020/21, (Figure 25).
Figure 24 . Percentage of children in low-income households (income less than 50% of the fixed-line median household income) after housing costs (AHC), by regional council area, Aotearoa 2020/21
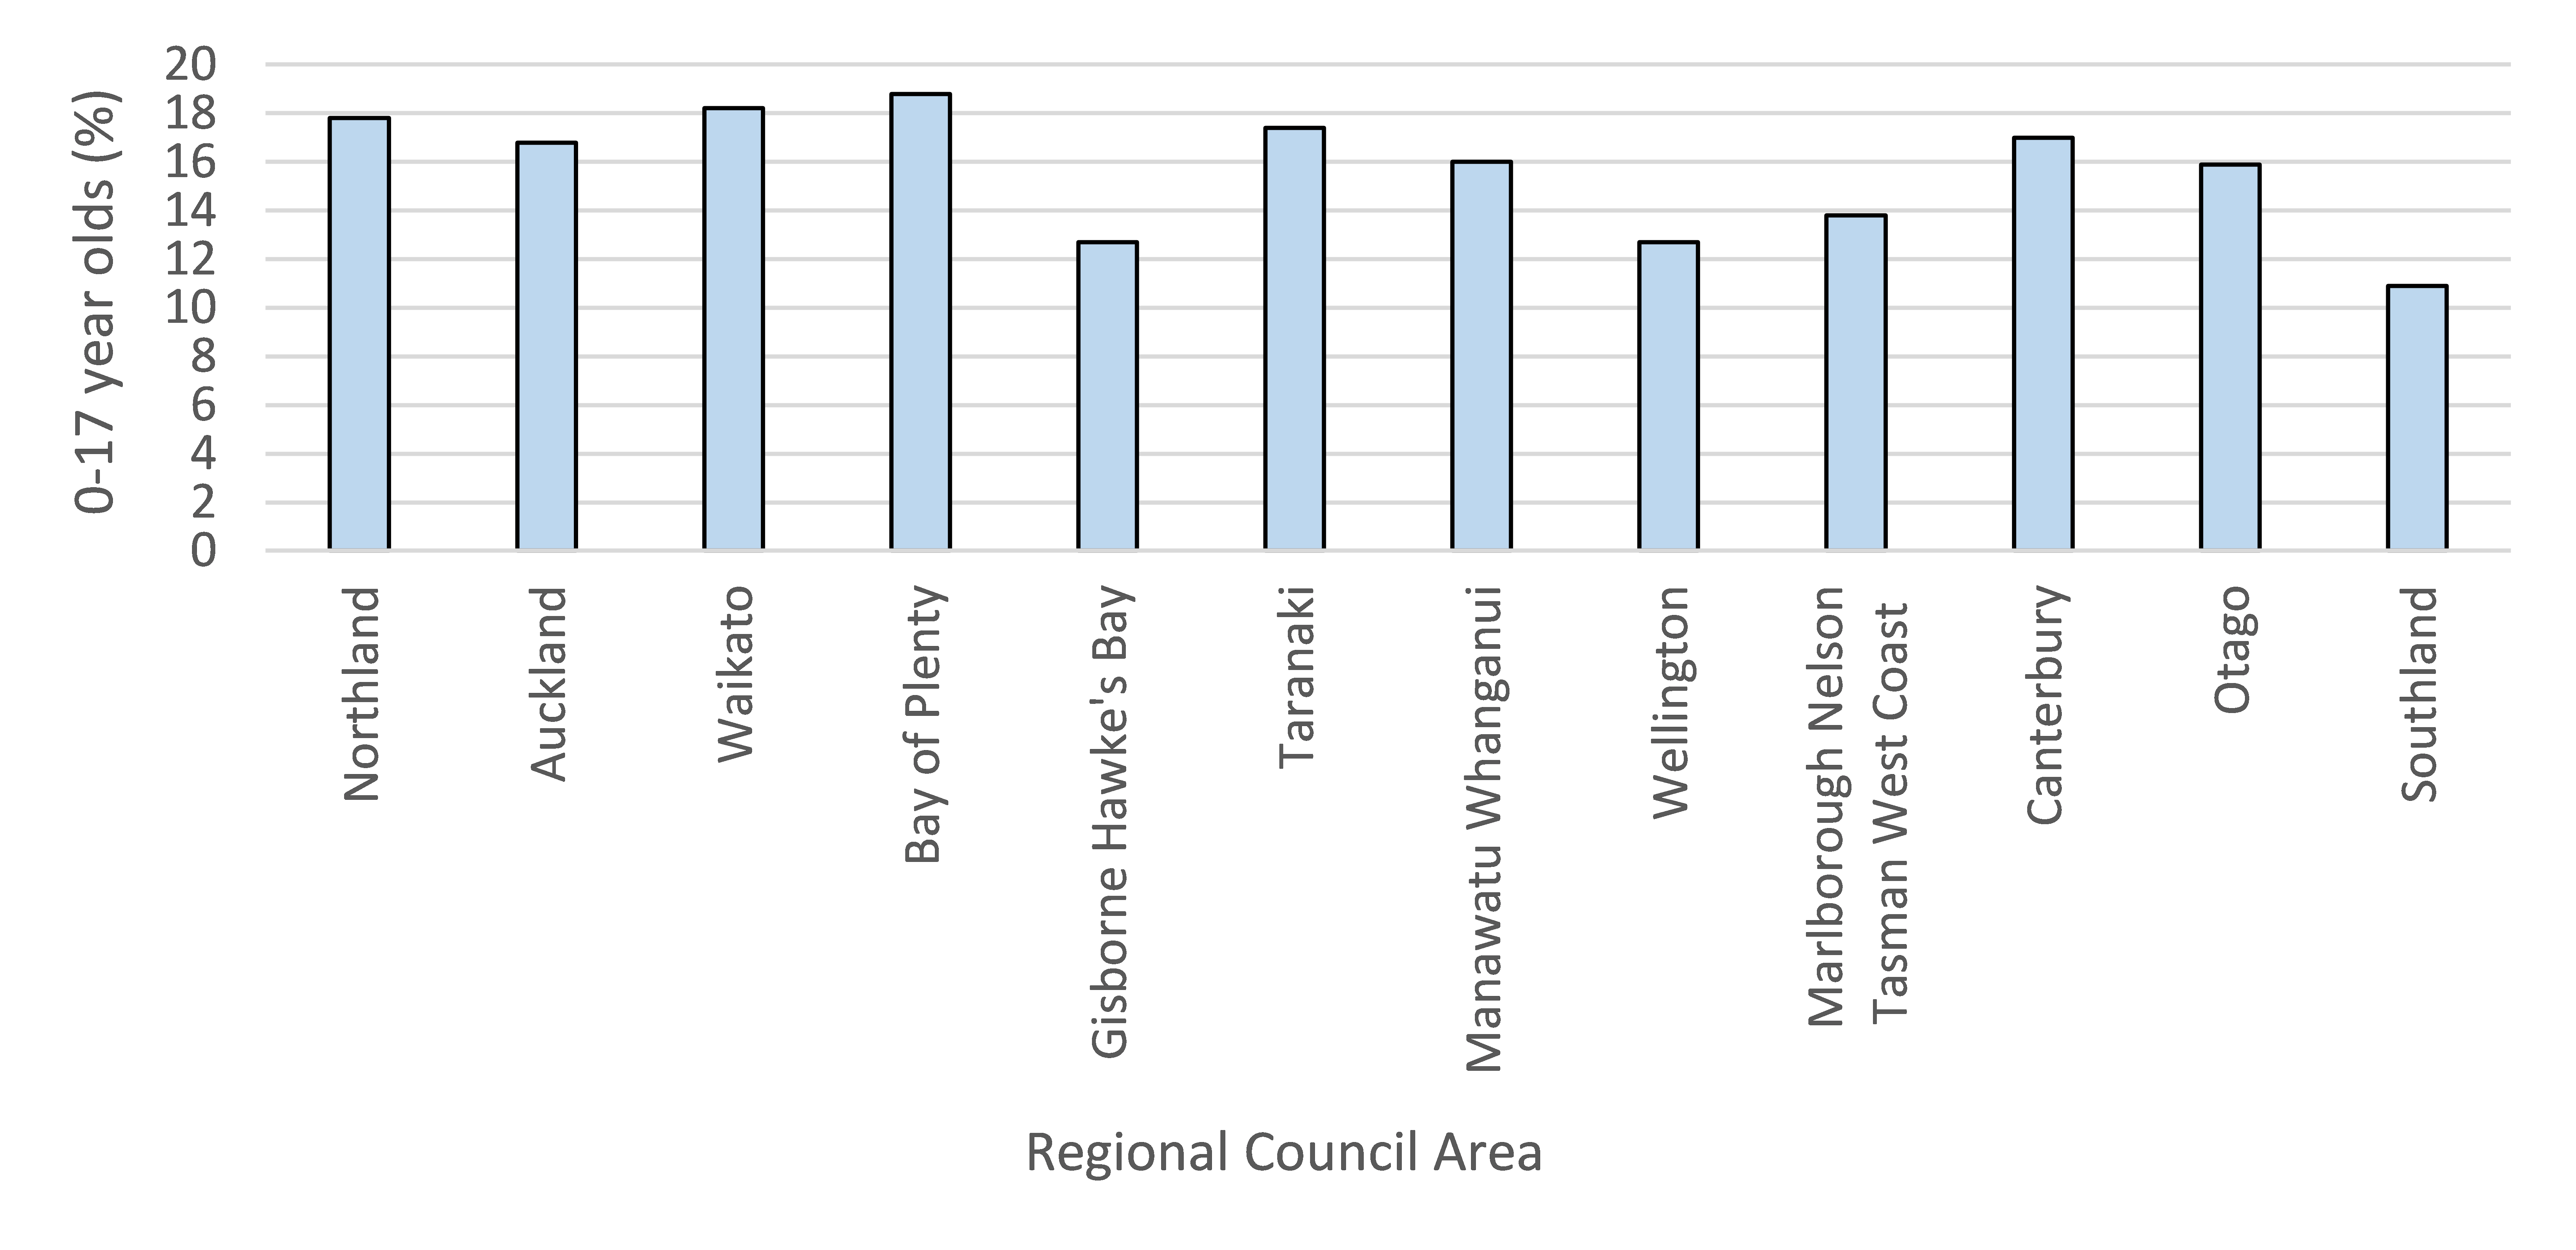
Figure 25 . Number of children in low-income households (income less than 50% of the fixed-line median household income) after housing costs (AHC), by regional council area, Aotearoa 2020/21
Household type
Approximately 15% of children live in single parent households. Single parent households have rates of material hardship that are three to four times higher than those of two parent households. Out of all children in severe material hardship, 41% are from single parent households. 20 Single parents are often solely responsible for all household expenses so are less able to benefit from economies of scale. Two-parent households may also benefit from sharing childcare more flexibly, allowing greater hours of employment. While the requirement for non-custodial parents to provide financial child support is intended to offset the disadvantages of a single parent household, it rarely completely compensates.27
In Aotearoa, well-being measures from the 2021 General Social Survey (collected between April 2021-August 2021) show that sole parents are about three times more likely than parents in two-parent families to report ‘not enough money to meet everyday needs’ and nearly 40% of sole parents report low levels of life satisfaction. Nearly 46% of sole parents report poor overall mental wellbeing; this is a much higher proportion than in the whole population, of which approximately 28% report poor mental wellbeing. 26
Low-waged families
As described in the Child Poverty in New Zealand report from the Ministry of Social Development,20 about the same number of children in households in material hardship come from working households as come from beneficiary households (60000-65000 children in 2021), although beneficiary households have hardship rates that are four to five times higher than rates for children in working households. Approximately 70% of children live in two-parent households, and there is an increasing proportion of two-earners in these, which may partially reflect that a single income for a household with children is no longer viable.
Adequate financial assistance
A Government-appointed review of the welfare system in Aotearoa noted that New Zealand Social Security Act 201828 “is meant to provide a government guarantee of financial and social support to ensure people have an adequate income and standard of living when needed.” 29 (page 5) The review group recommended a social security system that restores trust and treats people with dignity.29
The following section uses data from the Ministry of Social Development to review the proportion of children included in recipients of financial assistance.
Data sources and methods
Indicator
Number of 0–17 year olds included in recipients of financial assistance
Data sources
Numerator: SWIFT database: Number of 0–17 year olds included in recipients of financial assistance
Denominator: NZCYES Estimated Resident Population
Definitions
Main benefits (up to June 2013) include: Domestic Purposes Benefit (DPB)-Care of Sick and Infirm, DPB- Woman Alone, Emergency Benefit, Independent Youth Benefit, Youth Payment, Young Parent Payment, Unemployment Benefit Training and Unemployment Benefit Training Hardship, Unemployment Benefit Student Hardship, Widow's Benefit.
Main benefits (from June 2014 onwards) include: Jobseeker Support, Sole Parent Support, and Supported Living Payment
Other benefits (from June 2014 onwards) include: Emergency Benefit, Youth Payment, Young Parent Payment, and Jobseeker Support Student Hardship.
Main benefits are income-replacing.
Not-income replacing financial assistance includes but is not limited to: Disability allowance, Unsupported Child's Benefit and Orphan's Benefit and Non-Beneficiary Assistance/Non-Benefit Assistance. 30
Non-benefit financial assistance is assistance provided to those who are not beneficiaries, such as accommodation supplements.
Hardship Assistance is the term used to describe emergency grants and one-off payments. The two main types of payment are Special Needs Grants (non-recoverable) and Advance Payments (also known as Recoverable Assistance Payments)
Additional information
All figures are as at June 30. The number of children in recipients of financial assistance as at the end of June provides no information on the number receiving assistance at other times of the year.
The data count children, not clients. An adult client who has more than one child included in their financial assistance will have their financial assistance counted more than once.
Three new benefits were introduced in a welfare reform and implemented from July 2013, which replaced many of the previously existing benefits, and changed the eligibility criteria for financial assistance. The benefits up to data as of June 2013 are not directly comparable to the benefits on and after June 2014. The welfare reform changes have been described at Changes to benefit categories from 15 July 2013 – Ministry of Social Development and Benefit Fact Sheets – Ministry of Social Development.
To be eligible for financial assistance, clients must have insufficient income from all sources to support themselves and any dependents, and meet specific eligibility criteria. Information about current eligibility criteria can be found at Check what you might get – Work and Income.
Children included in financial assistance
In the year ending June 2022, over 300,000 children aged under 18 years were living with a recipient of government-provided financial assistance (Figure 26), which was over one-quarter of all children in the age group. Most of these children (206,235) were included as recipients of income-replacing financial assistance (main benefits) and around one-third (97,899) were recipients of other assistance such as the orphan/unsupported child benefit or non-beneficiary assistance (Figure 26).
Figure 26. Children aged 0–17 years included in recipients of financial assistance, by assistance category, Aotearoa 2022
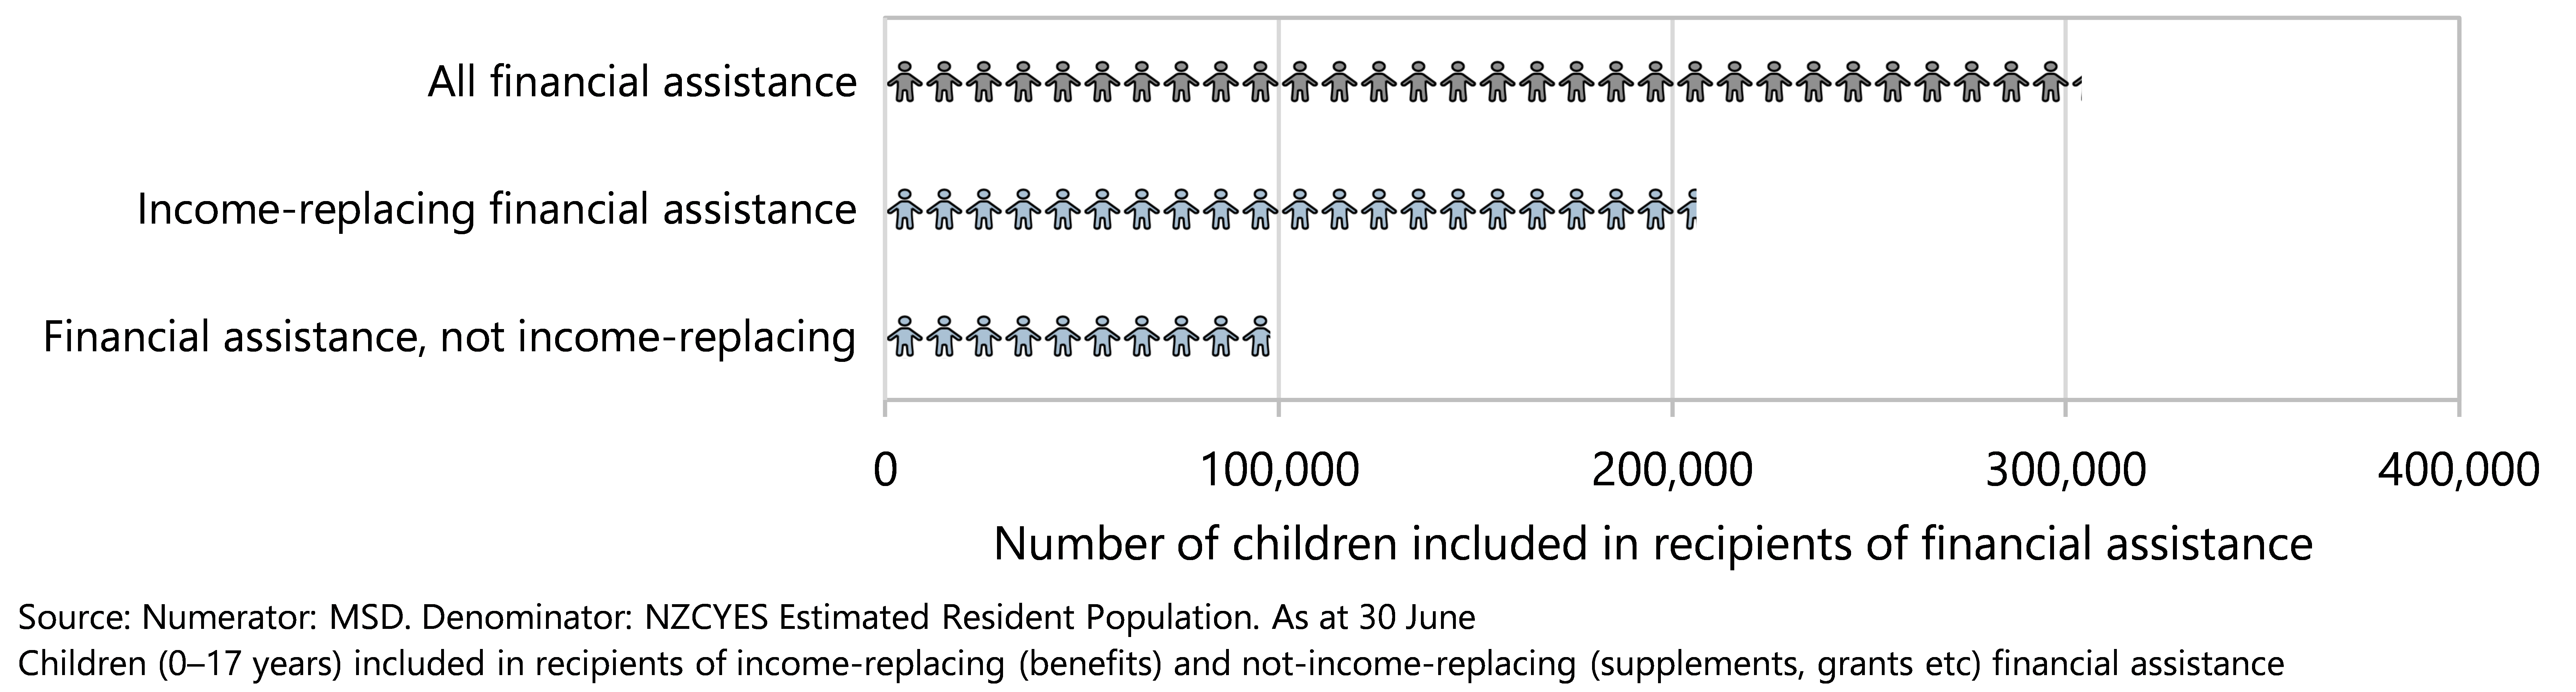
Income-replacing financial assistance is available to help people to support themselves and their dependants while not in paid employment. This includes people seeking to find or retain paid employment; and those for whom work is not currently appropriate because of sickness, injury, disability, or caring responsibilities.28 Figure 27 shows that the overall proportion of children included in sole parent or domestic purposes benefits decreased overall from 2000–2018 and increased from 2019 to 2022. The proportion of children as recipients of job-seeker allowance has fluctuated around 3%–4% of the population from year to year, and children as recipients of supported living payments has been fairly stable at around 1.6% of the population since 2014.
Figure 27. Children aged 0–17 years included in recipients of income-replacing financial assistance, by selected type of assistance, Aotearoa 2000–2022
Figure 28 presents the children included in financial assistance as a proportion of all children in that year of age as at 30 June 2022. The percentage of children who were included in recipients of financial assistance reduced with increasing age, from 28% of children aged two years to 17% of children aged 17 years. The percentage of children living with a recipient of Sole Parent Support was around 17% of 1–4 year olds. The shift away from Sole Parent Support and increased proportion of children in households receiving Jobseeker support in the upper age groups (Figure 28) can be attributed to the eligibility criteria that apply when the youngest child turns 14 years old. The proportion of children living with a recipient of non-beneficiary assistance increased with increasing age up to 13 years before decreasing for older children.
Figure 28. Children aged 0–17 years included in recipients of financial assistance, by age and by assistance type, Aotearoa as at 30 June 2022
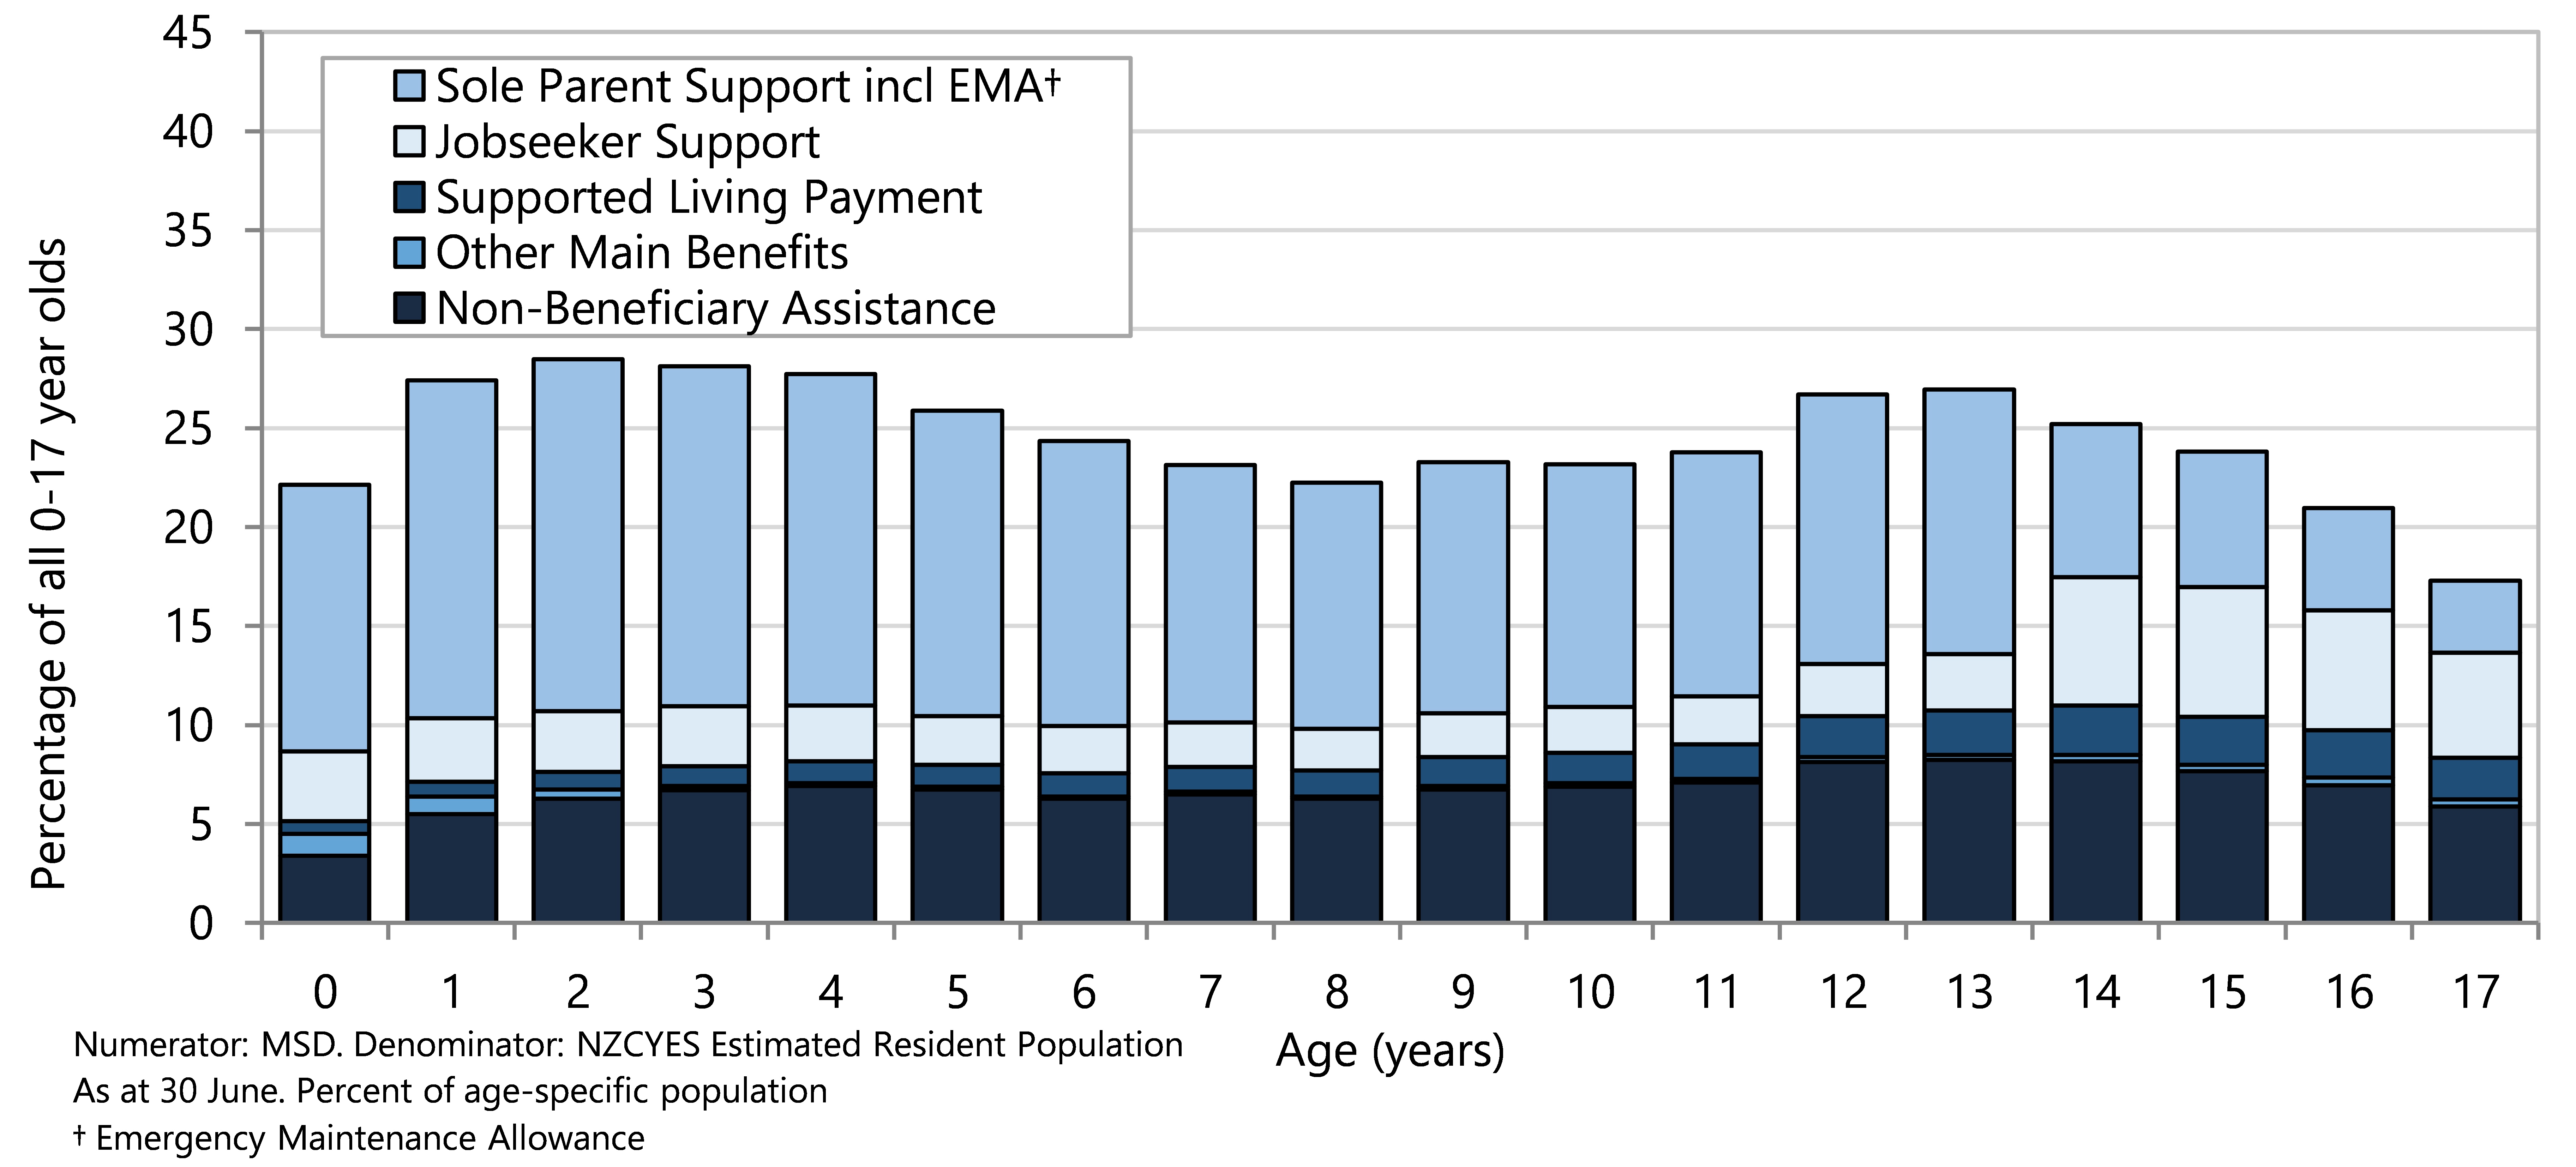
At 30 June 2022 there were 78,039 children aged under 18 years included in recipients of non-beneficiary financial assistance. Non-beneficiary financial assistance is targeted to provide tax credits or supplementary allowances to low-income earners. Children included on this type of assistance lived in households not eligible for income-tested main benefits because one or more adults in the household were employed. The household income was below the income threshold for supplementary assistance such as Accommodation Supplement, Disability Allowance or Child Care Subsidy. In the year ending June 2000, around 4% of all children were included in Non-Beneficiary financial assistance, this percentage increased steeply from 2004 to 2008 to around 7% of all children and has remained stable at that level from 2008 to 2022.
The Unsupported Child’s Benefit or the Orphan’s Benefit is assistance paid to adults who are caring for someone else’s children, when parents cannot care for a child due to family breakdown or serious long-term health conditions, or when parents have died or cannot be found. These types of non-income-replacing financial assistance are not income-tested; a child could be included in both income-replacing assistance or supported by a caregiver’s working income and also receive an Orphan’s Benefit/ Unsupported Child’s Benefit.31,32 Although these benefits make up a very small proportion of all financial assistance provided by the Government, there has been an increase in the number and percentage of 0–17 year olds included in recipients of orphan’s benefit and unsupported child’s benefit from 7,419 (0.7% of children in this age group) in 2000 to 19,860 (1.7% of children in this age group) in 2022.
Good work
Having one or both parents in paid work reduces the likelihood of a child living in poverty or material hardship.20 ‘Good’ work means that there is a fair balance of rights and responsibilities with a safe working environment and adequate pay.33,34 Good work can increase worker participation, community vibrancy and social cohesion, as well as overall economic performance.35 Low quality opportunities for work can push people out of the labour market or push people into work that does not fully utilise their skills and experience, leading to reduced wellbeing and productivity.34
Both unemployment and underutilisation labour statistics are important to getting a picture of the economy and workforce in Aotearoa.36
The following section is a review of unemployment overall from 1986–2021, unemployment by ethnicity from 2008–2022, and underutilisation from 2004–2022, using data from the Stats NZ Household Labour Force Survey.
Data sources and methods
Indicators
Persons unemployed and unemployment rate
Persons underutilised and underutilisation rate
Data sources
Stats NZ Household Labour Force Survey
Unemployment rate
Numerator(s): The number of people unemployed.
Denominator: The total number of people in the labour force.
Underutilisation rate
Numerator(s): The number of people underutilised (that is: the sum of the number of people unemployed, under‑employed, and in the potential labour force).
Denominator: The total number of people in the extended labour force (that is: the sum of the number of people in the labour force and the number of people in the potential labour force).
Definitions
Unemployed: all people in the working-age population who, during the reference week, were without a paid job, available for work, and had either actively sought work in the past four weeks or had a new job to start within the next four weeks.
Actively seeking work: To be actively seeking work, a person must have indicated that they used at least one job search method other than looking at job advertisements.
Working age population: usually resident, non-institutionalised, civilian population of New Zealand aged 15 years and over.
Potential labour force: people who are not actively seeking work but are available and wanting a job, and people who are actively seeking but not currently available for work, but will be available in the next four weeks.
Underemployment: people who are in part-time employment who would like to, and are available to, work more hours.
Underutilised: sum of those unemployed, underemployed, and in the potential labour force.
Extended labour force: people in the labour force, or in the potential labour force.
Additional information
When the seasonal adjustment program is run each quarter, all previously published figures are subject to revision. Seasonal adjustment makes data for adjacent quarters more comparable by smoothing out the effects of any regular seasonal events. This makes the underlying movements in time series more visible. Each quarter, the seasonal adjustment process is applied to the latest and all previous quarters. This means that seasonally adjusted estimates for previously published quarters may change slightly.
For information on the Household Labour Force Survey, see Stats NZ’s DataInfo+ for an overview.
The unemployment rate provides a picture of the economy overall, reflecting the conditions of the labour market and the number of people seeking work.37 A rise in the unemployment rate causes stress on the strength and social cohesion of communities and adversely impacts outcomes for all children and young people, not only those directly affected by job loss within their own household.38
In the June quarter of 2022, 94,000 New Zealanders were officially unemployed, or 3.5% of all people in the labour force. The seasonally adjusted unemployment rate has remained under 6% since September 2013. There was a relatively short-lived increase from 4.2% in June 2020 to 5.4% in March 2021 with subsequent decline. The seasonally adjusted unemployment rates of 3.4% in December 2021 and March 2022 are the lowest rates since 1986; the highest unemployment rate was 11.2% in the September quarter of 1991 (Figure 29).
Figure 29 . Unemployment numbers and rates (seasonally adjusted) by quarter, Aotearoa 1986–2022
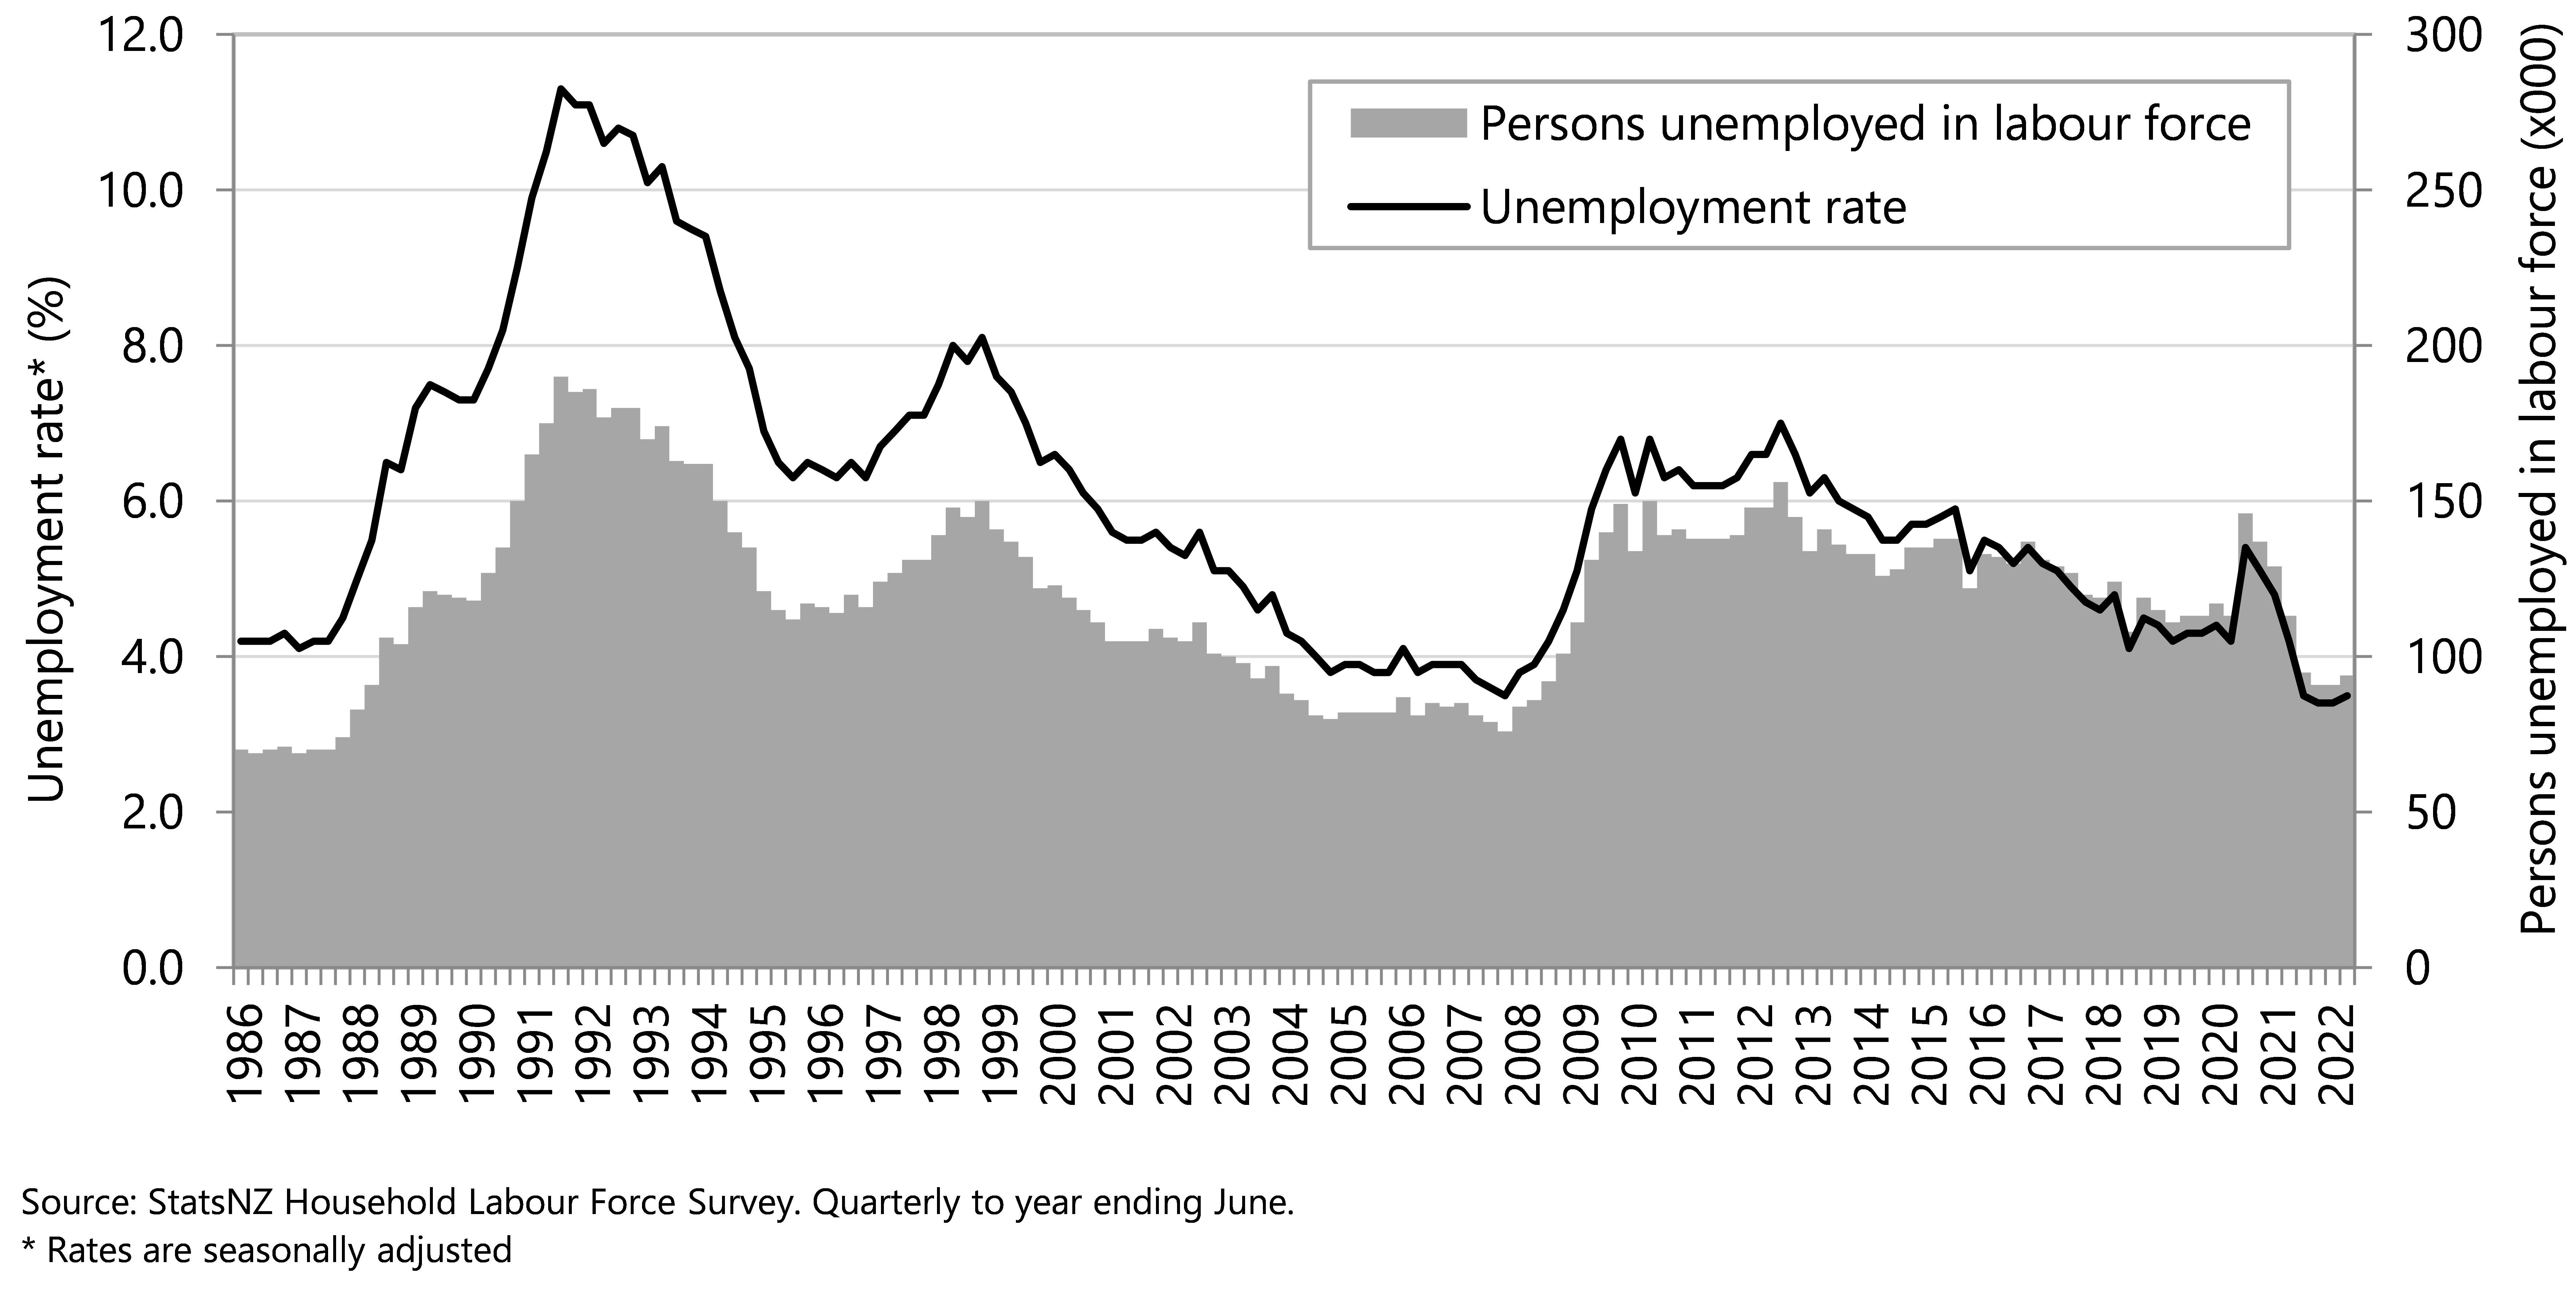
Unemployment rates differ by age and young people aged 15–19 years consistently have the highest rates. In the year to June 2022, the unemployment rate for young people aged 15–19 years was 14.7% compared to around 2.0% for adults aged 35 years and over (Figure 30). While the unemployment rate is high for the youngest working-age population, only a small proportion of this age group are in the labour force as most teenagers are engaged in education or training.
Figure 30 . Unemployment rates, by selected age groups, Aotearoa 1996/87–2021/22
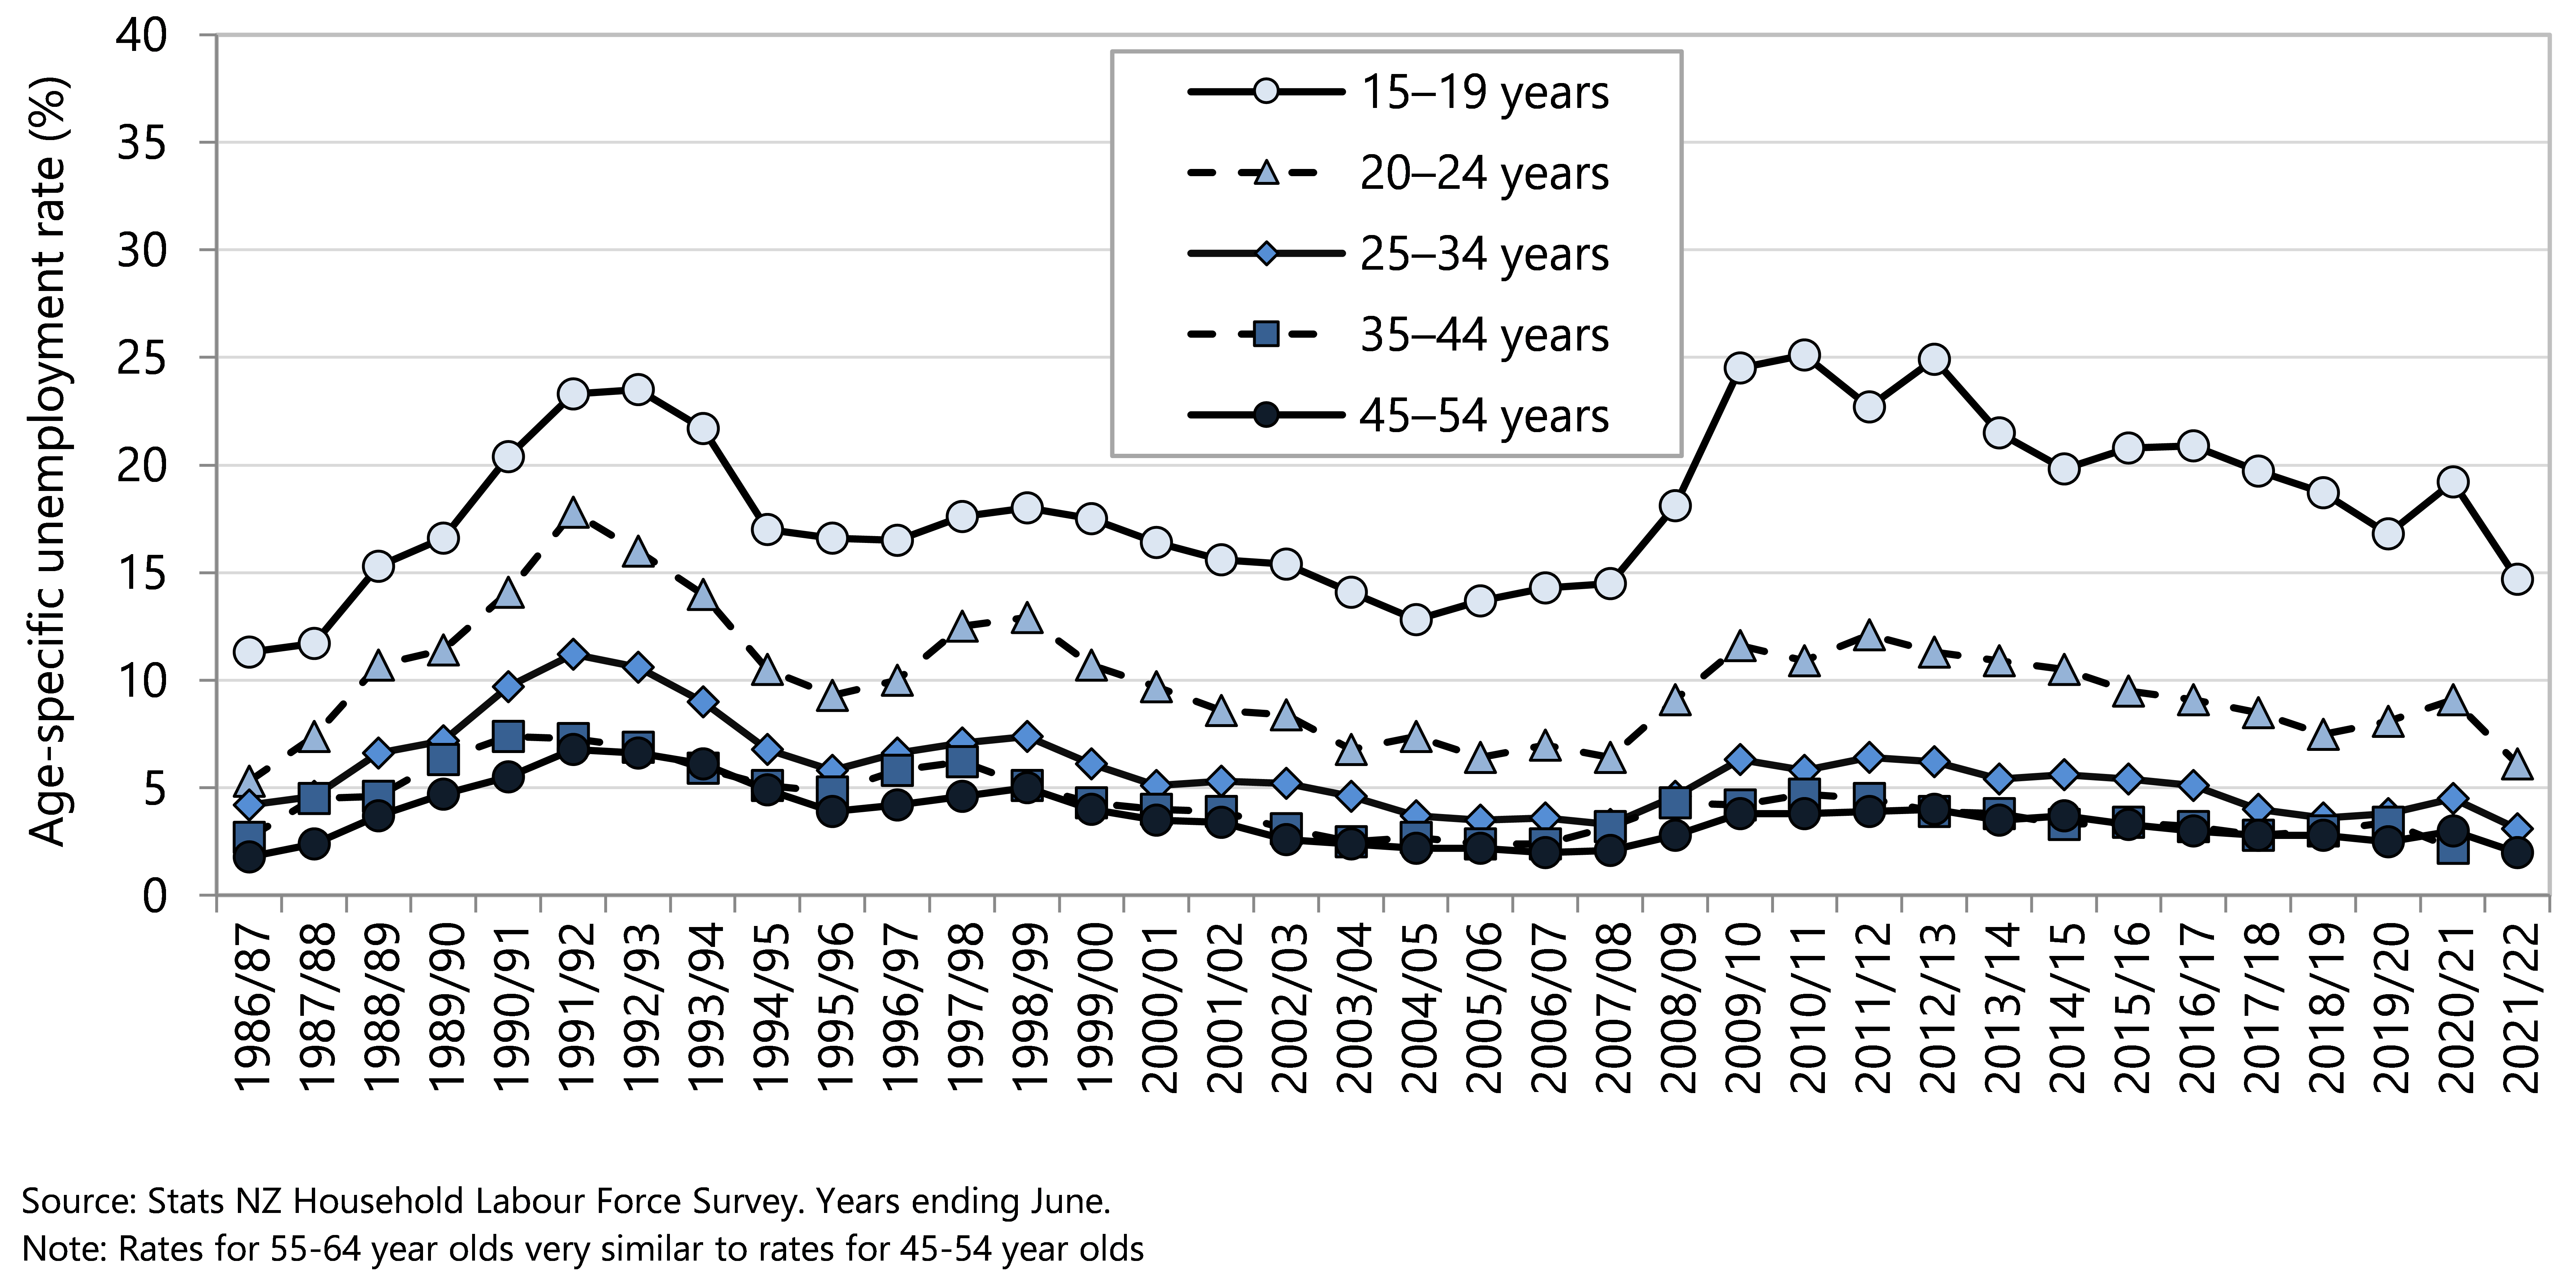
Unemployment rates by ethnicity show consistently higher unemployment rates for Māori and Pacific people. Despite some narrowing of the gap between ethnic groups has been observed from around 2013, significant inequity persists. The pandemic and response was associated with marked increases in unemployment rates for Māori and Pacific peoples in 2020 and 2021. In June 2022, the unemployment rate for Māori was 5.5%, Pacific people was 5.6% compared with 2.9% for the European ethnic group and 2.5% for the Asian ethnic group (Figure 31).
Figure 31 . Unemployment rates by quarter, by ethnicity, Aotearoa 2008–2022
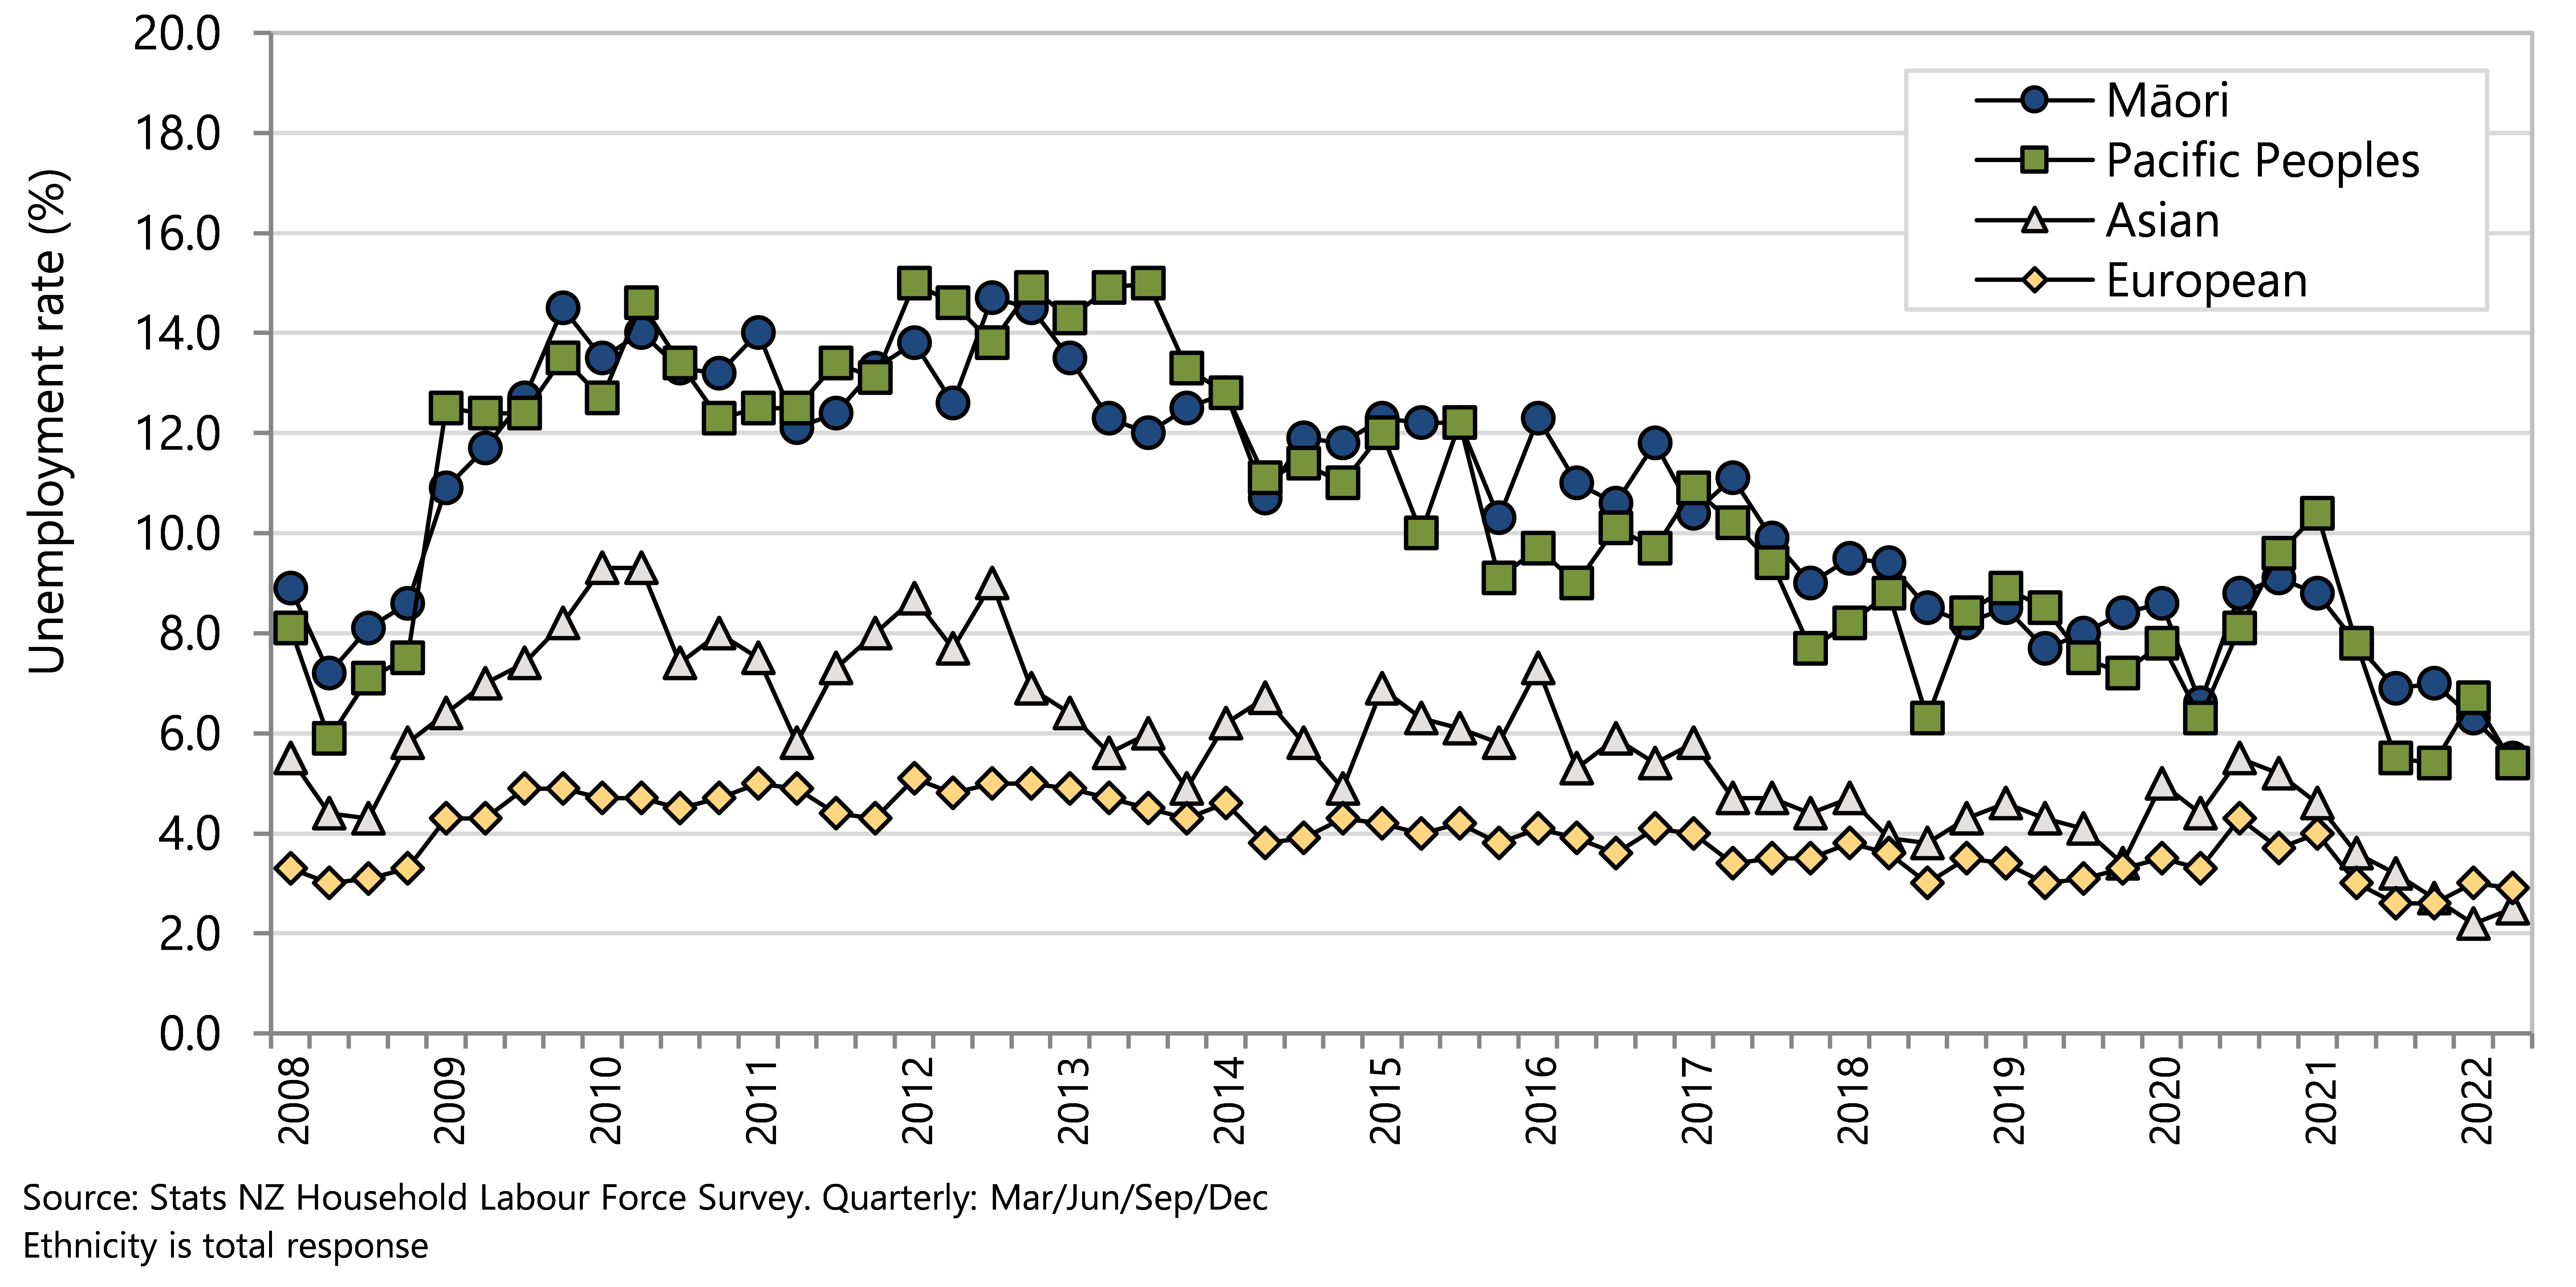
The underutilisation rate provides an indication of unmet need for good work and underperformance in making it easy and accessible for people to find and secure good work.39 ,40 An increase in the rate of underutilisation also has implications for a country’s overall productivity and growth;41 The underutilisation rate includes persons underemployed (in part-time employment but would like to work more hours and are available to do so), and in the potential labour force (not actively seeking work but are available and wanting a job, or actively seeking work and, although not currently available, will be available for work in the next four weeks), as well as those people officially unemployed.
In June 2022, 276,000 New Zealanders were underemployed (9.2%) (Figure 32). The underutilisation rate peaked in September 2012 at 15.6% and fell slowly to 10.1% in December 2019. There was an upswing to 13.2% in September 2020 during the early stage of COVID-19 pandemic response. By June 2021 underutilisation rates had fallen to below pre-pandemic levels (9.2%) (Figure 32).
Figure 32 . Underutilisation numbers and rates (seasonally adjusted) by quarter, Aotearoa 1986–2022
The underutilisation rate for women has consistently been higher than that for men (Figure 33). The increase in the underutilisation rates during early 2020 was likely driven by the coronavirus pandemic, and it was more pronounced for women than men (Figure 33).
Figure 33. Underutilisation by quarter, by gender, Aotearoa 2004–2022
Figure 34 shows the trends in the three components of underutilisation by gender. The numbers of men and women who are unemployed have been similar over time, and there have consistently been more women than men in the potential labour force, and considerably more women than men underemployed. The numbers of men and women underemployed have both have risen overall since 2007, but the number of women underemployed has risen much more steeply and this was particularly marked in the first two years of the COVID-19 pandemic response.
Analysis of reasons for underemployment indicated that women were much more likely than men to cite difficulties in finding suitable childcare (4.1% vs. 1.1%) and other family responsibilities (9.3% vs. 2.8%). The most commonly cited reason for unemployment, by both men and women, was lack of available work.42
Figure 34. Underutilisation by quarter, by extended labour force status and by gender, Aotearoa 2007–2022
A place to call home
‘A place to call home’ can help to provide children with a sense of belonging and connection to community.4 ,11,43-45 Healthy homes keep occupants warm, dry, and breathing good indoor air quality, and also protect them from communicable disease transmission and physical injury, while promoting mental and emotional wellbeing.45,46
Affordable homes
When a household spends a high proportion of their disposable income on housing costs, it often results in significant financial stress and fewer resources available to purchase other basic needs such as food, clothing, transport, medical care and education.13 Other adverse consequences of unaffordable housing are overcrowding, inadequate heating or living in unsuitable locations.
Housing is classified as unaffordable when households spend more than 30% of disposable income on housing costs, which includes rates, dwelling insurance, mortgage and rent. To measure how many children are affected by unaffordable housing, the proportions of households who spend more than 30%, 40% or 50% of disposable income on housing costs are reported.
For the year ending 30 June 2021, (as reported by the Department of the Prime Minister and Cabinet (DPMC) in the Child Poverty Related Indicators Report)47, 34% of all households with children aged 0-17 years spent more than 30% of their disposable income on housing; this proportion was not significantly different for Māori households (29%) or Pacific households, (27%), although a higher proportion of Asian children reside in households with high housing costs. Disability status did not significantly affect the proportion of households with high housing costs; 33% of households with disabled children and 32% of households with children that included at least one disabled person spent more than 30% of their income on housing.47
Housing unaffordability disproportionately affects lower income households. Approximately 60% of households with children in quintile 1 (lowest 20% of income distribution) spend more than 30% of their disposable income on housing, compared to only 11% of quintile 5 households, who are in the top 20% of income distribution. More than one in three quintile 1 households with children spend more than 50% of their disposable income on housing costs.
The average cost of housing for households with children has increased since the late 1980s. In 1988, the average cost of housing for households with children was 15% of the average income; in 2021 this is now 22%. The increase is even more marked for households in the lowest income quintile (income quintile 1), with housing costs increasing from 23% to 40% of the average income over this time, although it should be noted that this proportion in quintile 1 is reduced by those who live in public housing with their rent capped to 25% of income. Quintile 1 households with children who pay private rent and receive the Accommodation supplement payment spend close to 50% of their income on housing.20
Single-parent households experience much higher rates of unaffordable housing – more than half of these households spend more than 30% of income on housing, and over one in five single-parent households have housing costs of more than 50% of their disposable income. In comparison, households made up of a couple with children report lower proportions of housing unaffordability.47
Similarly, households with children who are renting experience more housing unaffordability than households who own or partially own their home. More than 40% of households with children who are renting spend more than 30% of their income on housing costs.47
The impact of the Covid pandemic in 2020 has not had an obvious effect on housing costs. The average cost of housing increased approximately 2.5% from 2019/20 to 2020/21, and average weekly rent increased by 5.4%, however this occurred alongside a 5.5% increase in median household disposable income over the same time-period. 47 For the children of Aotearoa New Zealand, the cost of housing still disproportionately affects those in households with low-incomes, single-parents and for those who do not own their own home.47
Data sources and methods
Indicator
Households experiencing a high housing cost outgoings-to-income (OTI) ratio
Definitions
High housing costs: when a household spends more than 30% of their income on owner-occupied or rental accommodation, they meet the benchmark for having a high “outgoings-to-income” ratio or OTI.13
Owned: people who owned their home, partly owned their home, or held it in a family trust.
Rental: people who did not own their home, did not have it in a family trust, and were making rent payments to a private person, trust, or business or were making rent payments to Housing New Zealand Corporation, local authority, or city council, or other state-owned corporation or state-owned enterprise, or government department or ministry.
Housing costs include all mortgage outgoings (principal and interest) together with rent and rates and dwelling insurance for all household members. Repairs and maintenance are not included. Any housing-related cash assistance from the government is included in household income.13
Income quintiles All household incomes are ranked and then divided into five groups with equal numbers of households. The first income quintile represents the 20% of households with the lowest equivalised income; the fifth income decile comprises the 20% of households with the highest incomes. Income deciles are similar but there are ten groups with equal numbers of households.
Data source
New Zealand Household Economic Survey (NZHES) via the Department of the Prime Minister and Cabinet (DPMC)47 and Perry.20
Income data was based on administrative data from the IDI, rather than respondents being required to answer this question themselves. Further information on the HES methodological changes can be found on the Stats NZ website.48
Additional information
‘For the housing affordability indicator, the outgoing to income ratios are not mutually exclusive. Households that spend more than 40% of their household disposable income on housing costs will also be included in the more than 30% category. The data for quintile 1 (lowest income quintile) includes loss from investments or self-employed income, or no income received. Many of these households do not have the high deprivation scores expected of households with low income, which suggests that either the reported income value is incorrect, these households have access to other economic resources, or that the instance of low or negative income is temporary. This has an impact on the data reported for quintile 1.’47
Variations in housing costs do not necessarily correspond to similar variations in housing quality. This is because many older individuals live in good accommodation with relatively low housing costs, for example, those living in mortgage-free homes, whereas many younger people have a similar standard of accommodation but relatively high accommodation costs.13
Healthy homes
It is important that children grow up in homes with good air quality that are free from mould and have amenities most people consider to be essential minimums for modern living, such as cooking facilities, showers or baths, and electricity supplies.
Living in a house that is sufficiently warm and dry reduces the likelihood of hospitalisation due to illnesses such as asthma, pneumonia, and bronchiolitis.49 Children are especially vulnerable to adverse outcomes from poor housing; they spend more time indoors and have immature immune systems with greater susceptibility to indoor pollution50 and respiratory illnesses. For families with income poverty, housing quality is often compromised to find affordable accommodation in a location near whanau, and to access employment and education opportunities.
In 2020/21, 6% of children aged 0–17 years lived in households with major problems with dampness or mould. While this proportion has decreased since 2017/18 (from 9% of households), poor quality housing disproportionately affects children in low income households (10% of children in quintile 1 households), children of Māori (10%) and Pacific (12%) ethnicity.47
Only 4% of households consisting of a couple with children report a major problem with damp or mould, while 11% of single-parent households live in poor quality housing.47 One third of sole-parent households report that their home is often or always colder than they would like, which is a greater proportion than is reported by two-parent families (20%), and by the overall population (20.6%).
Ten percent of households with a child with a disability or households with a disabled person live in poor quality housing. Major problems with dampness and mould are reported by 11% of households who do not live in their own dwelling (e.g. renting), while poor quality housing is less common (2%) in owner-occupied homes.47
Access to basic amenities
Basic amenities are those considered essential for an acceptable standard of living; safe tap water, cooking and washing up facilities, a bath or shower, a toilet, a refrigerator and a supply of electricity. In the 2018 census there were 77,976 children without access to one or more of these seven household amenities.
Space to thrive
In each census year since 1991, consistently 16% or 17% of children in Aotearoa lived in crowded households, including around 5% of children living in severely crowded households.
In the 2018 census,16% of children aged under 15 years were reported to be living in crowded households, with 5% living in severely crowded households with two or more bedrooms needed.
Higher rates of household crowding were reported in Māori children aged under-15 years: 23.5% were living in crowded households, and 9% were living in severely crowded households. The highest levels of household crowding in this age group were experienced by Pacific children, over 40% of whom lived in crowded households. Further details are available in the Child Poverty Monitor Technical Report 2021.
Data sources and methods
Indicators
0–17 year olds living in dwellings that are always and sometimes damp
0–17 year olds living in dwellings that always and sometimes have mould larger than A4 size
0–17 year olds living in dwellings that have less than seven basic amenities available
0–14 year olds living in crowded households
Definitions
A dwelling is any building or structure (or its parts) that is used, or intended to be used, for human habitation (temporarily or permanently). Dwellings include: houses, motels, hotels, prisons, motor homes, huts, and tents. More than one dwelling can be in a building (such as in the case of apartments in apartment buildings).
A household can be one person who lives alone, or two or more people who live together and share facilities (such as for cooking) in a private dwelling.51
A child is a member of a household if they live there for four or more nights per week, or spend equal time in this and another household and were present during the survey week.
Access to basic amenities indicates what basic amenities (e.g. cooking facilities, shower or bath, and electricity) are available inside an occupied private dwelling. The amenities need to be in working order to be counted.
A household is defined as crowded if one or more bedrooms are needed to meet the Canadian National Occupancy Standard (CNOS). Within this group a household is defined as severely crowded if two or more bedrooms are needed to meet CNOS. A household is defined as not crowded if no extra bedrooms are required to meet the Canadian National Occupancy Standard
Data sources
NZHES (2020/21) via DPMC.47
Stats NZ Census 2018 (Census 2018).
Additional information
For more information about and data quality details pertaining to individual housing and amenities variables, please refer to the Data quality ratings for 2018 Census variables.52
The Canadian National Occupancy Standard states: There should be no more than two people per bedroom; parents or couples share a room; children aged under five years, either of same or opposite sex, may reasonably share a bedroom; children aged under 18 years of the same sex may reasonably share a bedroom; a child aged five to 17 years should not share a bedroom with one aged under five of the opposite sex; single adults aged 18 years and over and any unpaired children require a separate bedroom.53
Crowding data excludes households where bedroom data was imputed. Data for these people have been included in the not stated category. (Around 2 percent of crowded households had their bedroom count imputed).
Around 400,000 people could not be placed in households and are not included in the crowding calculation.
Indicator: Dwelling dampness
A flat classification with the following categories:
01 Always damp
02 Sometimes damp
03 Not damp
99 Not elsewhere included
Indicator: Dwelling mould
A flat classification with the following categories:
01 Mould over A4 size – always
02 Mould over A4 size – sometimes
03 No mould/mould smaller than A4 size
99 Not elsewhere included
Indicator: Access to basic amenities
A flat classification with the following categories:
0 None of these
1 Cooking facilities
2 Tap water that is safe to drink
3 Kitchen sink
4 Refrigerator
5 Bath or shower
6 Toilet
7 Electricity supply
9 Not elsewhere included
Food security
Children and their families enjoy food security when they have the assured ability to acquire nutritionally adequate and safe foods that meet cultural needs in a socially acceptable way.54 Low food security exists in household situations with limited resources.55 In Aotearoa, food insecurity is driven mainly by a lack of sufficient money for food.56 Households reporting low food security spend less on food overall than households with moderate food security, and particularly spend less on fruit, vegetables and cereals and tend to spend less on milk.54,55 Measures of food insecurity at a household level may not always translate directly to the experience of individual children, as caregivers often seek to shield children from the full effects of food insecurity.56,57
The New Zealand Health Survey (NZHS) included a household food security questionnaire in selected years between 2012/13 and 2020/21.
This indicator presents information from the NZHS on 0–14 year olds in households that sometimes or often run out of food due to lack of money.
Data sources and methods
Indicator
Children in households that sometimes or often run out of food
Definition
Child respondents (aged 0–14 years) living in households where food runs out sometimes or often due to lack of money, based on caregiver response to the NZHS
Data source
New Zealand Health Survey (NZHS)
Further information
The survey question was: We are interested in whether you run out of basics, like bread, potatoes, etc because you do not have enough money. We are not referring to treats or special foods. Food runs out in our household due to lack of money. How often has this been true for your household over the past year? (1) often (2) sometimes (3) never
All dates are for year ended June 30. Data collection finished in March 2020 due to the COVID-19 pandemic so the sample size is smaller for the 2019/20 survey than for previous years. The sample size for the 2020/21 NZHS was also smaller than planned as a result of disruptions associated with the COVID-19 pandemic response.
In 2020/21 the NZHS found that around one in six children were living in households where food ran out sometimes (12.0%) or often (2.9%) due to lack of money. The proportion of children living in households that sometimes ran out of food was lower in 2020/21 than in 2019/20; there was no statistical difference in the proportion of children living in households that often ran out of food since 2015/16 (Figure 35).
Figure 35. Children in households that sometimes or often run out of food, by survey year, NZ Health Survey 2012/13–2020/21*
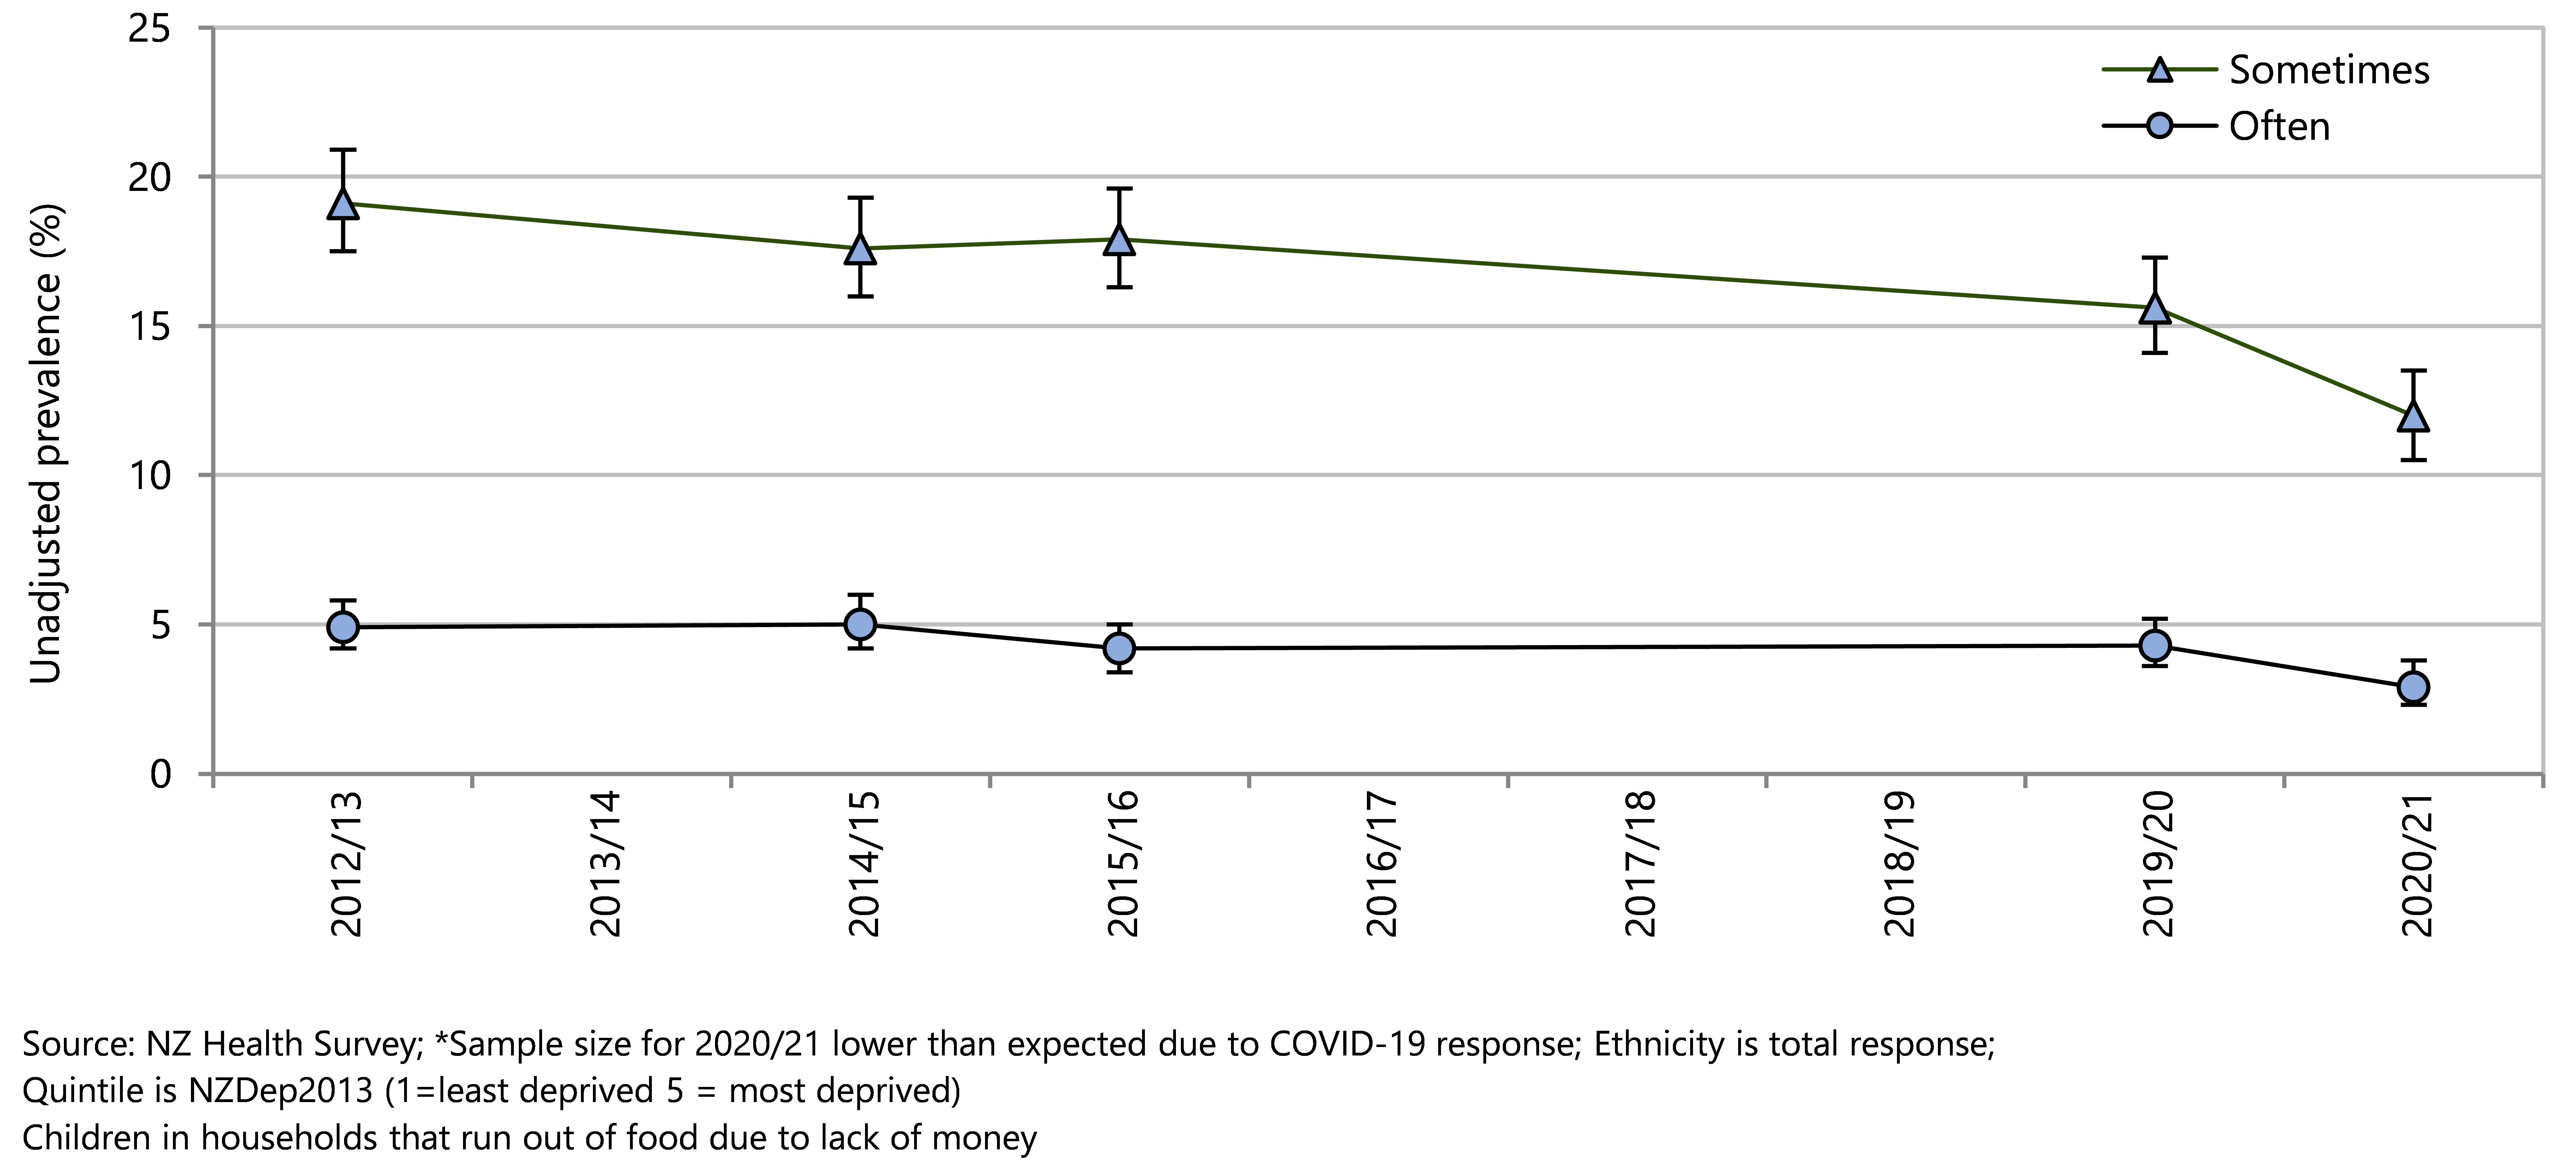
In the 2019/20 and 2020/21 NZHS years there was a strong association between the prevalence of households with children running out of food and neighbourhood deprivation. In 2020/21, 30.5% of children living in areas with the highest deprivation scores (NZDep2013 quintile 5) lived in households that sometimes or often ran out of food due to lack of money, compared with 4.6% of children living in neighbourhoods with the lowest NZDep scores (Quintile 1) (Figure 36). Inequity by ethnicity is demonstrated by the much lower proportion of European and Asian children in households that sometimes or always run out of food, compared with Māori and Pacific children (Figure 36). In 2020/21 over one-third (37.3%) of Pacific children and over one-quarter (26.4%) of tamariki Māori lived in a household that sometimes or often ran out of food due to cost. European and Asian children were better protected from inadequate nutrition, with one in nine (10.9%) European and 7% of Asian children living in households that sometimes or often ran out of food due to cost (Figure 36).
Figure 36. Children in households that sometimes or often run out of food, by demographic factor, NZ Health Survey 2019/20 and 2020/21
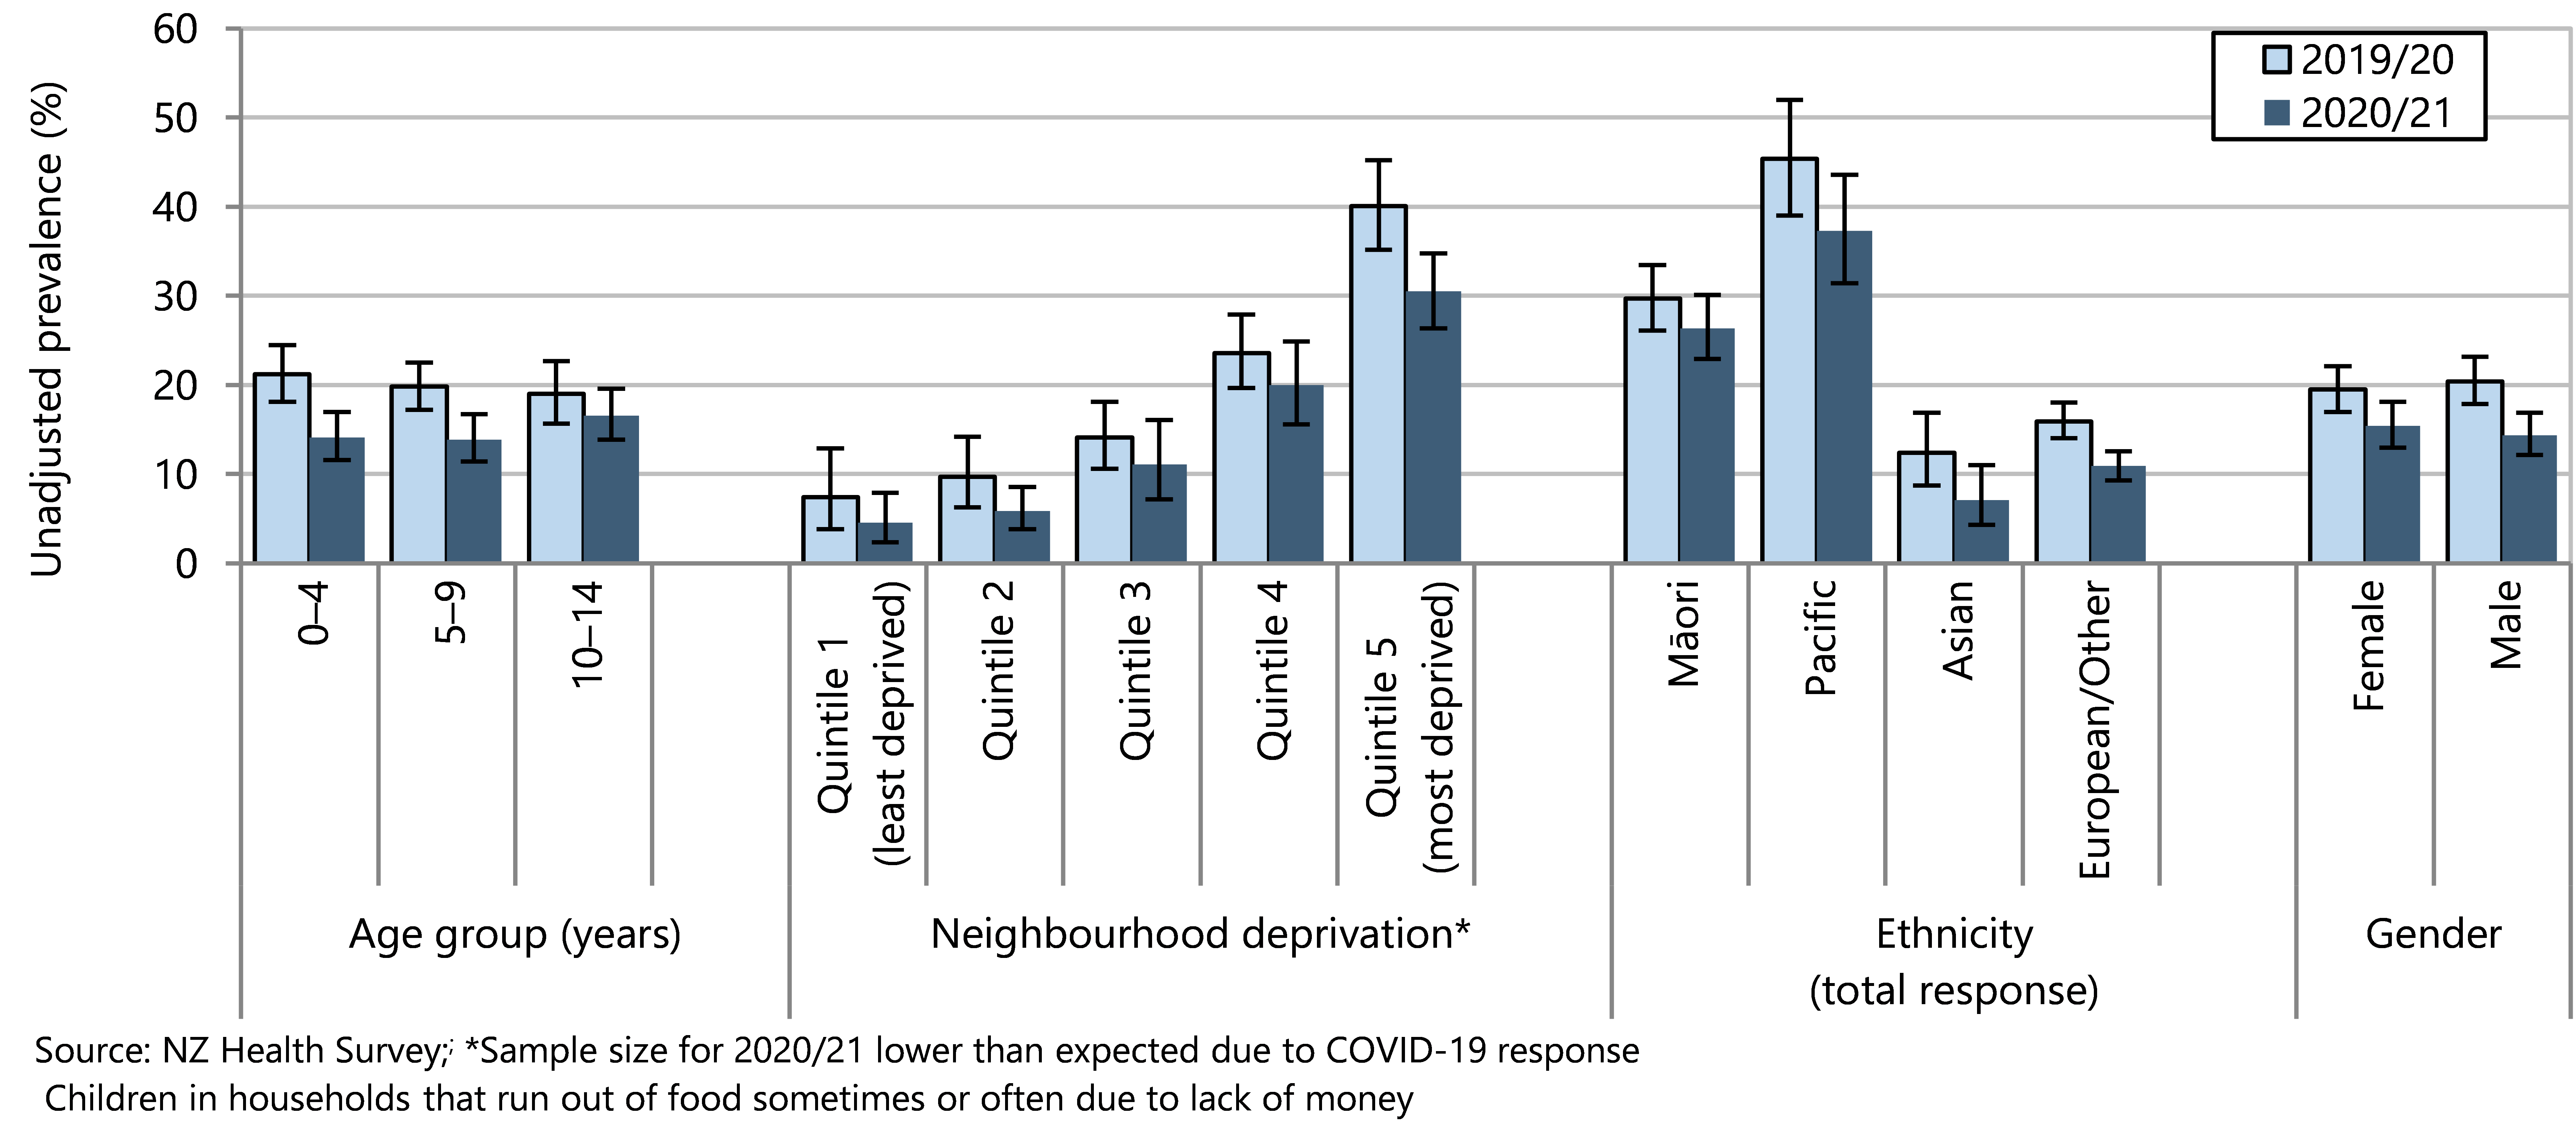
Health care access
Access to primary health care is a right included in the United Nations Convention on the Rights of the Child (Article 34) and an obligation of the State.58 Barriers to accessing primary care can negatively impact prevention or management of health issues, resulting in potentially avoidable hospitalisations and sometimes long-term health problems.
There have been significant policy initiatives to improve access to primary care for children in Aotearoa including the Zero Fees policy for standard GP and after-hours medical centre visits and removing prescription co-payment charges for children under the age of 14 years.59-62
This section presents information for the New Zealand Health Survey about access to primary care for children aged 0–14 years.
Data sources and methods
Indicators
GP visit in past 12 months
Unmet need for primary health care
Unfilled prescription
Unmet need for dental health care
Definitions
Child respondents (aged 0–14 years) are defined as having experienced an unmet need for primary health care when they have experienced one or more type of barrier in the past 12 months when they had a medical problem that needed attention: could not go to a GP or an after-hours medical centre due to cost, could not go to a GP or an after-hours medical centre due to lack of access to transport, could not go to a GP due to lack of childcare services for other children, and inability to get an appointment at their usual medical centre within 24 hours.
Data sources
New Zealand Health Survey (NZ Health Survey
Numerator(s) : Sum of the weights for the respondents in the group
Denominator : Sum of the weights for all respondents/population group
For more information on the NZ Health Survey, please refer either to the Ministry of Health website ( https://www.health.govt.nz ) or to appendices in this report.
Indicators: Children who have an unmet need for primary health care; GP visit(s) in past 12 months
Question A2.29a: In the past 12 months, was there a time when [child‘s name] had a medical problem but did not visit or talk to a GP because of COVID-19?
Yes / No
Question A2.30a: In the past 12 months, was there a time when [child‘s name] got a prescription but you did not collect one or more prescription items from the pharmacy or chemist because of COVID-19?
Yes / No
Question A2.50a: In the past 12 months, was there a time when [child‘s name] had a medical problem outside regular office hours, but you did not take him/her to an after-hours medical centre because of COVID-19?
Yes, because of COVID-19 / No
Question C2.01: Do you have a GP clinic or medical centre that you usually go to when [Name] is feeling unwell or is injured?
Yes / No
Question C2.02: What sort of health care service is this?
A GP clinic, medical centre or family practice / A clinic that is after-hours only – not an Emergency Department at a public hospital / Other______ [Specify]
Question C2.05a: In the past 12 months, has there been a time when you wanted [child’s name] to see or talk to a GP, nurse or other health care worker at your usual medical centre within the next 24 hours, but he/she was unable to be seen?
Yes / No
Question C2.06: The last time [Name] couldn’t be seen or talked to within 24 hours, why was that?
There weren’t any appointments / The time offered didn’t suit me / The appointment was with a doctor I didn’t want to see / I could have seen a nurse but I wanted to see a doctor / Another reason [Specify] _________________
Question C2.11a: In the past 12 months, has [child’s name] seen or talked to a GP, or been visited by a GP, about his/her own health? By health, I mean mental and emotional health as well as physical health.
Yes / No
Question C2.12: How many times did [child’s name] see or talk to a GP in the past 12 months?
_____ times
Question C2.27a: In the past 12 months, was there a time when [child’s name] had a medical problem but did not visit or talk to a GP because of cost?
Yes / No
Question C2.28: In the past 12 months, was there a time when [child’s name] had a medical problem but did not visit a GP because you had no transport to get there?
Yes / No
Question C2.29: In the past 12 months, was there a time when [child’s name] had a medical problem but did not visit a GP because you could not arrange childcare for other children?
Yes / No / Doesn’t apply
Question C2.29a: In the past 12 months, was there a time when [Name] had a medical problem but did not visit or talk to a GP because of COVID-19?
Yes / No / Doesn’t apply
Question C2.49: In the past 12 months, was there a time when [child’s name] had a medical problem outside regular office hours but you did not take him/her to an after-hours medical centre because of cost?
Didn’t have a medical problem outside regular office hours / Yes, didn’t go because of cost / No
Question C2.50: In the past 12 months, was there a time when [child’s name] had a medical problem outside regular office hours but you did not take him/her to an after-hours medical centre because you had no transport to get there?
Yes, didn’t go because had no transport to get there / No
Question C2.50a In the past 12 months, was there a time when [Name] had a medical problem outside regular office hours, but you did not take him/her to an after-hours medical centre because of COVID-19?
Indicator: Unfilled prescription
Question C2.30 In the past 12 months, was there a time when [Name] got a prescription but you did not collect one or more prescription items from the pharmacy or chemist because of cost?
Yes / No
Question C2.30a In the past 12 months, was there a time when [Name] got a prescription but you did not collect one or more prescription items from the pharmacy or chemist because of COVID-19?
Yes / No
Indicator: Unmet need for dental health care
Question C2.83a In the last 12 months, have you avoided taking [Name] to a dental health care worker because of the cost?
Yes / No
The New Zealand Health Survey found that 64.5% of children aged under 15 years had visited or talked to a GP in the past 12 months. The proportion higher for the youngest children (78.8% of 0–4-year-olds) and slightly but significantly lower for Māori (59.2%) and Pacific children (59.2%). On average each child who saw or talked to a GP had 3.1 visits.
In 2020/21, an estimated 169,000 children missed out on needed primary care services due to at least one barrier, such as cost, transport, lack of childcare, or inability to get a timely appointment. The most common barrier, affecting around 145,000 children, was not being able to get an appointment at their usual medical centre within 24 hours (Figure 37). Around 35,000 children had a medical problem but did not visit or talk to a GP because of COVID-19. The COVID-19 pandemic was also a barrier to children attending after-hours medical services and filling prescriptions. Barriers related to COVID-19 could include fear of being infected, pandemic restrictions, not wanting to have a virtual consultation, or other concerns. The COVID-19 indicators were added in 2020/21 to capture COVID-19 as a barrier to access primary care services.
Figure 37. Children who have an unmet need for primary health care, by barrier, Aotearoa, 2020/21
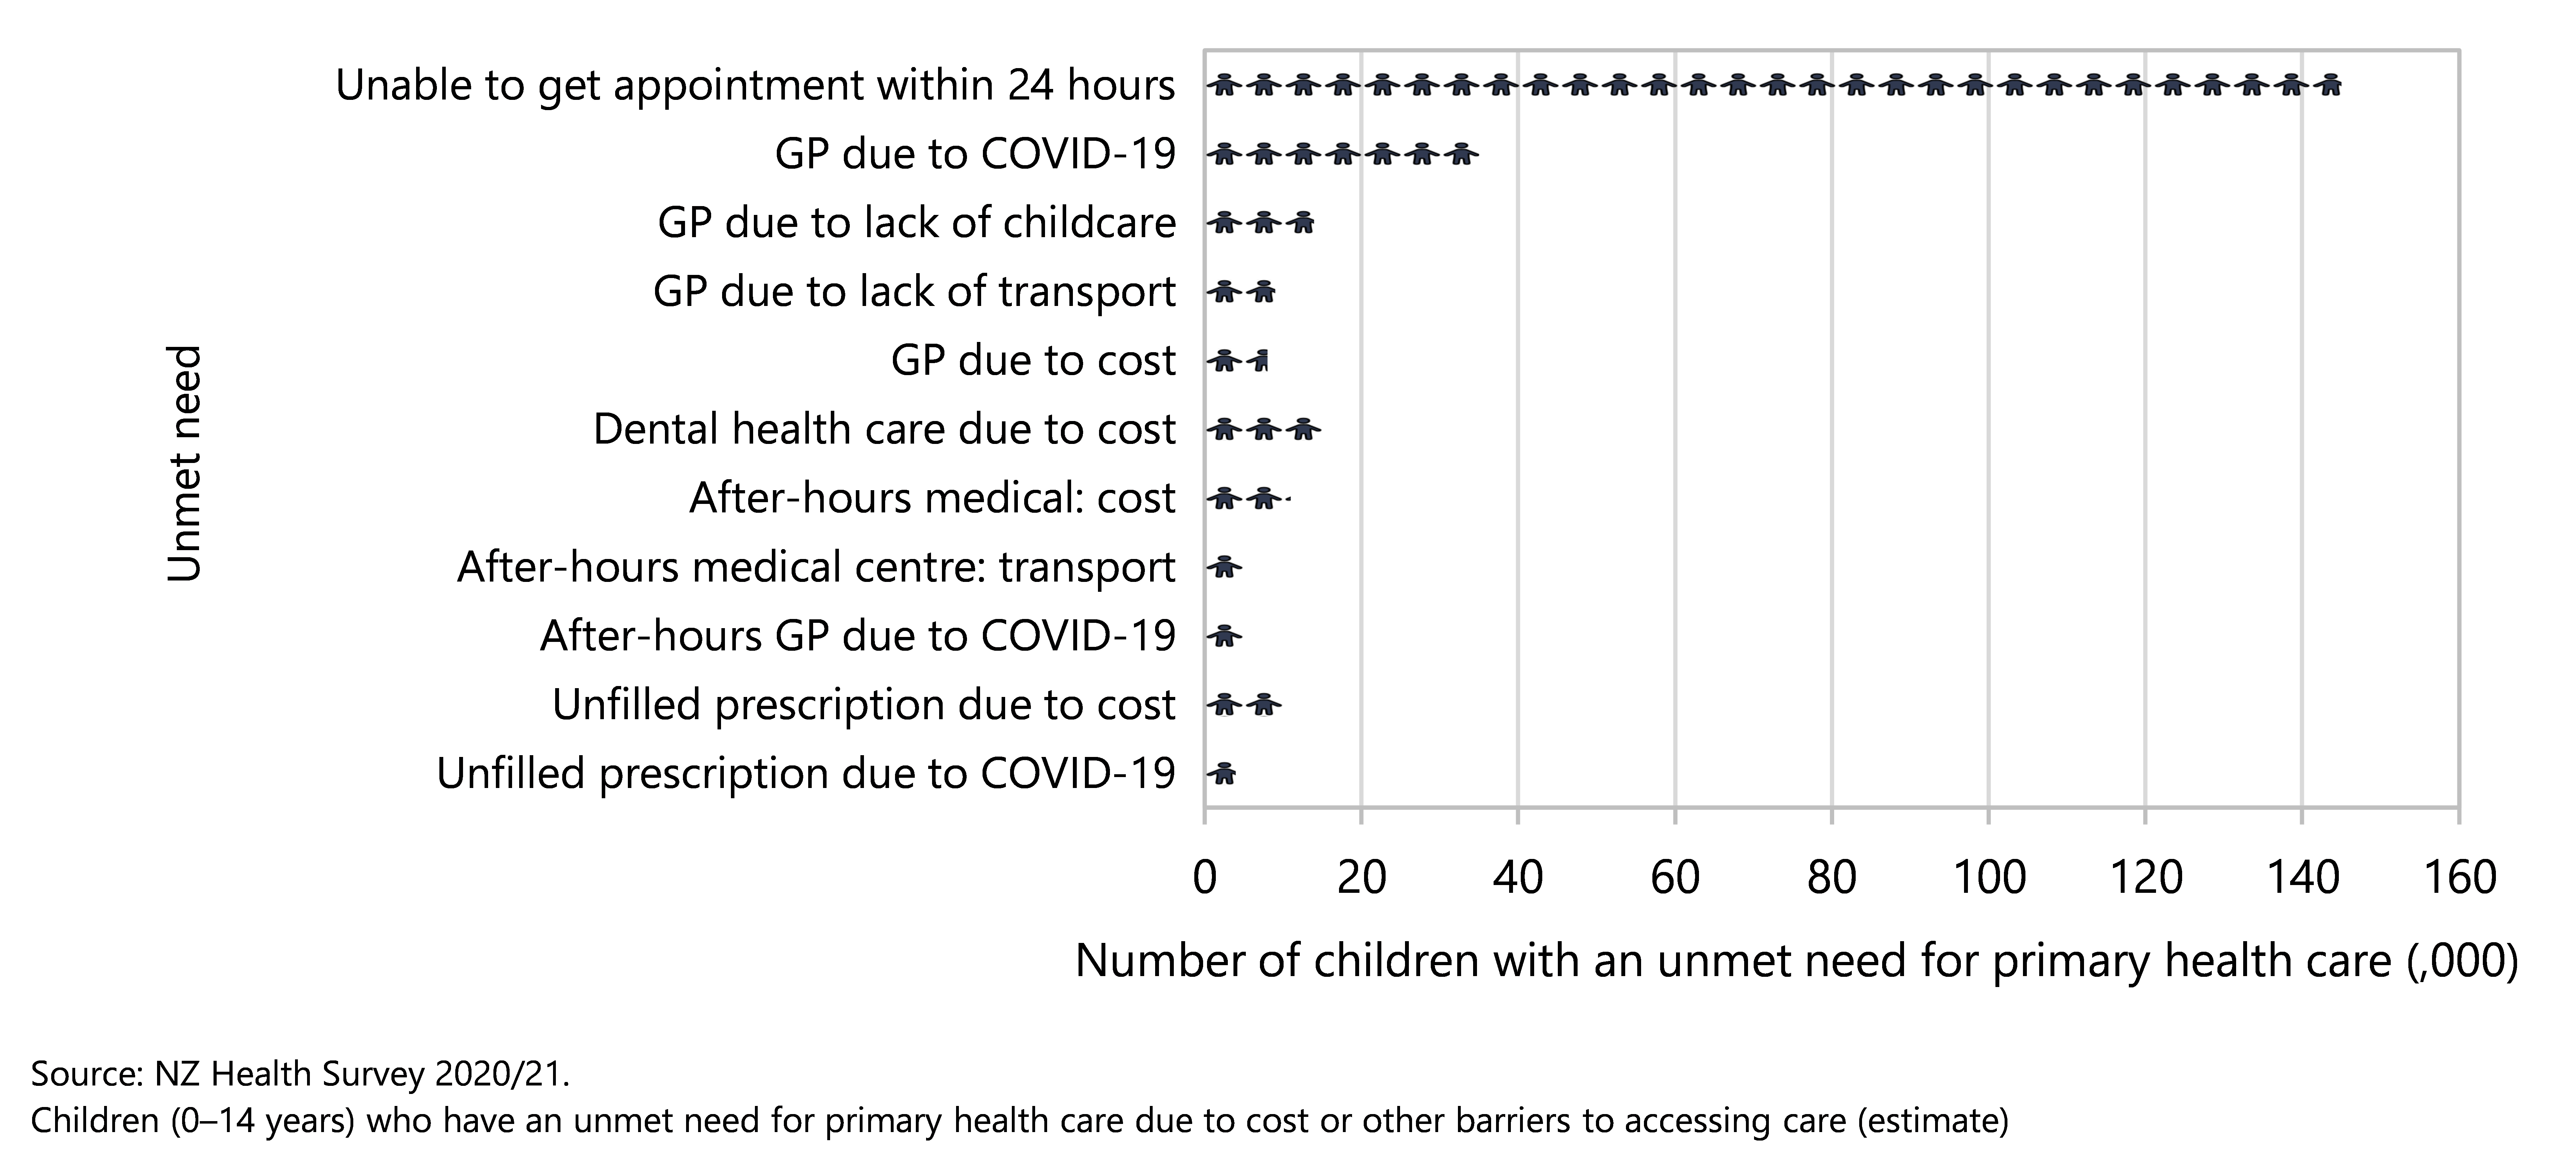
The proportion of children experiencing unmet needs for primary medical care due to cost or other barriers varied from year to year (Figure 38). The question asked changed in 2020/21 to include virtual consultations so caution is needed when comparing this most recent data point with previous years.
Figure 38 . Children who have an unmet need for primary health care, by NZ Health Survey year, Aotearoa 2011/12–2020/21
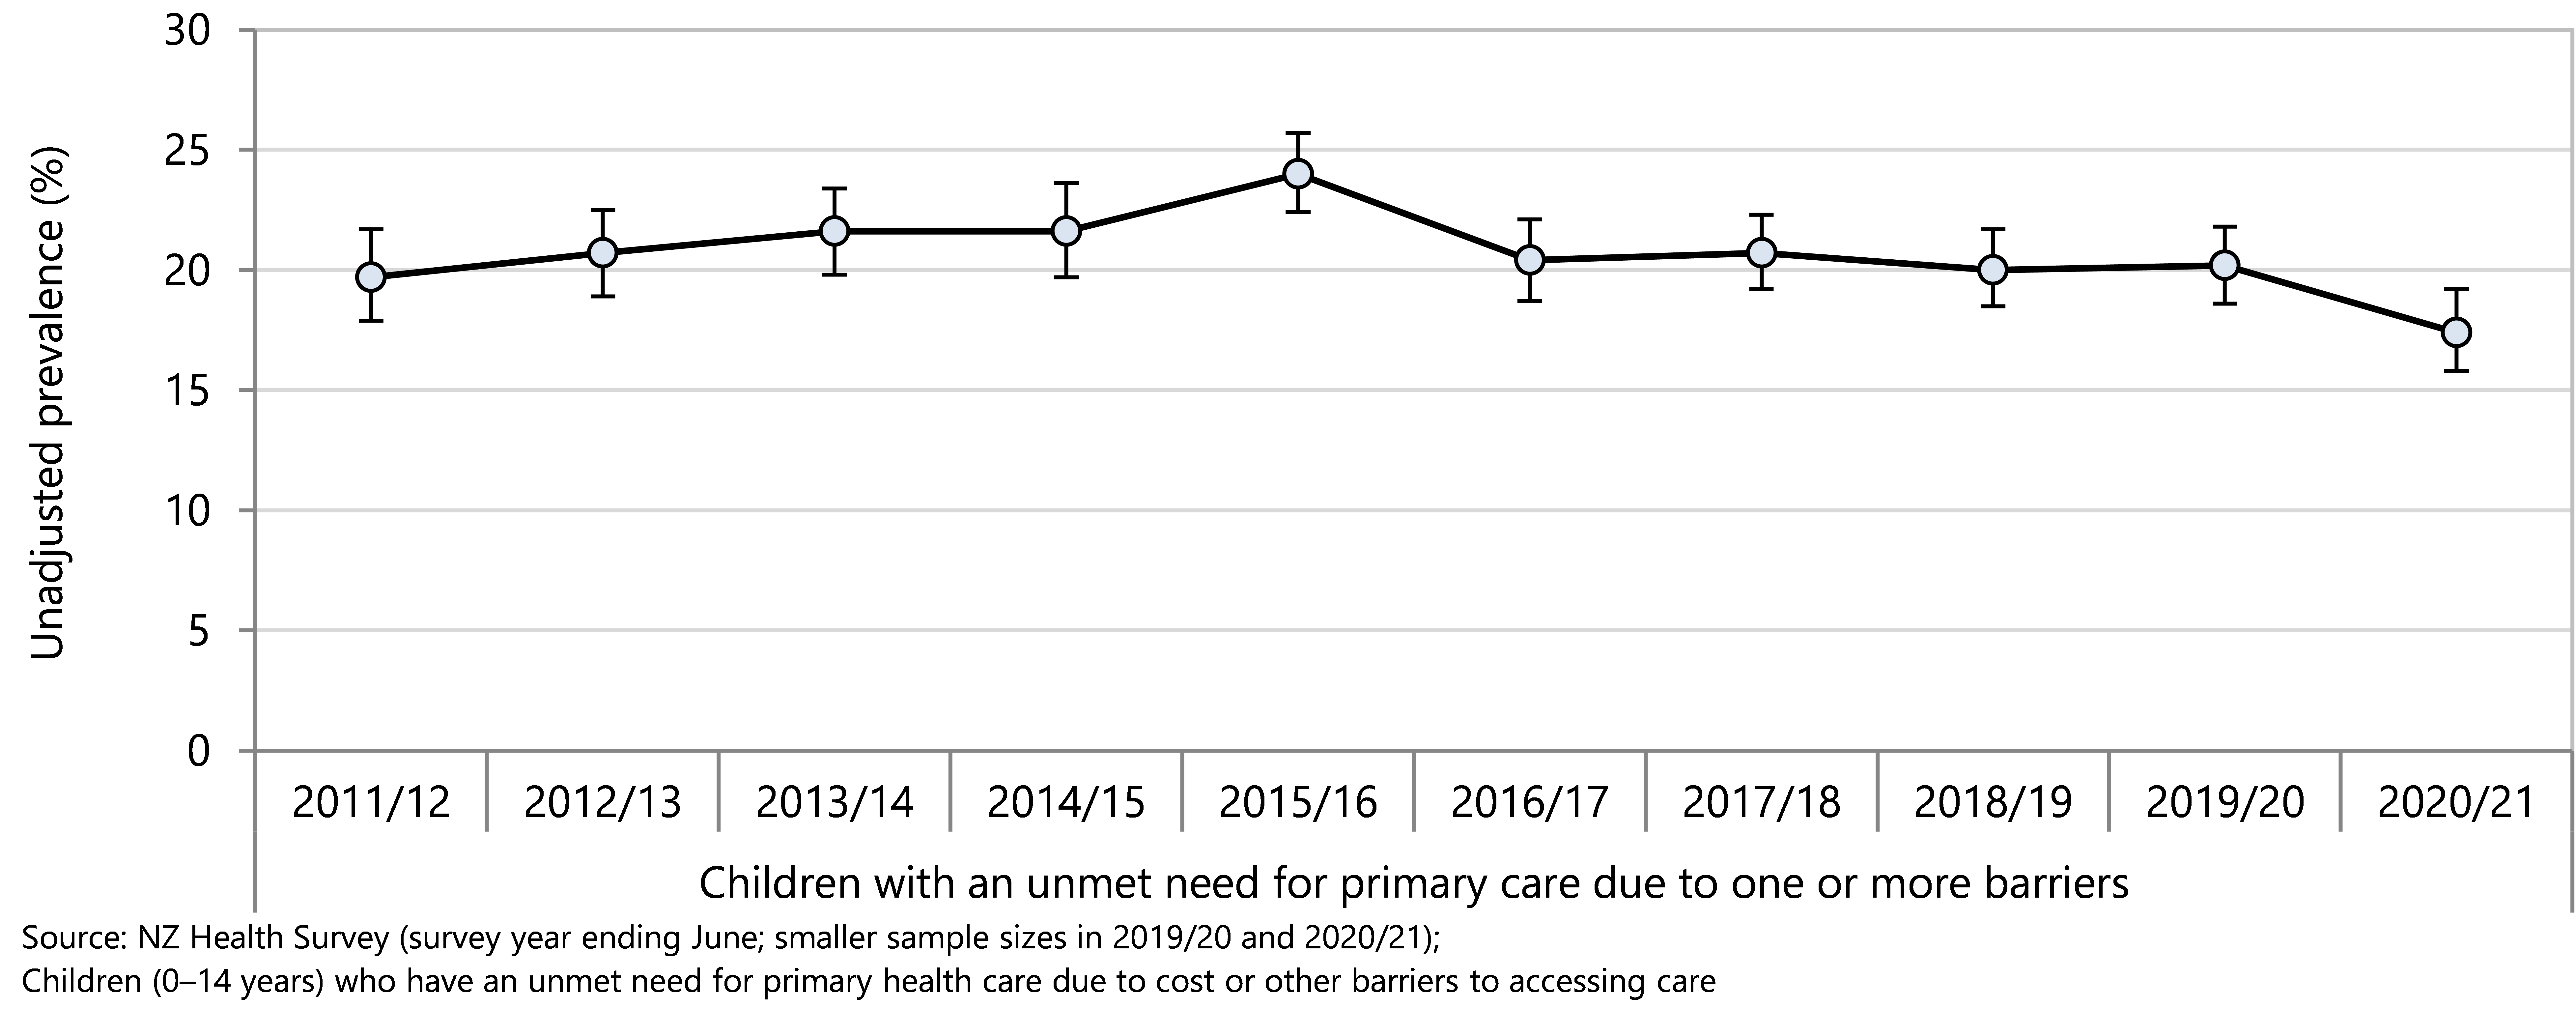
Figure 39 presents the proportion of children who had an unmet medical need for primary care or an unfilled prescription, due to cost, over time. After 2015, there has been an overall decline in the proportion of children missing out on seeing a general practitioner, seeing an after-hours medical centre, or filling a prescription because of cost.
In 2011/12, nearly 7% of children (60,000) were unable to fill a prescription because of the cost; the significant decline to 1.0% in 2020/21 still left an estimated 10,000 children without prescribed medication. Because of cost, nearly 5% of children (43,000) experienced having a medical need but being unable to see a general practitioner in 2011/12, which fell to around less than 1% in 2020 (8000 children) (Figure 39).
Figure 40 presents the proportion of children missing out on primary care due to lack of transport. The proportion of children missing out on needed general practitioner services due to lack of transport has shown some year-to-year variation and declined overall from 2011/12–2020/21. The proportion of children missing out on after-hours medical care due to lack of transport has fallen slowly overall from 3% in 2011/12 to 1% in 2020/21.
Figure 39 . Children who have an unmet need for primary health care due to cost, by NZ Health Survey year, Aotearoa 2011/12–2020/21
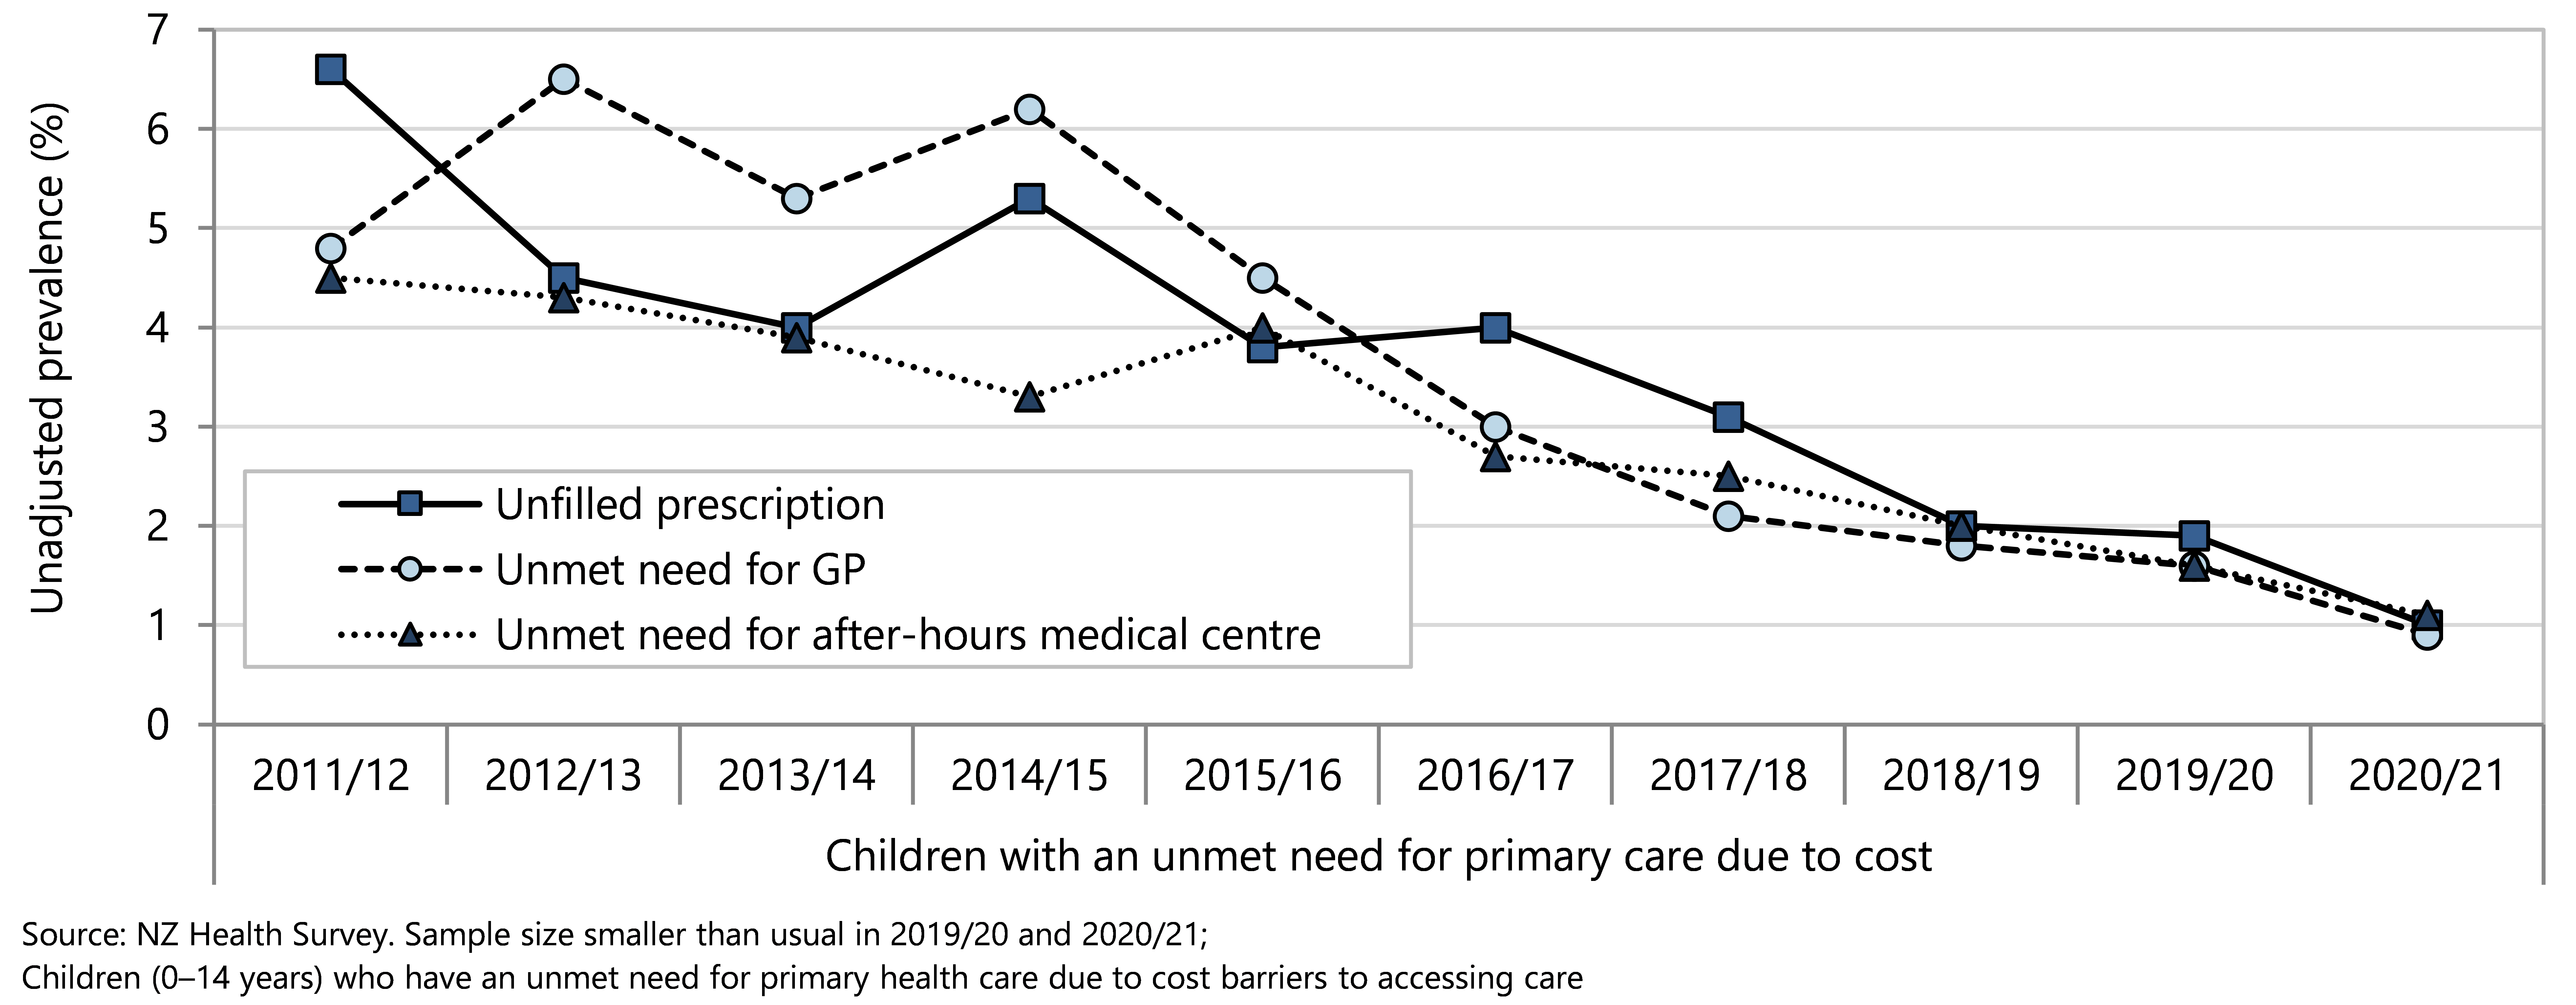
Figure 40 . Children who have an unmet need for primary health care due to lack of transport, by NZ Health Survey year, Aotearoa, 2011/12–2020/21
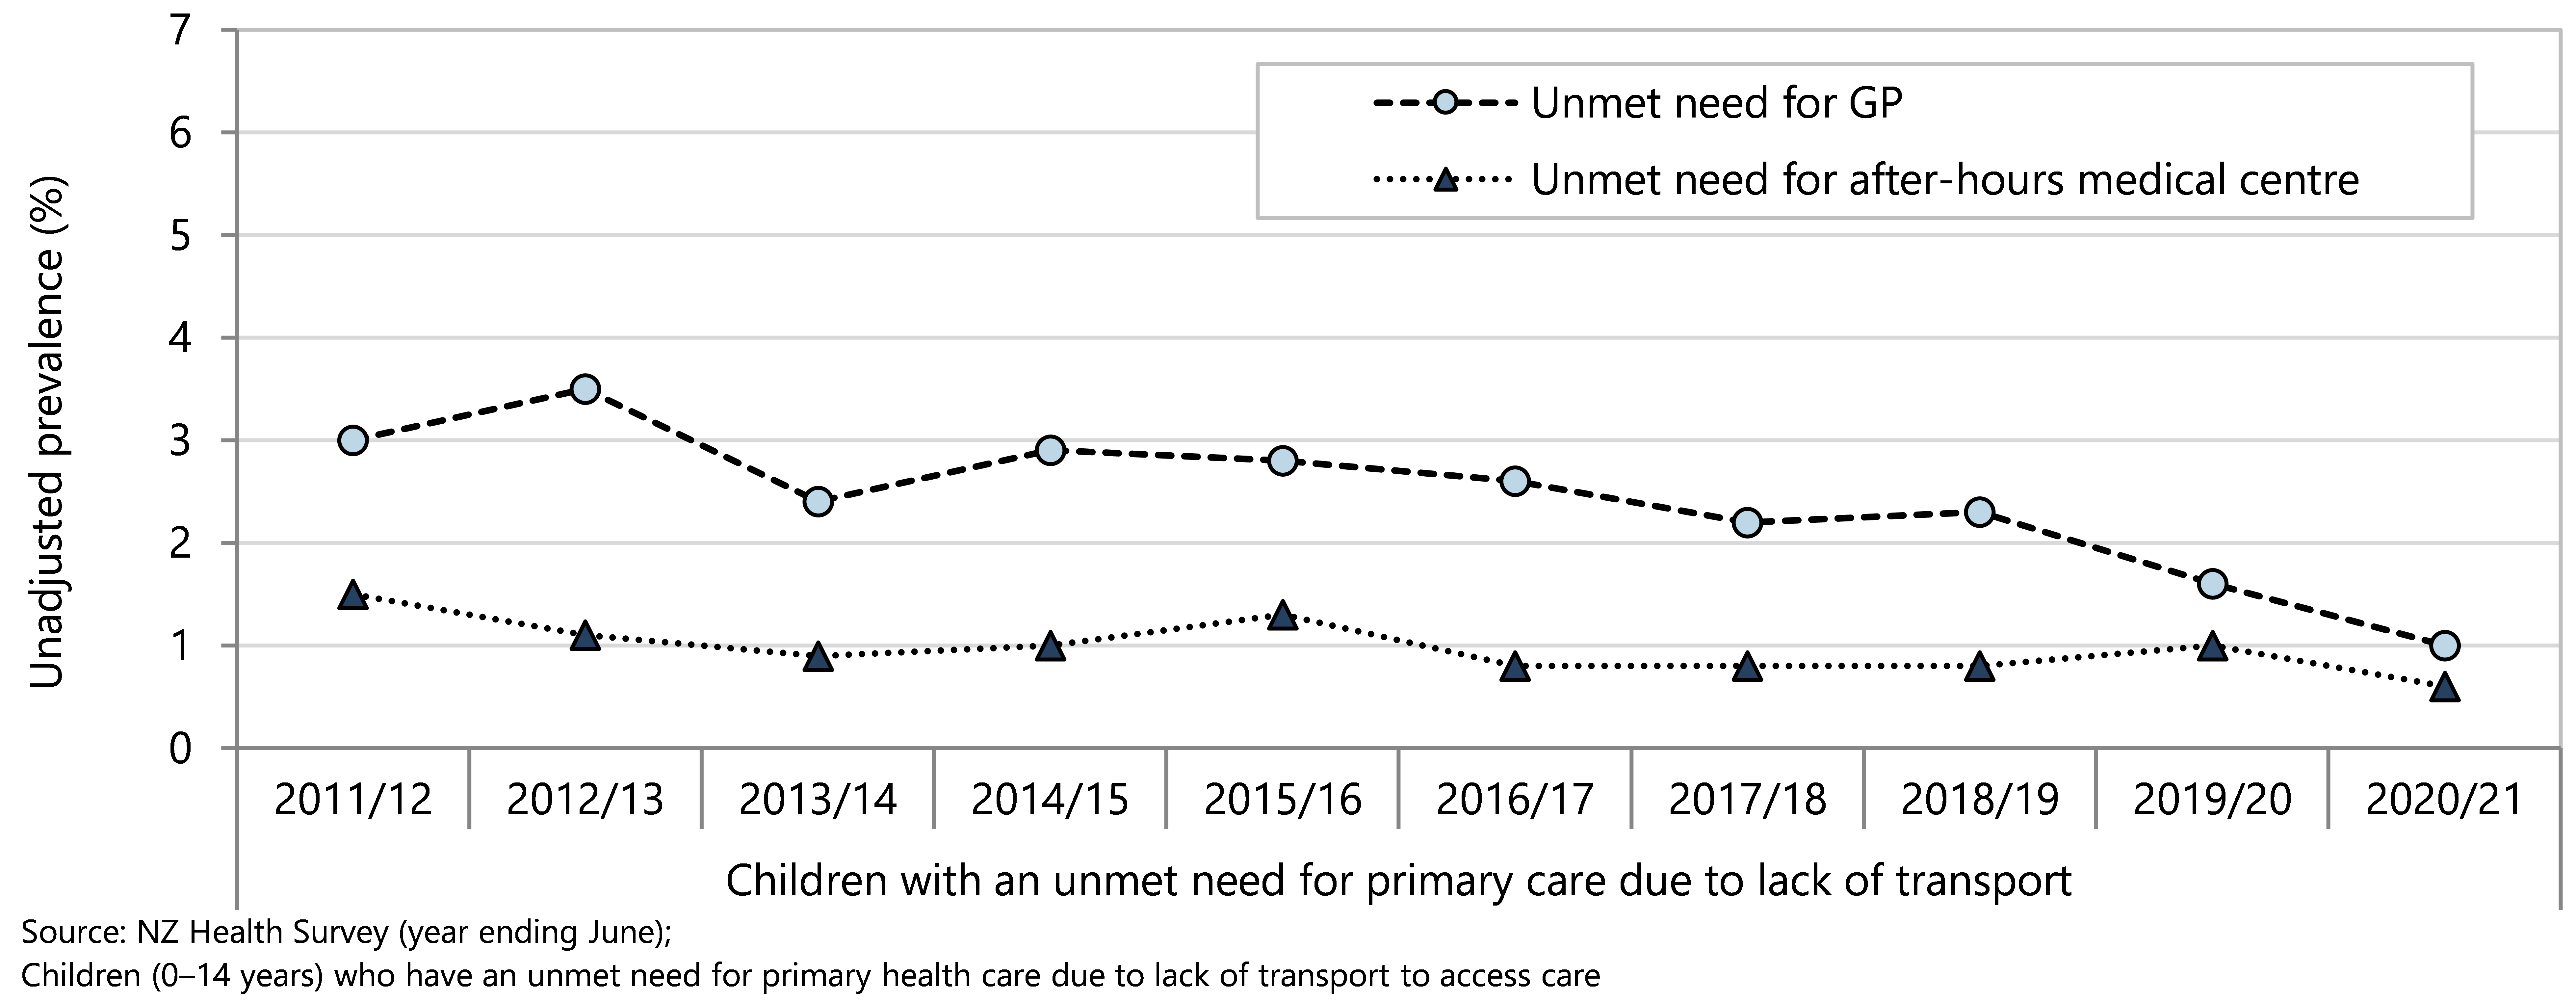
Barriers to accessing primary care were disproportionately experienced by Māori and Pacific children compared with European/Other in 2020/21. The differences by neighbourhood deprivation are not statistically significant in this overall indicator (Figure 41).
Inequity is most obvious when considering lack of transport as a barrier to primary health care. Māori and Pacific children disproportionately experience lack of transport as a barrier to both GP consultations and after-hours care (Figure 42). There was a tendency for children living in areas with the highest deprivation scores to disproportionately experience lack of transport as a barrier to accessing primary care and after-hours care but this was not statistically significant.
Figure 41 . Children who have an unmet need for primary health care, by demographic variable, Aotearoa 2020/21
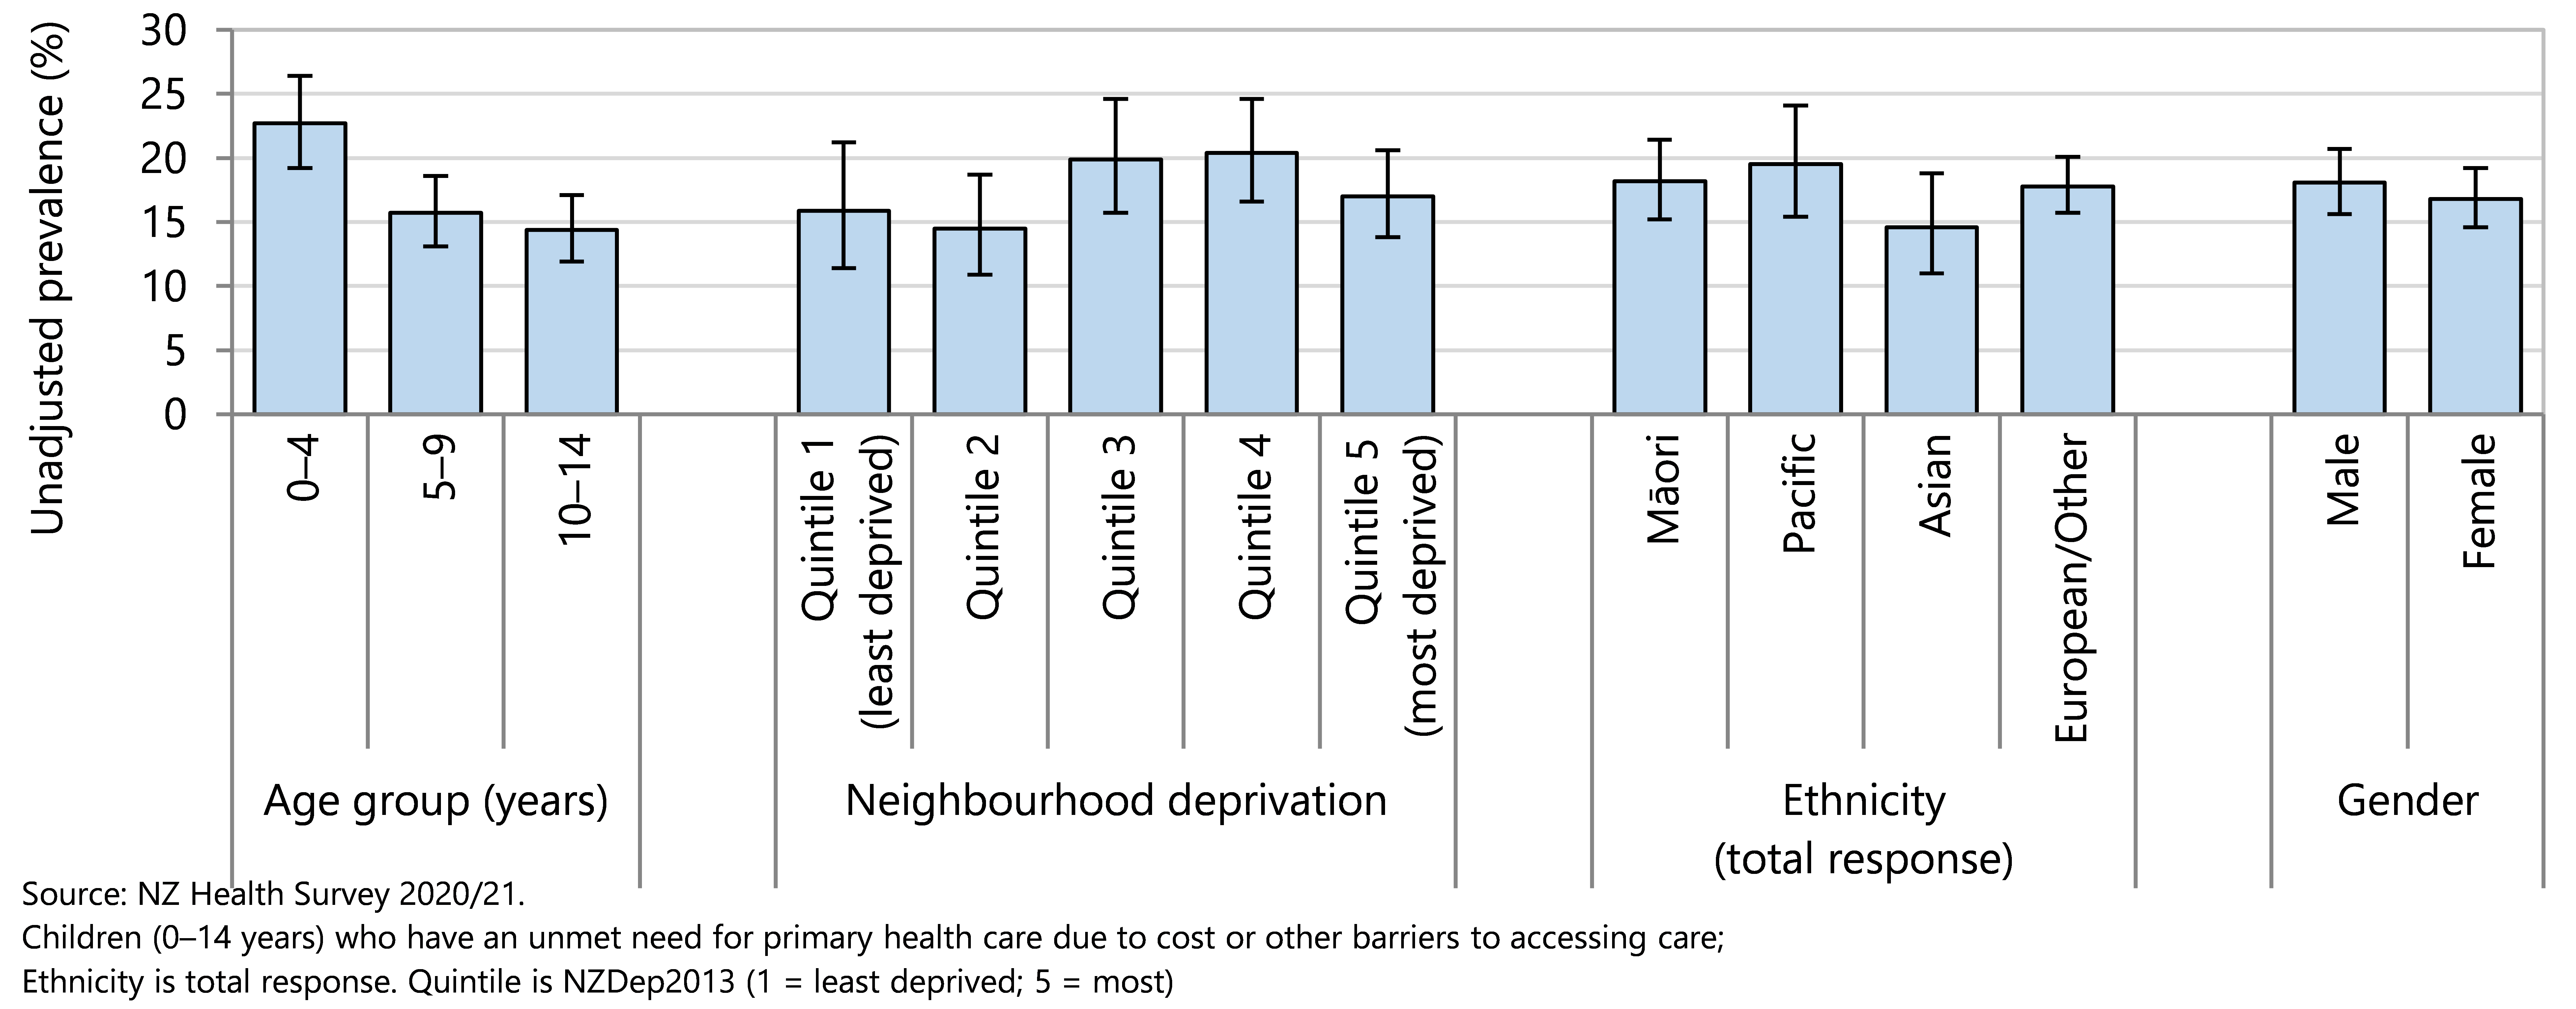
Figure 42 . Children who have an unmet need for primary health care due to lack of transport, by ethnicity, Aotearoa 2020/21
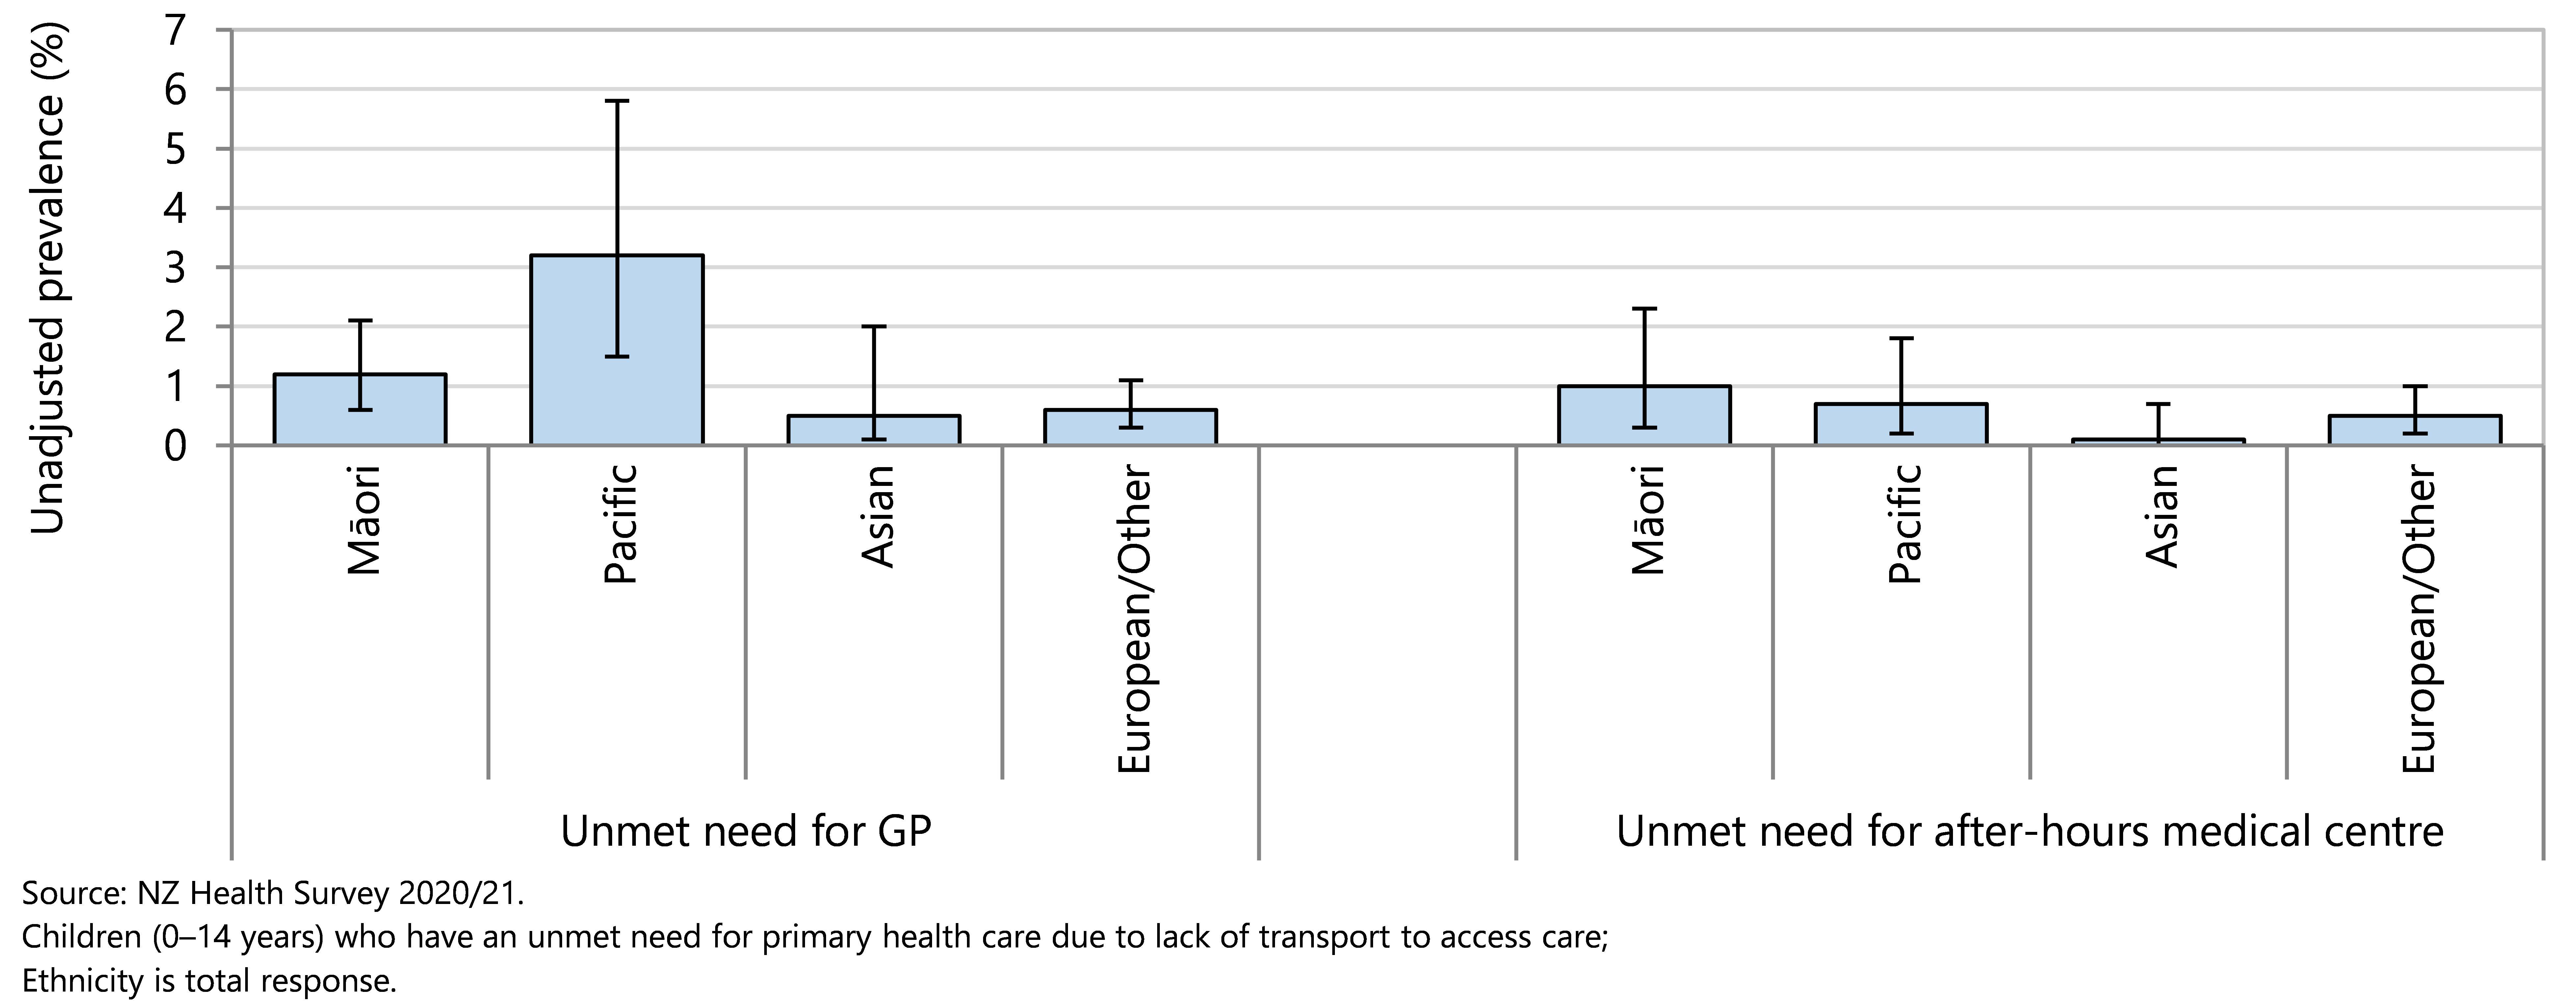
Early deaths
Delays in the coronial process mean that updated cause of death data were not available in time for the 2022 Child Poverty Monitor. This section reports the data provided in the 2021 Child Poverty Monitor technical report.
Investigating childhood deaths is important to find out why children die so we can take decisions that help prevent future deaths of children.63 From the socioeconomic gradient associated with childhood deaths, we know that the availability and equitable distribution of resources within a society impact on children’s life chances. Children’s lives can be protected through supportive social policy and redistributive fiscal measures.64
This section reviews infant deaths of under-15-year-olds in Aotearoa, using information from the National Mortality Collection and the Birth Registration Dataset. A subsection reviews infant deaths including sudden unexpected death in infancy (SUDI).
Data sources and methods
Indicators
Deaths of 0–14 year olds
Data sources
Numerator: National Mortality Collection
Denominator : NZCYES Estimated Resident Collection (ERP), with intercensal extrapolation
Definitions
Deaths : Deaths (excluding neonates) with a medical condition or injury documented in MORT as the main underlying cause of death and post-neonatal sudden unexpected deaths in infancy (SUDI)
Additional information
Cause of death is the main underlying cause of death. Refer to Appendix 1 for relevant codes.
SUDI rates are traditionally calculated per 1,000 live births. However in this section of the report the denominator used was children aged 0–14 years, so that the relative contribution SUDI makes to mortality in this age group is more readily appreciated. As a result, SUDI rates in this section are not readily comparable to SUDI rates reported in the infant death section. SUDI data are presented separately because SUDI can be included in both medical condition and injury classifications.
The all-cause mortality rate for under-15 year olds, excluding neonates, declined from 62.0 to 22.1 deaths per 100,000 age-specific population between 1990–91 and 2018 (Figure 43). Because of delays in recording causes of deaths under coronial investigation, there is a lag in the release of New Zealand mortality data (2018 data were released in 2021 and not updated further in 2022).
Figure 43 . All-cause mortality rate in 0–14 year olds (excluding neonates) Aotearoa 1990–2018
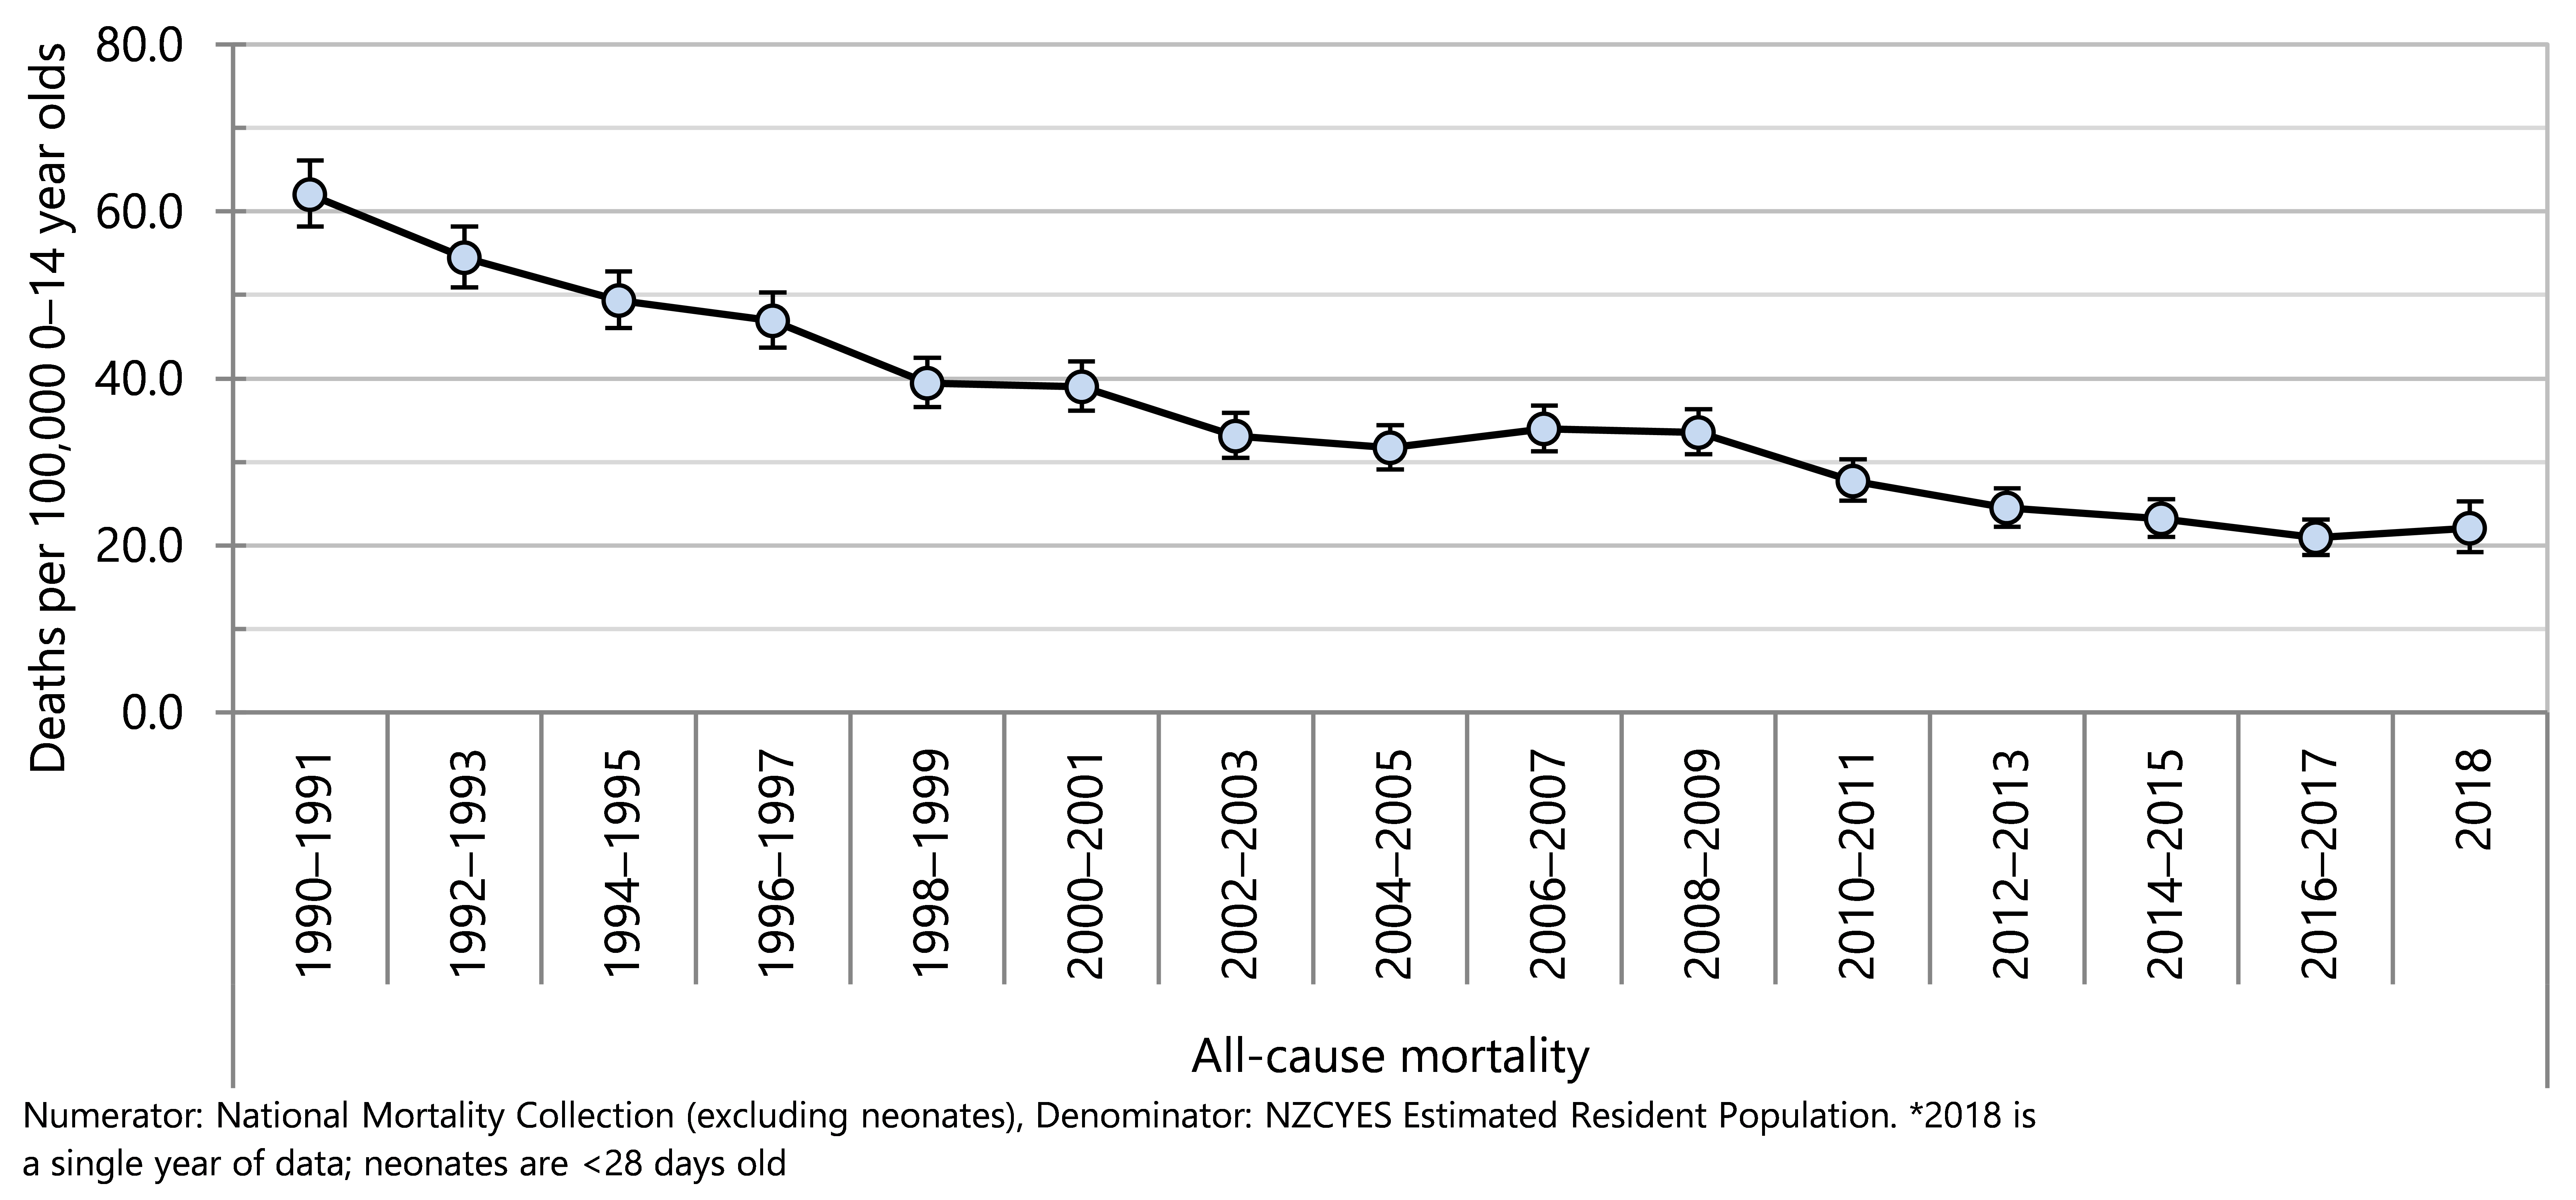
In the five years from 2014–2018 there were 1,027 deaths of 0–14 year olds (excluding neonates). Of these deaths, 557 were as a result of medical conditions (an annual average of 111 deaths), 252 as a result of injury (annual average of 50 deaths) and 217 sudden unexpected deaths in infancy (SUDI) (annual average of 43 deaths) (Table 4).
Table 4 . All-cause mortality in 0–14 year olds (excluding neonates), by cause of death category, Aotearoa 2014–2018
| Cause of death | 2014–2018 (n) | Annual average (n) | Rate per 100 000 population | 95% CI | % |
| New Zealand | |||||
| All-cause mortality | |||||
| Medical conditions | 557 | 111 | 12 | 10.99–13.00 | 54 |
| Injury | 252 | 50 | 5 | 4.77–6.12 | 25 |
| SUDI | 217 | 43 | <5 | 4.06–5.32 | 21 |
| Total | 1,027 | 205 | 22.06 |
| 100.0 |
Māori and Pacific under-15-year olds experienced a significantly higher mortality rate compared with Asian/Indian and European/Other children, in the five years from 2014–2018 (Figure 44). The mortality rate for children living in neighbourhoods with the highest NZDep2013 scores (greatest deprivation, quintile 5) was just over three times as high as the mortality rate in quintile 1. Children in quintile 4 also experienced a significantly higher mortality rate than children in quintile 1 (Figure 44).
Figure 44 . All-cause mortality in 0–14 year olds (excluding neonates), by demographic factor, Aotearoa 2014–2018
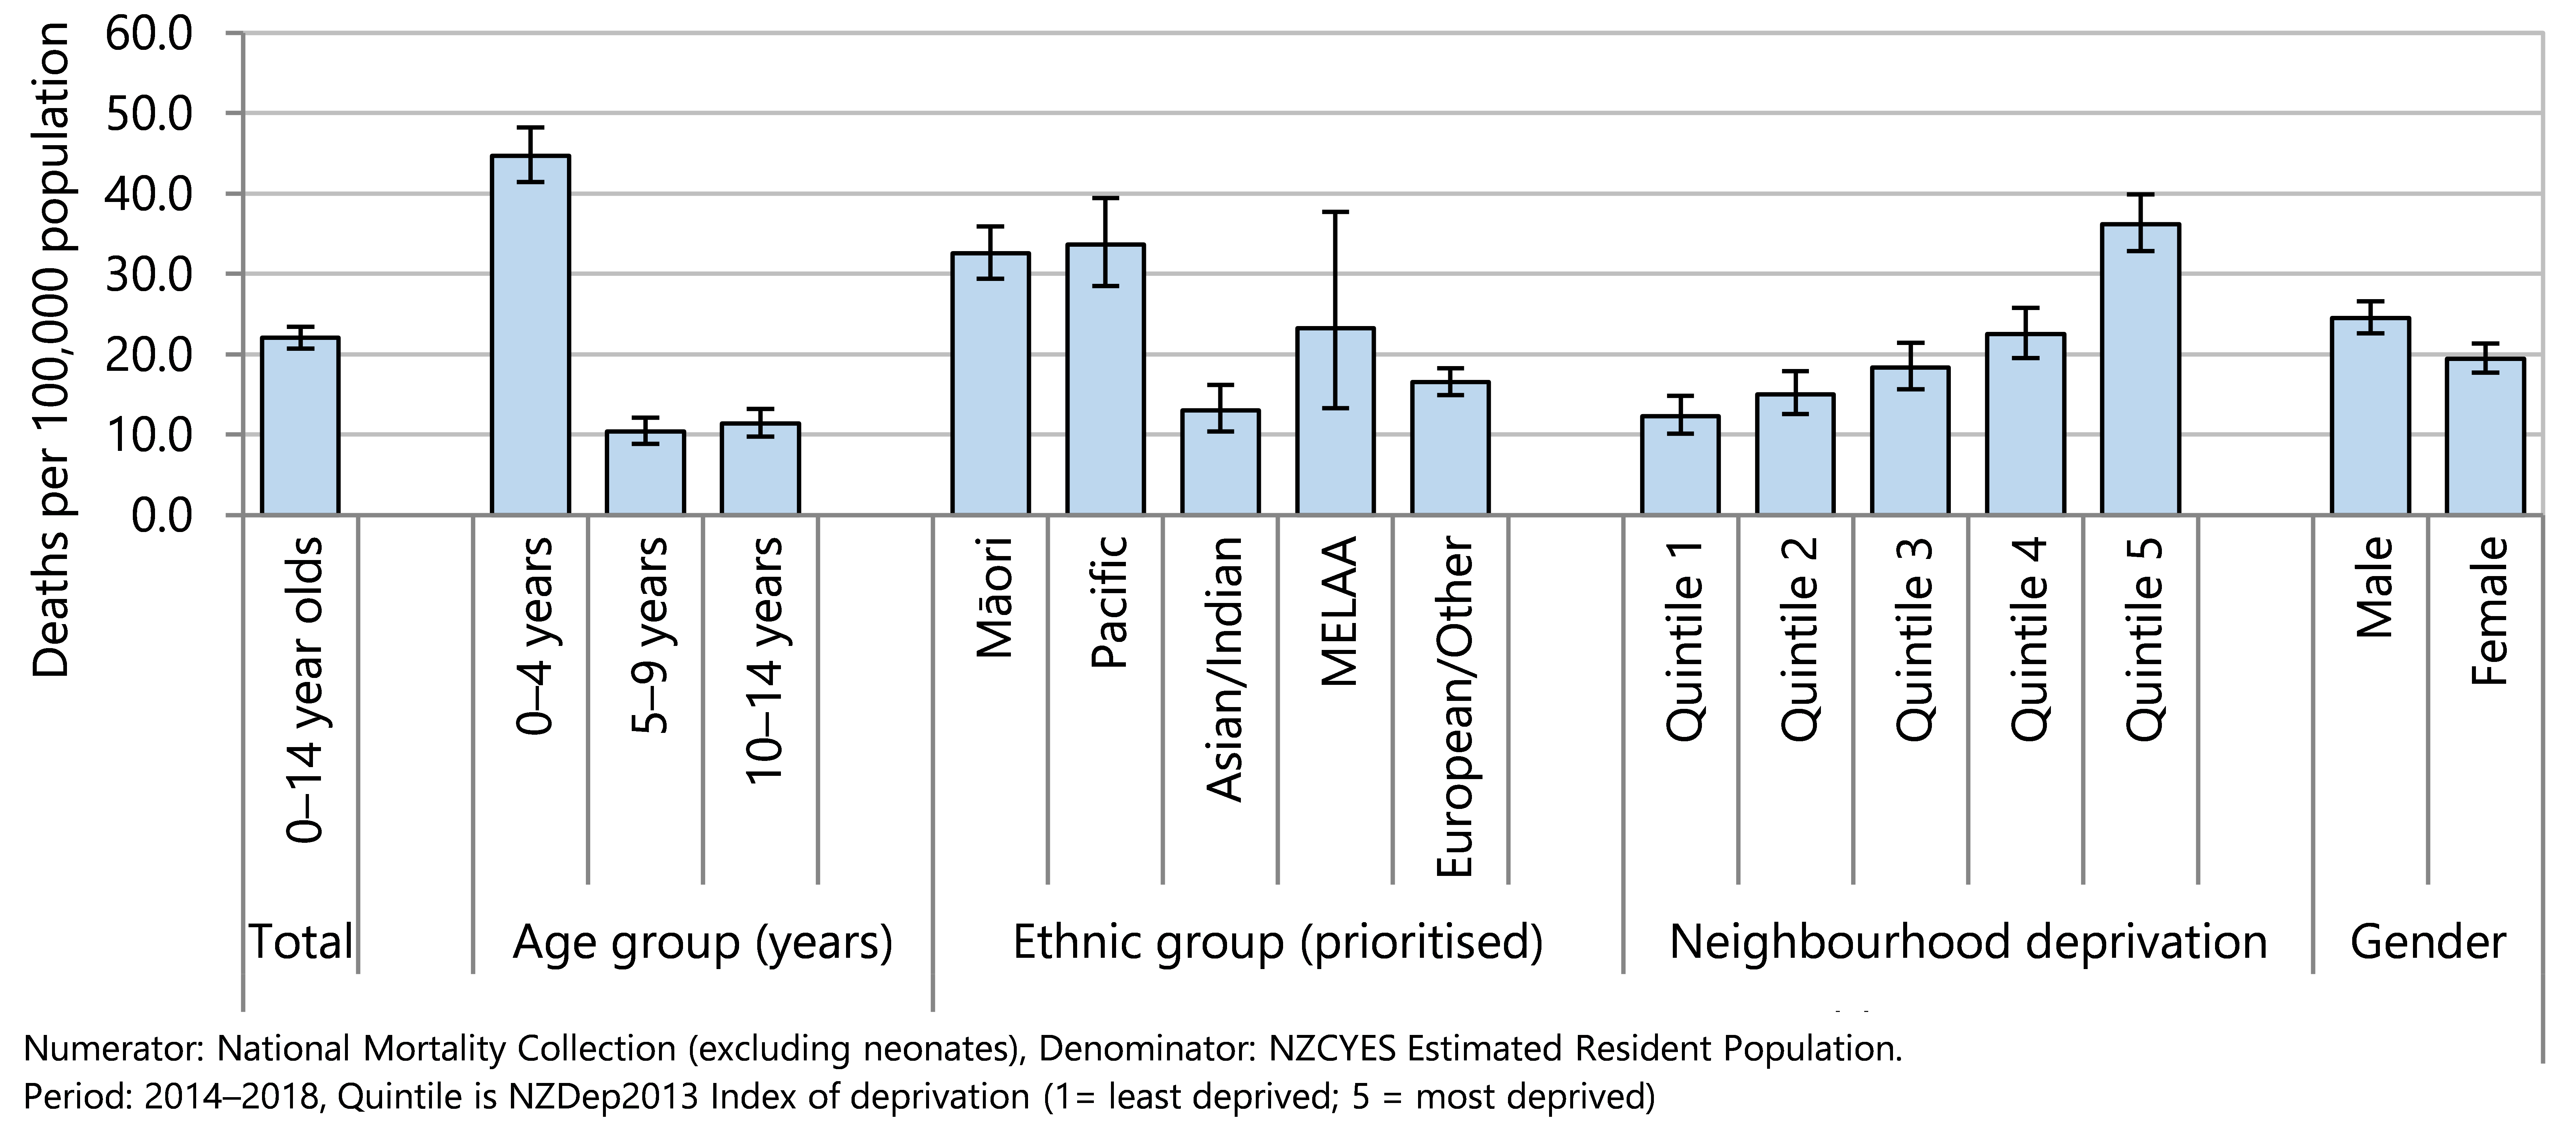
The social gradient in all-cause mortality rates in under-15 year olds was present throughout the whole period from 1990–2017, with a marked gap between mortality rates for children living in areas with the highest deprivation scores (quintile 5) and others (Figure 45). Although mortality rates have declined in all NZDep2013 quintiles, there has been no sustained narrowing of the gap between children living in the most deprived areas (quintile 5) and their peers (Figure 45).
Between 1996–97 and 2016–17, there was persistent inequity between mortality rates for Māori and for Pacific children aged under 15 years, compared with mortality rates of their European/Other and Asian/Indian peers. A decrease in mortality rates has been seen across all ethnic groups, with some narrowing of the equity gaps (Figure 46). There is a need for effective policy and sustained effort to bring about a society where every child has an equitable opportunity to survive.
Figure 45. Mortality rates in 0–14 year olds (excluding neonates), by deprivation score, Aotearoa 1990–2017
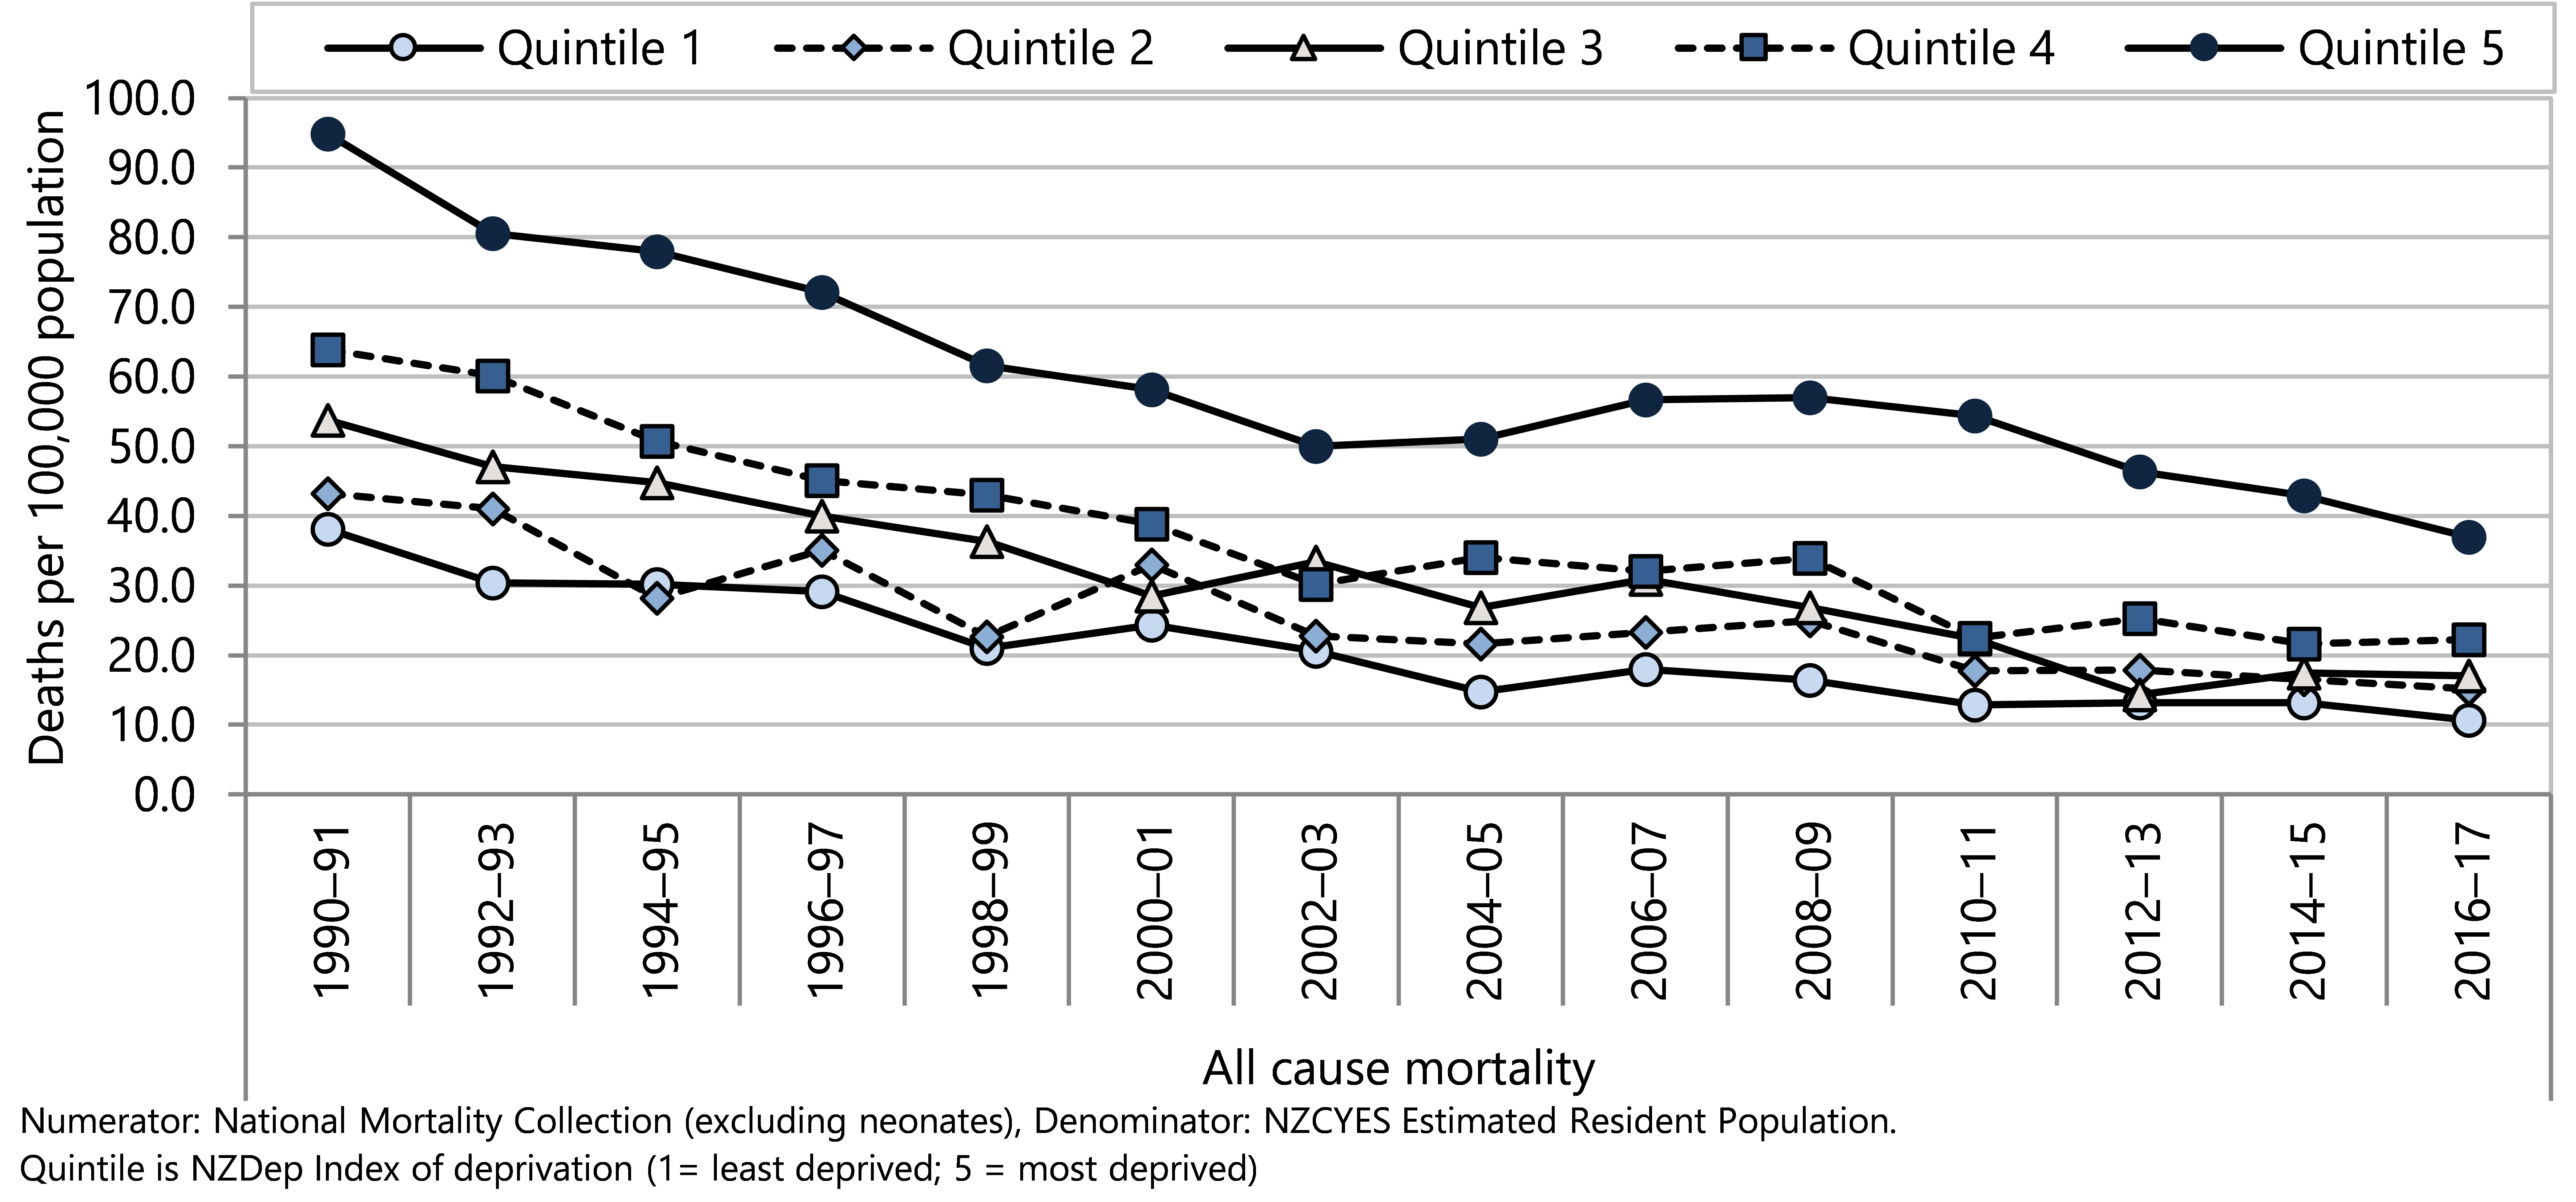
Figure 46 . Mortality rate of 0–14 year olds (excluding neonates), by ethnicity, Aotearoa 1996–2016
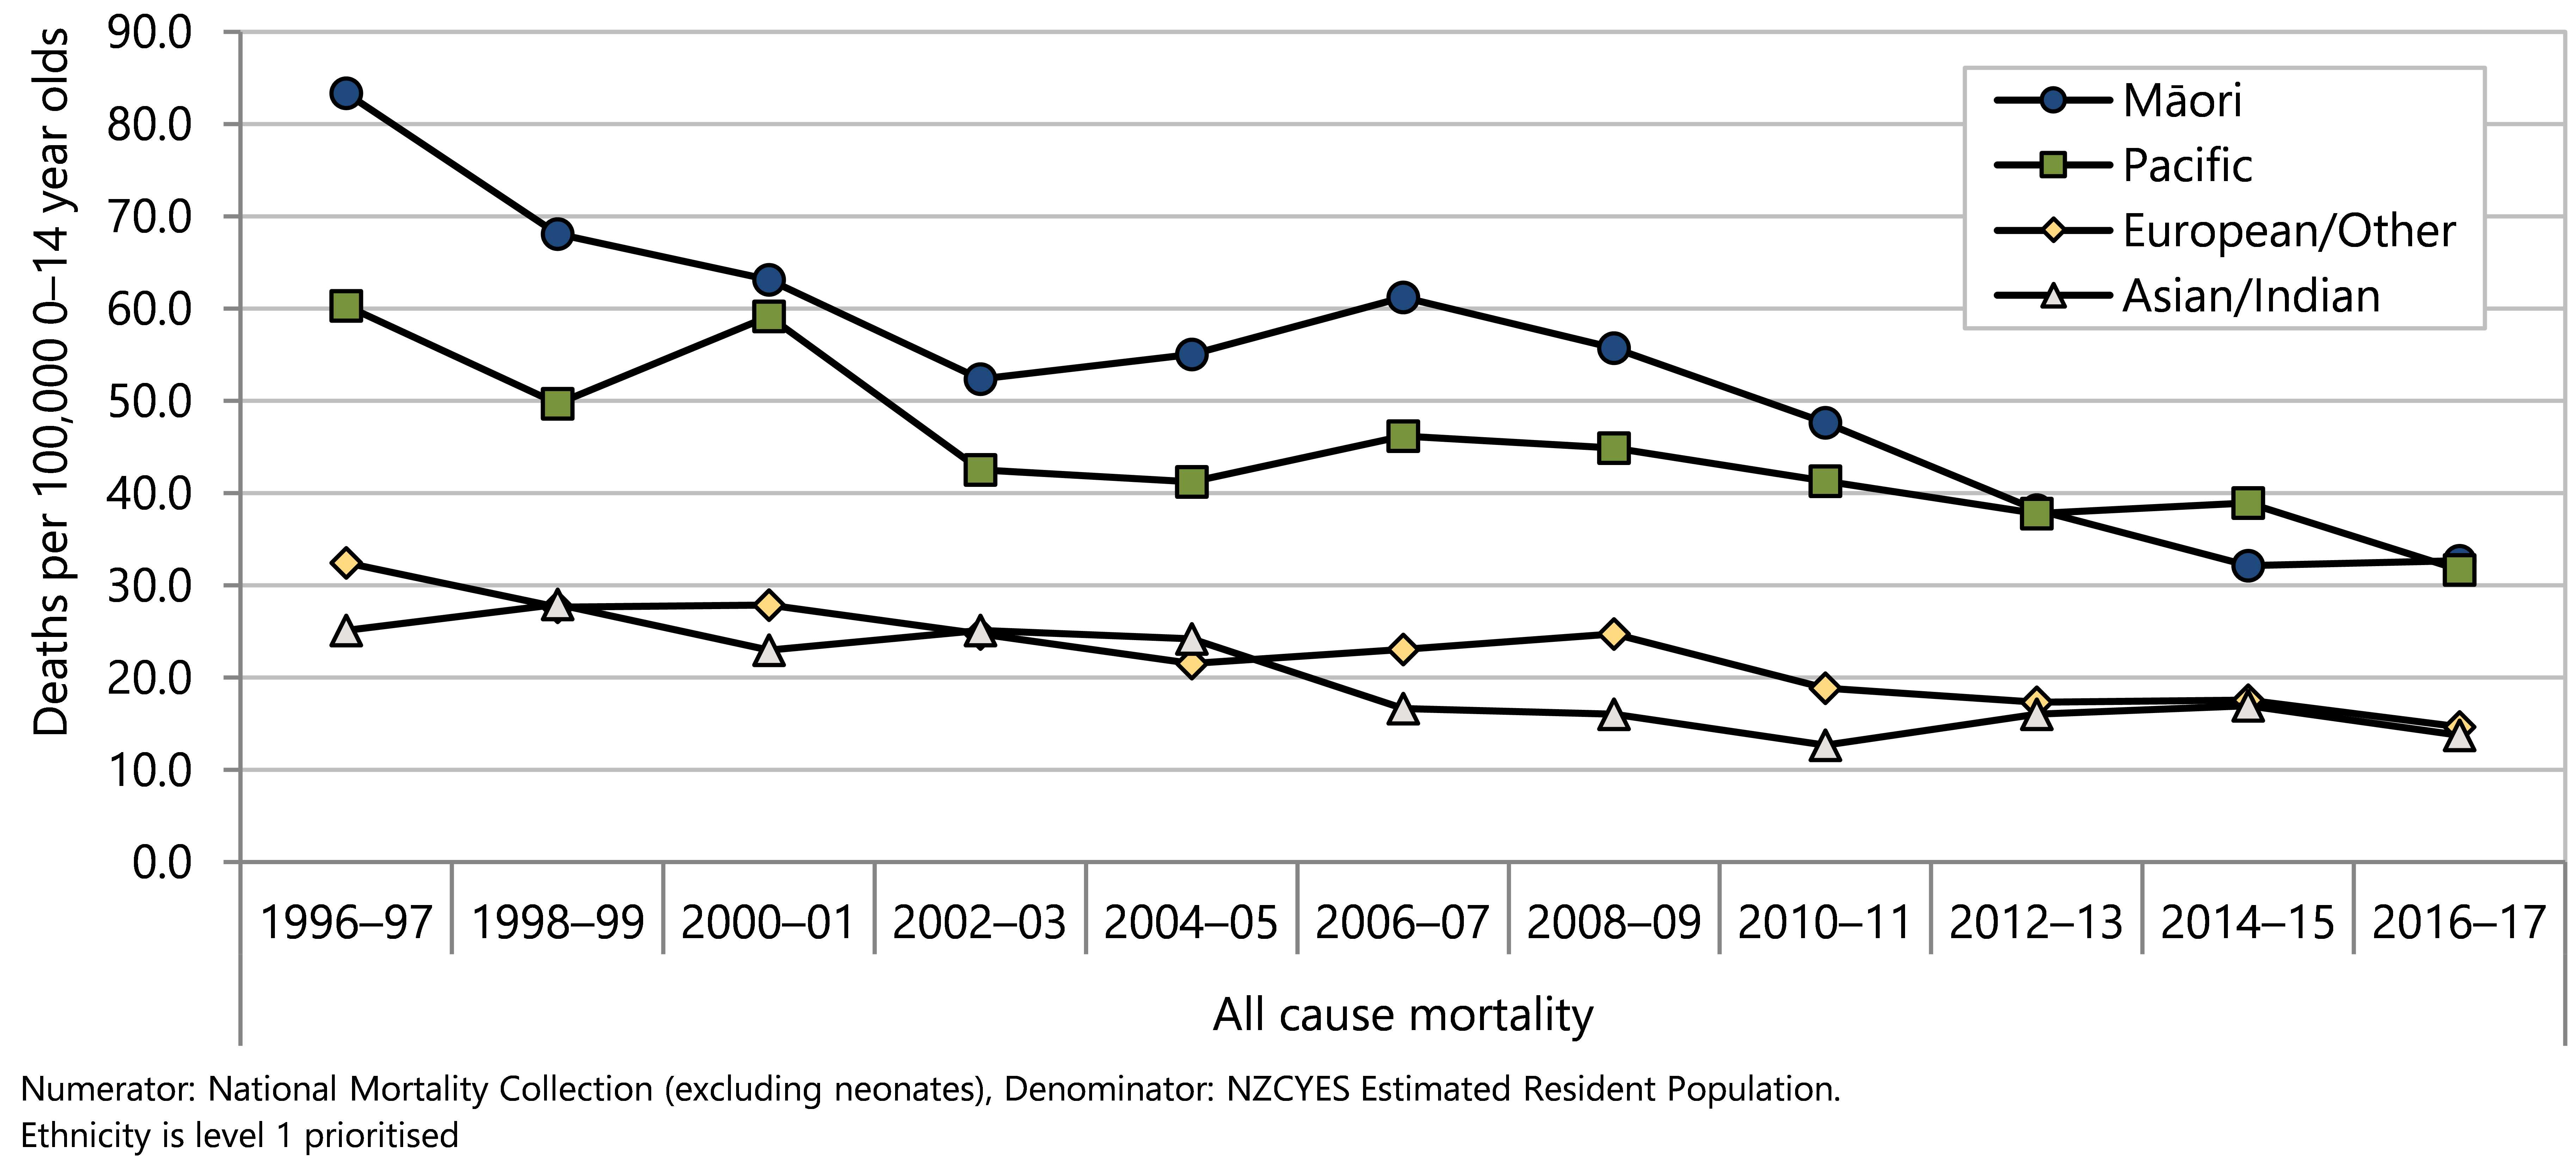
Infant deaths
Infant mortality rates in most high-income countries, as in New Zealand, are lower than 10 infant deaths per thousand live births.65 Differences in infant survival within high-income countries reflect commitment and capacity to provide the services needed to protect, equitably, all parents and infants through pregnancy, birth, and the child’s earliest days.65
The infant mortality rate in New Zealand is higher than that in several other OECD countries (Figure 47).66 Some of the international variation in infant mortality rates is due to variations among countries in registering practices for premature infants. In Europe, several countries apply a minimum gestational age of 22 weeks (or a birth weight threshold of 500g) for babies to be registered as live births and thus infant mortality rates may be lower than in countries like the United States and Canada who register a higher proportion of babies weighing less than 500g, with low odds of survival, resulting in higher reported infant mortality.66 In Aotearoa a live birth is defined as “the complete expulsion or extraction from its mother of a product of conception, irrespective of the duration of the pregnancy” where there is any evidence of life …”.67
Figure 47 . Deaths of children aged under one year, per 1,000 live births, OECD 2018
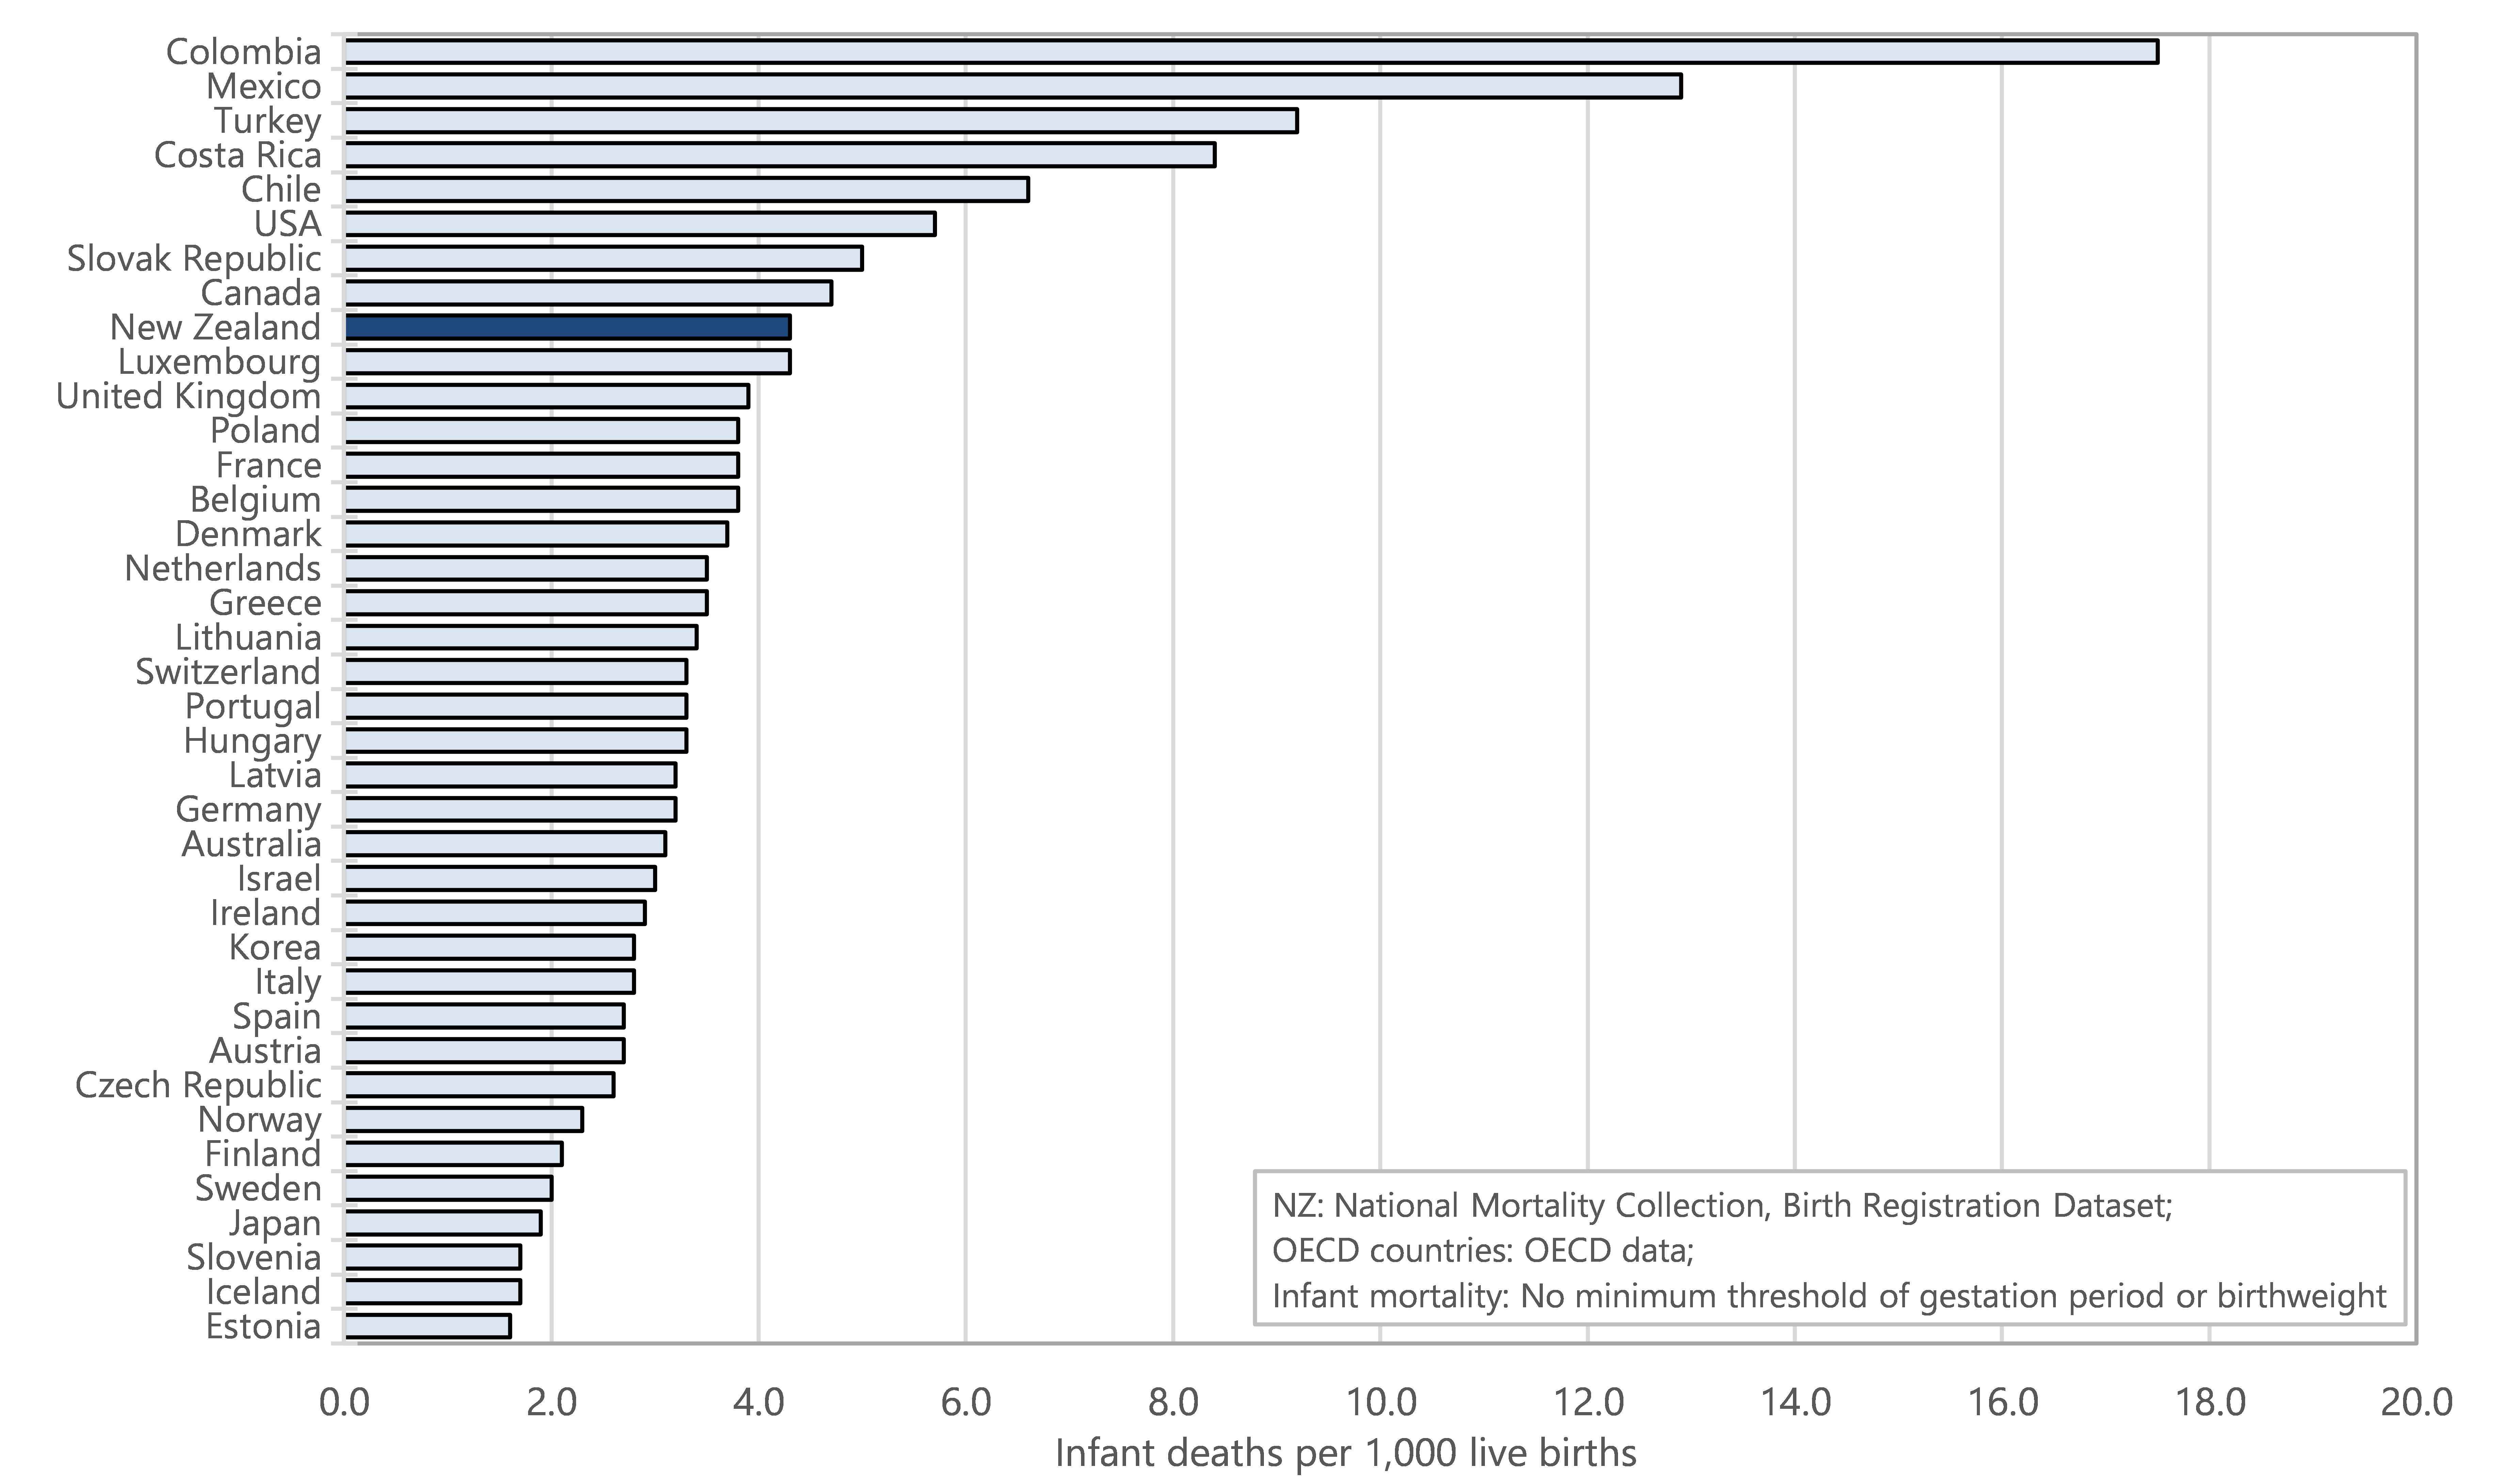
This section reviews infant deaths, including sudden unexpected death in infancy (SUDI), using information from the National Mortality Collection and the Birth Registration Dataset.
Data sources and methods
Indicators
Infant mortality rate
Sudden Unexpected Death in Infancy (SUDI) rates
Data sources
Numerator: National Mortality Collection
Denominator : Birth Registration Dataset (live births only)
Other countries: OECD (via OECD data)
Definitions
Infant death : Death of a liveborn infant prior to 365 days of life.
Infant mortality rate : Death of a liveborn infant prior to 365 days of life per 1,000 live births
Sudden unexpected death in infancy (SUDI) : Death of a liveborn infant prior to 365 days of life, where the cause of death was sudden infant death syndrome (SIDS), accidental suffocation or strangulation in bed, inhalation of gastric contents or food, or ill-defined or unspecified causes
SUDI rate : SUDI per 1,000 live births
SIDS : Refers to refer to the sudden, unexpected death in an infant that is unexplained, even after a complete death scene investigation, thorough post-mortem (autopsy) and review of the infant’s clinical history.
Additional information
Cause of death is the main underlying cause of death. Refer to Appendix 1 for relevant codes.
Infant mortality rates fell overall from 1990 to 2018, with most of that decrease occurring during the 1990s followed by a more gradual decline from 2000 to 2007 (Figure 47). Infant mortality rates in 2018 were lower in all ethnic groups in 2018 compared with 1996-97 (Figure 48). There has been persistent inequity in mortality rates during this time period, with mortality rates for European/Other infants lower than rates for Māori and Pacific infants in all years except 2018 (Figure 48).
Figure 48 . Infant mortality rates by ethnicity, Aotearoa 1990–2018
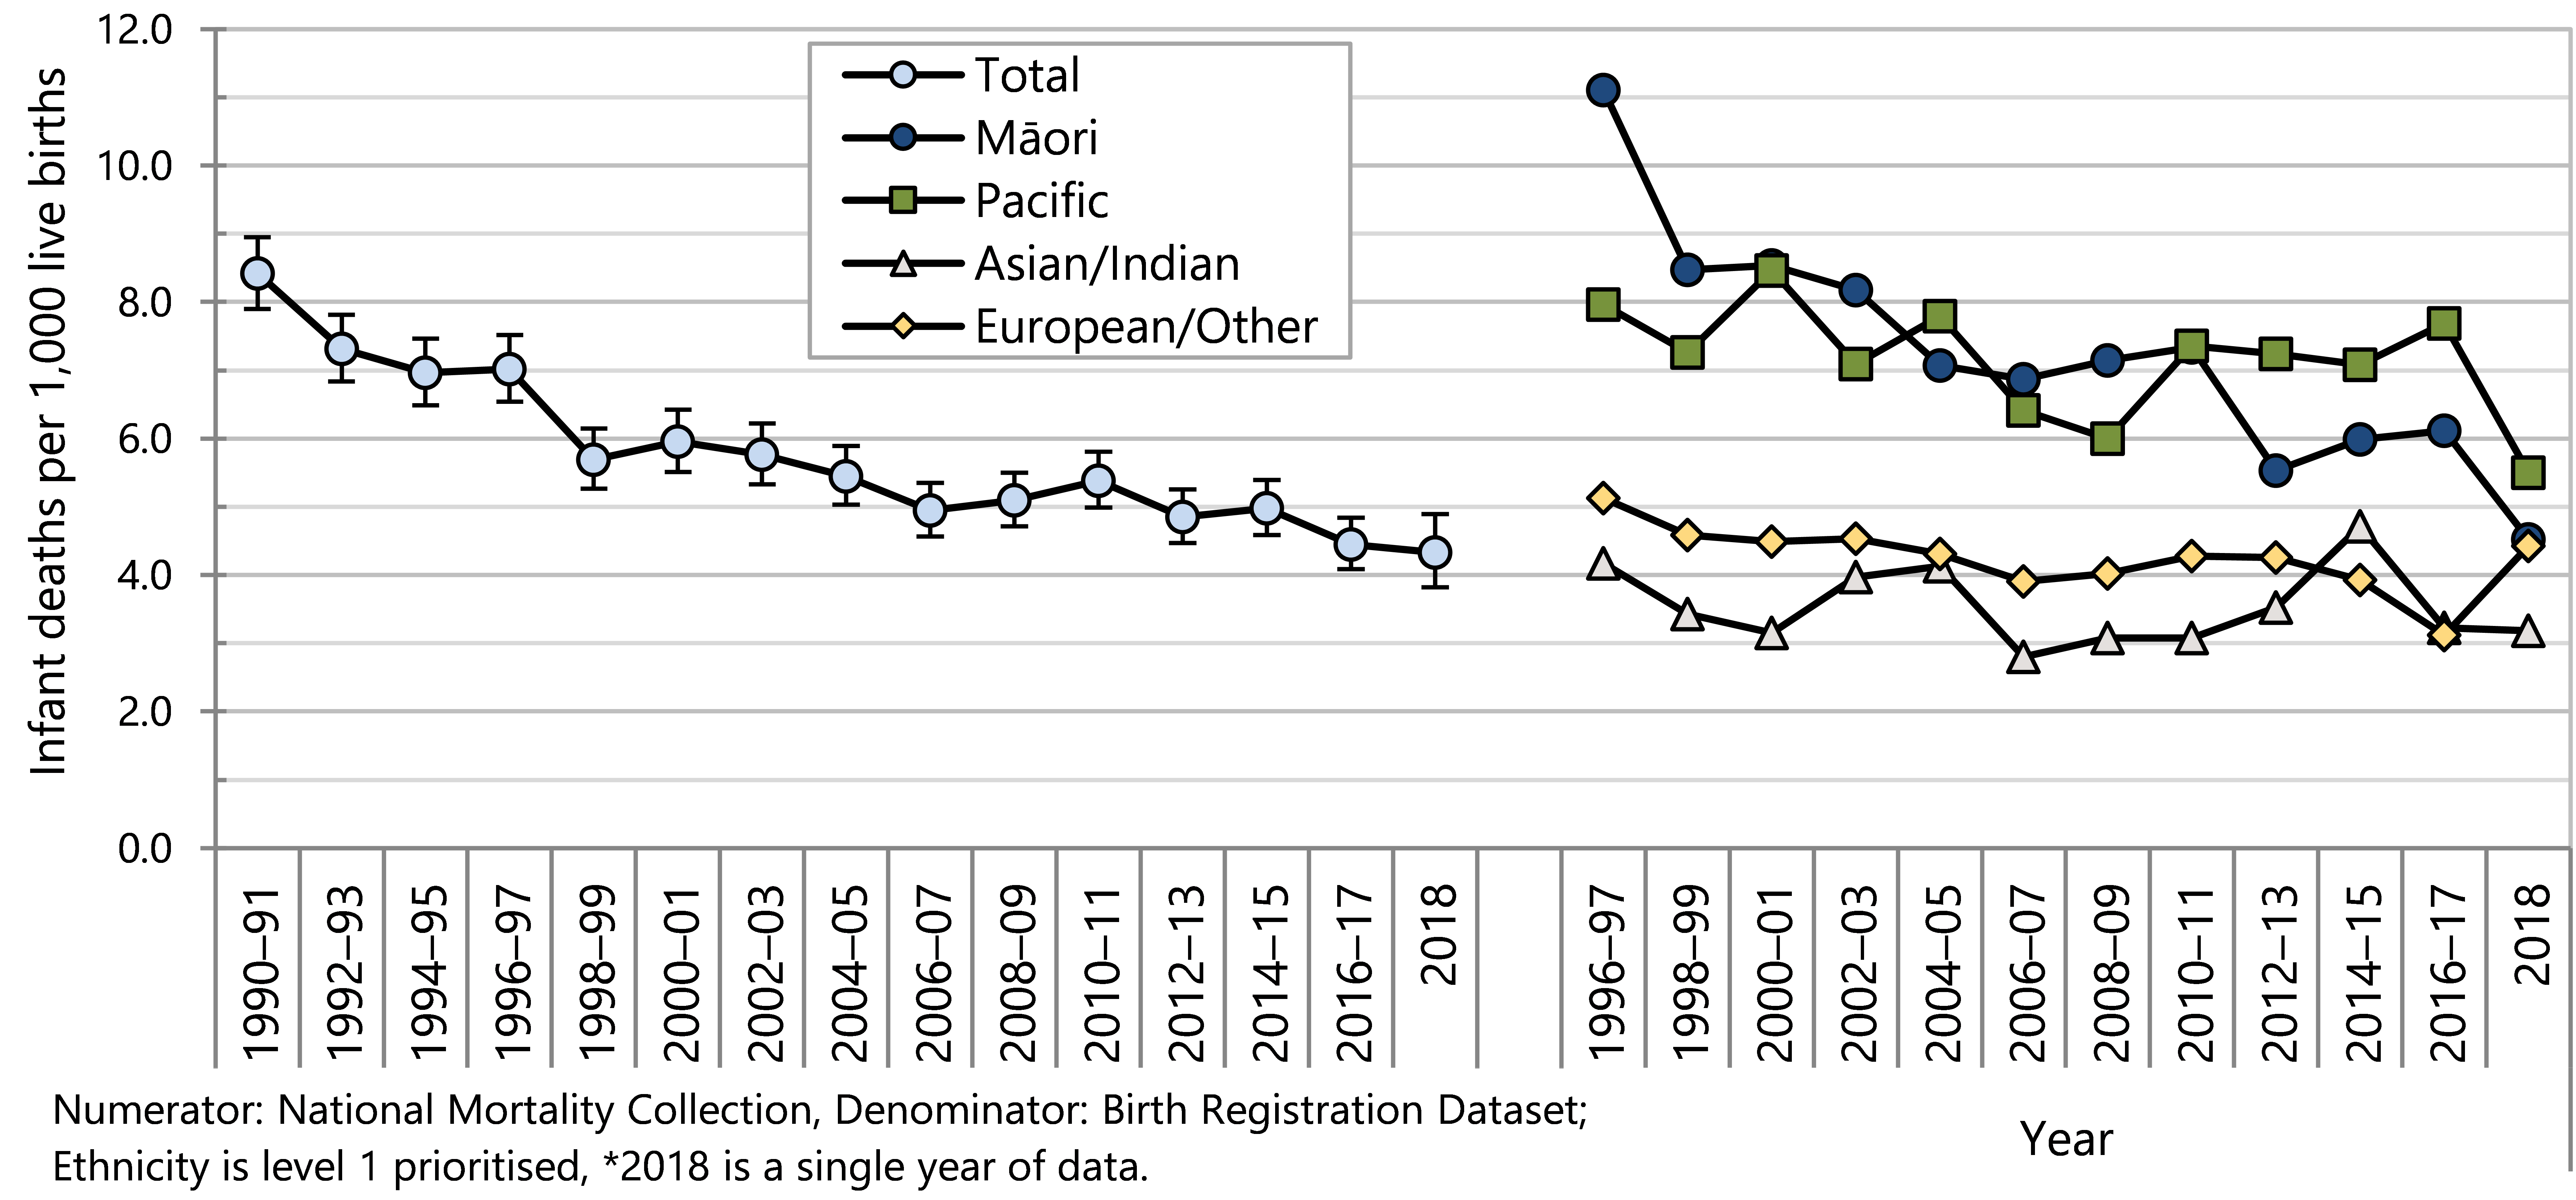
Inequities in infant mortality rates were observed 2014–2018 by ethnicity and neighbourhood socioeconomic deprivation (NZDep2013) as shown in Figure 49 . The mortality rate for infants born in areas with the highest socioeconomic deprivation scores (quintile 5) was more than twice as high as the mortality rate for infants born in areas with the lowest deprivation scores (quintile 1). When compared to European/Other infants, Māori infants experienced a mortality rate that was 1.5 times as high, and Pacific infants experienced a mortality rate twice as high. Infant mortality rates were higher for infants born to birthing parents aged under 25 years compared with older birthing parents. The highest infant mortality rates were observed for infants born at less than 37 weeks gestation.
Figure 49 . Infant mortality, comparison by demographic factors, Aotearoa 2014–2018
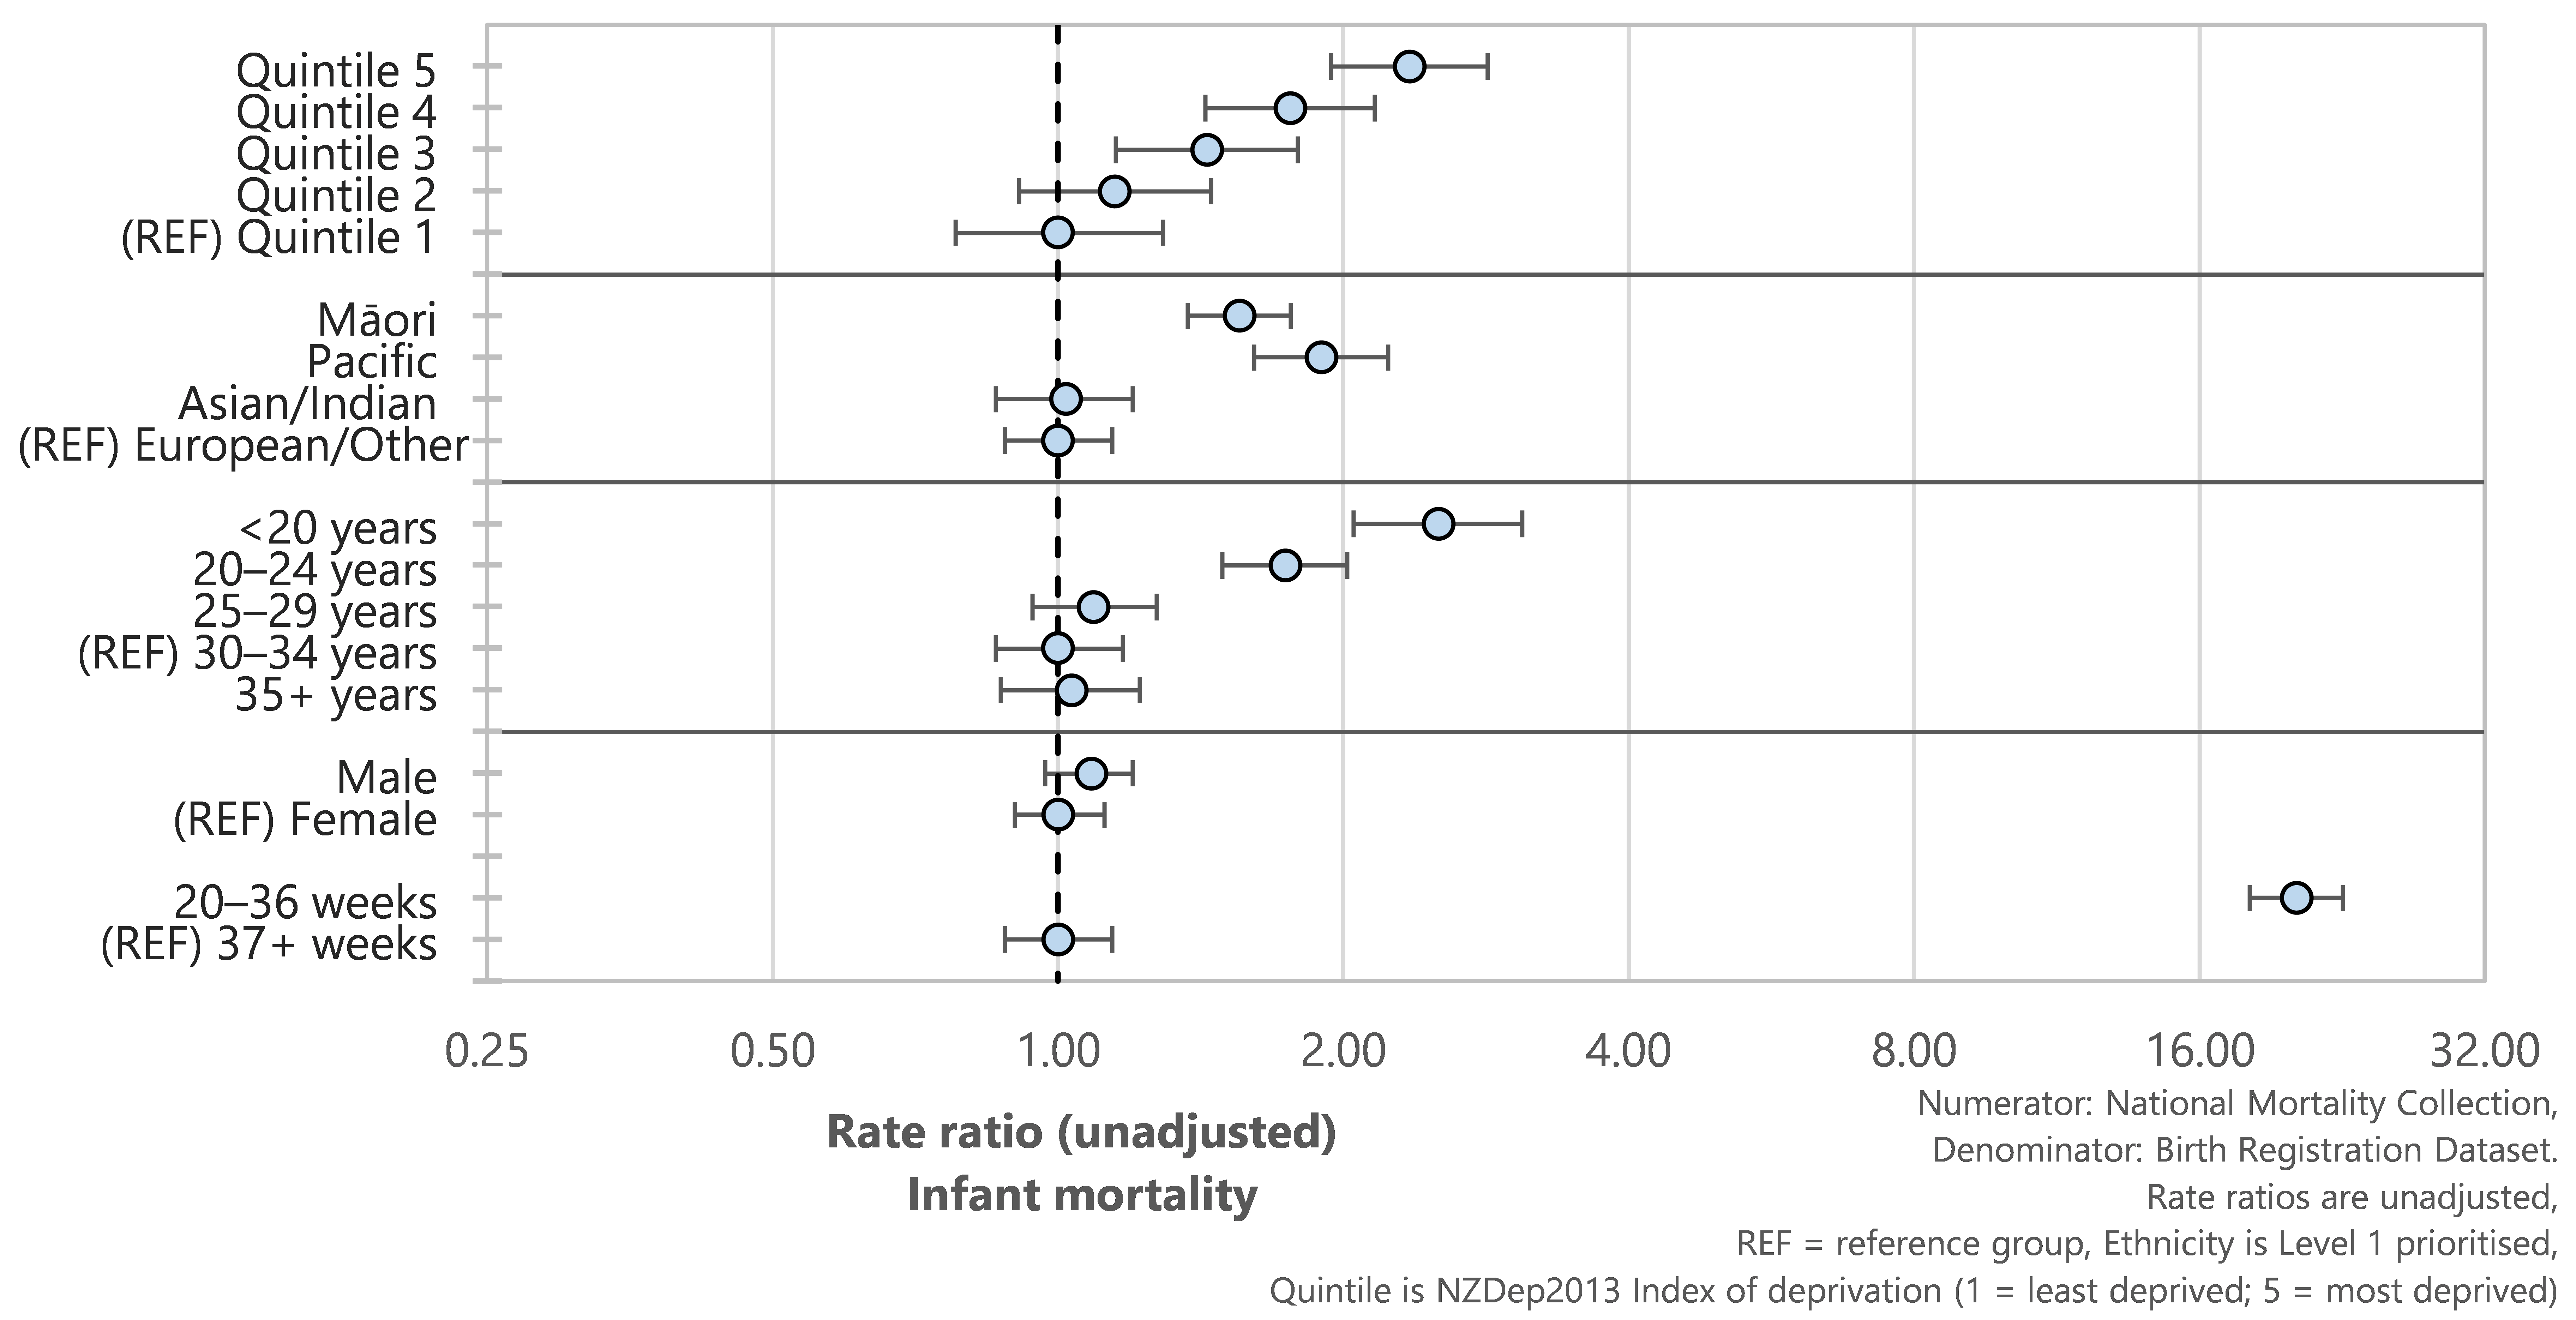
Overall the most common causes of infant deaths were congenital anomalies, extreme prematurity and other perinatal conditions (Table 5). Infant deaths that occurred in the first month of life commonly resulted from these congenital anomalies and perinatal conditions. Sudden unexpected death in infancy (SUDI), most commonly as a result of suffocation in bed or sudden infant death syndrome, was the most common cause of death for infants aged from 28 days to one year.
Table 5 . Infant mortality by main underlying cause of death, Aotearoa 2014–2018
| Cause of death | 2014–2018 (n) | Annual average (n) | Rate per 1,000 live births | % |
| New Zealand | ||||
| Infant mortality | ||||
| Congenital anomalies | 307 | 61 | 1.02 | 22.1 |
| Extreme prematurity | 307 | 61 | 1.02 | 22.1 |
| Other perinatal conditions | 406 | 81 | 1.35 | 29.2 |
| SUDI: SIDS | 99 | 20 | 0.33 | 7.1 |
| SUDI: suffocation or strangulation in bed | 103 | 21 | 0.34 | 7.4 |
| SUDI: all other types | 12 | 2 | 0.04 | 0.9 |
| Injury or poisoning | 30 | 6 | 0.10 | 2.2 |
| Intrauterine hypoxia or birth asphyxia | 10 | 2 | 0.03 | 0.7 |
| Other causes | 118 | 24 | 0.39 | 8.5 |
| Total | 1,392 | 278 | 4.64 | 100.0 |
|
Numerator: National Mortality Collection, Denominator: Birth Registration Dataset; | ||||
Sudden unexpected death in infancy
Sudden unexpected death in infancy (SUDI) is the leading cause of death for infants in Aotearoa aged from 28–364 days and usually occurs in otherwise healthy infants. 68
The rate of SUDI in Aotearoa has significantly decreased since 1990 (Figure 50). Some of this decrease has been attributed to initiatives that occurred during the 1990s designed to make health messages more accessible (for example about appropriate sleeping positions for babies).68
The rate of SUDI for Māori infants has decreased significantly since 1996. The SUDI rate for Pacific infants has fluctuated from year to year (Figure 50). Persistent avoidable inequities remain for Māori and Pacific infants, with consistently higher SUDI rates compared to their European/Other peers (Figure 50).
Figure 50. Sudden unexpected death in infancy (SUDI) by ethnicity, Aotearoa 1990–2018
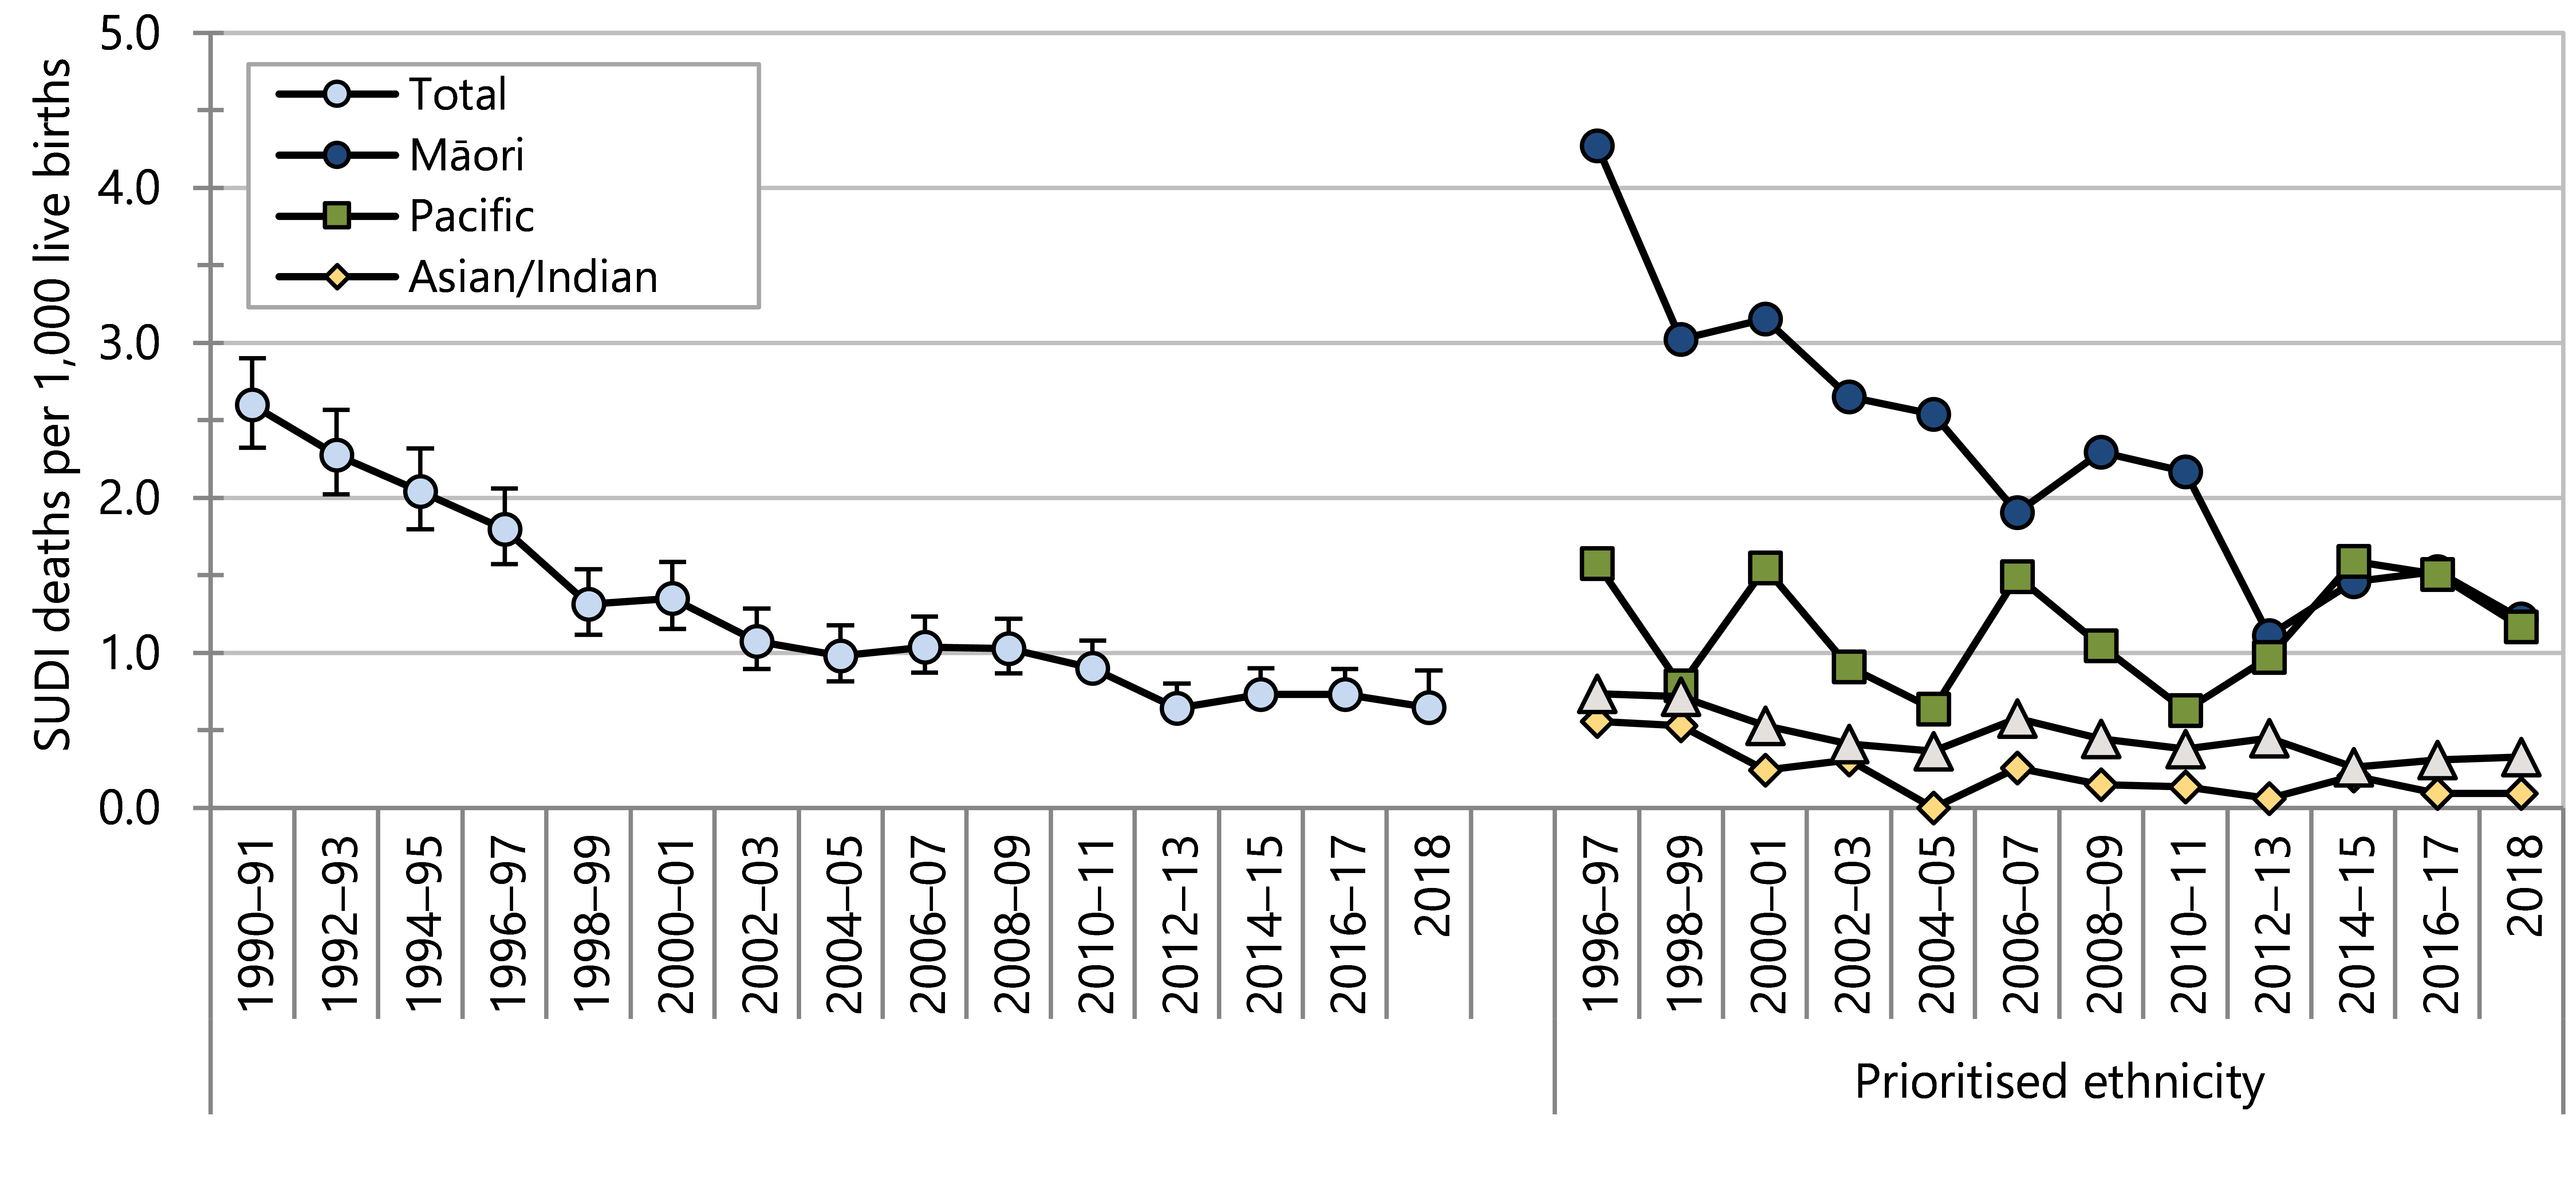
During 2014–2018, SUDI was experienced inequitably according to neighbourhood socioeconomic deprivation (NZDep2013) and ethnicity ( Figure 51). The SUDI rate for infants born in areas with the highest socioeconomic deprivation scores (quintile 5) was almost eight times as high as the SUDI rate for infants born in areas with the lowest deprivation scores (quintile 1). Māori and Pacific infants experienced SUDI rates around five times as high as the rates for European/other infants. The SUDI rate for infants born to mothers aged under 20 years was almost six times as high as the rate for infants born to mothers aged 30 years or older, while for those born to mothers aged 20–25 years it was four times as high. The SUDI rate for infants born before 37 weeks gestation was almost three times as high as the SUDI rate for infants born at or after 37 weeks gestation.
Figure 51. Sudden unexpected death in infancy, comparison by demographic factor, Aotearoa 2014–2018
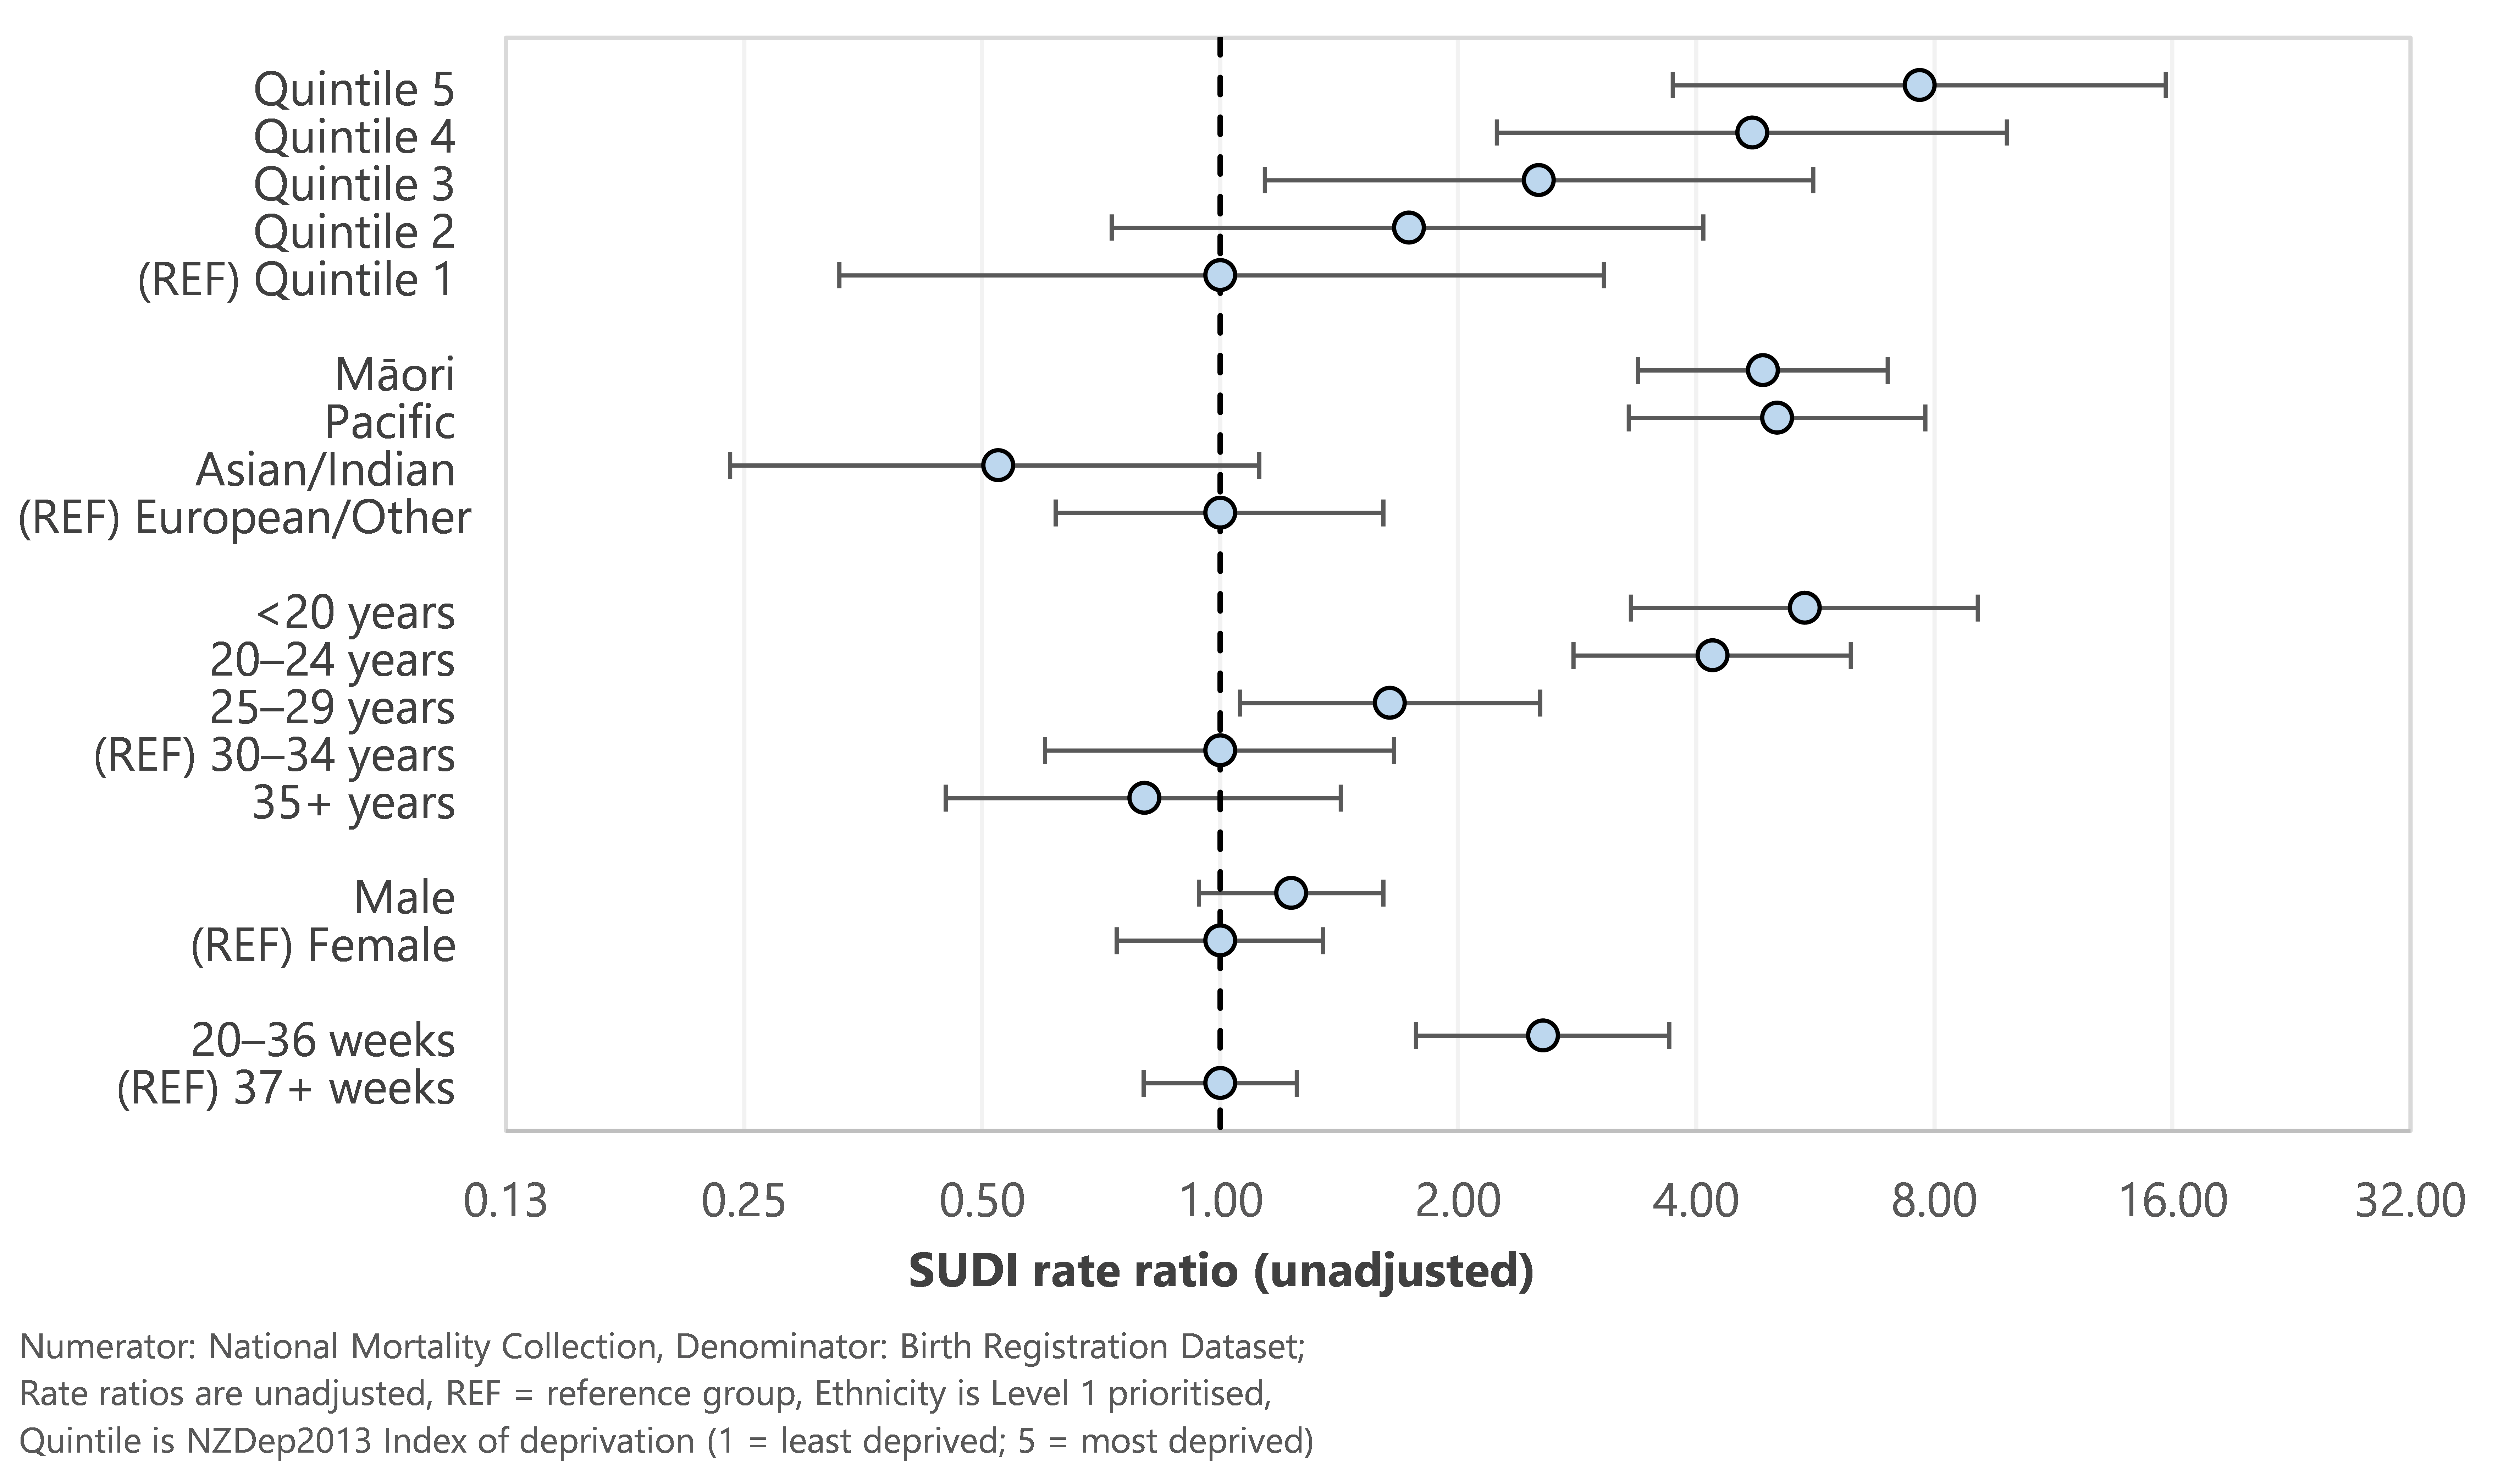
Potentially avoidable hospitalisations
Potentially avoidable hospitalisations (PAH) has been developed as an indicator of health-related outcomes69 relevant to the Child and Youth Wellbeing Strategy70 and the Child Poverty Reduction Act 2018.7 Hospitalisations for these health conditions can potentially be avoided by actions within health services (e.g. early detection and appropriate management of health problems in the community), public health activities that improve and promote health of the population (e.g. immunisation, injury prevention, and social policy actions that address factors such as adequate incomes and healthy housing.69
The two main categories of PAH are hospitalisations for medical conditions including vaccine preventable diseases, and hospitalisations for injuries.
Indicator
Potentially avoidable hospitalisations of children aged 0–14 years
Data sources
Numerator(s): National Minimum Dataset (NMDS)
Denominator : NZCYES Estimated Resident Population (with intercensal extrapolation)
Definitions
Hospitalisations of 0–14 year olds with a primary diagnosis included in the Child and Youth Wellbeing Strategy list of potentially avoidable hospitalisations.
Additional information
Hospitalisations of neonates are excluded.
Medical conditions are acute and arranged.
Injury hospitalisations exclude ED and waiting list cases
Refer to appendices for the codes included in this section
In 2019 around 60,000 hospitalisations of under-15-year-olds in Aotearoa were classified as potentially avoidable. In 2020, this number dropped to around 40,000, with the most marked reduction observed in the number of potentially avoidable hospitalisations (PAH) for medical conditions. This lower rate was associated with closed borders and community-wide public health measures during the initial national response to the COVID-19 pandemic. In 2021, while border restrictions remained in place with some changes to the detail of protective public health measures, the number of PAH increased to over 50,000.
From 2009 to 2019, the medical PAH rate had been stable at around 50–55 hospitalisations per 1,000 under-15-year olds (Figure 52). In 2020, the rate of medical PAH dropped to 35.0 hospitalisations per 1,000 under-15-year-olds and increased to 46.3 hospitalisations per 1,000 under-15-year-olds in 2021 (Figure 52).
There has been a small but steady decline in the rate of potentially avoidable hospitalisations for injury over the past twenty years (Figure 52).
Figure 52. Potentially avoidable hospitalisations, 0–14 year olds, Aotearoa 2000–2021
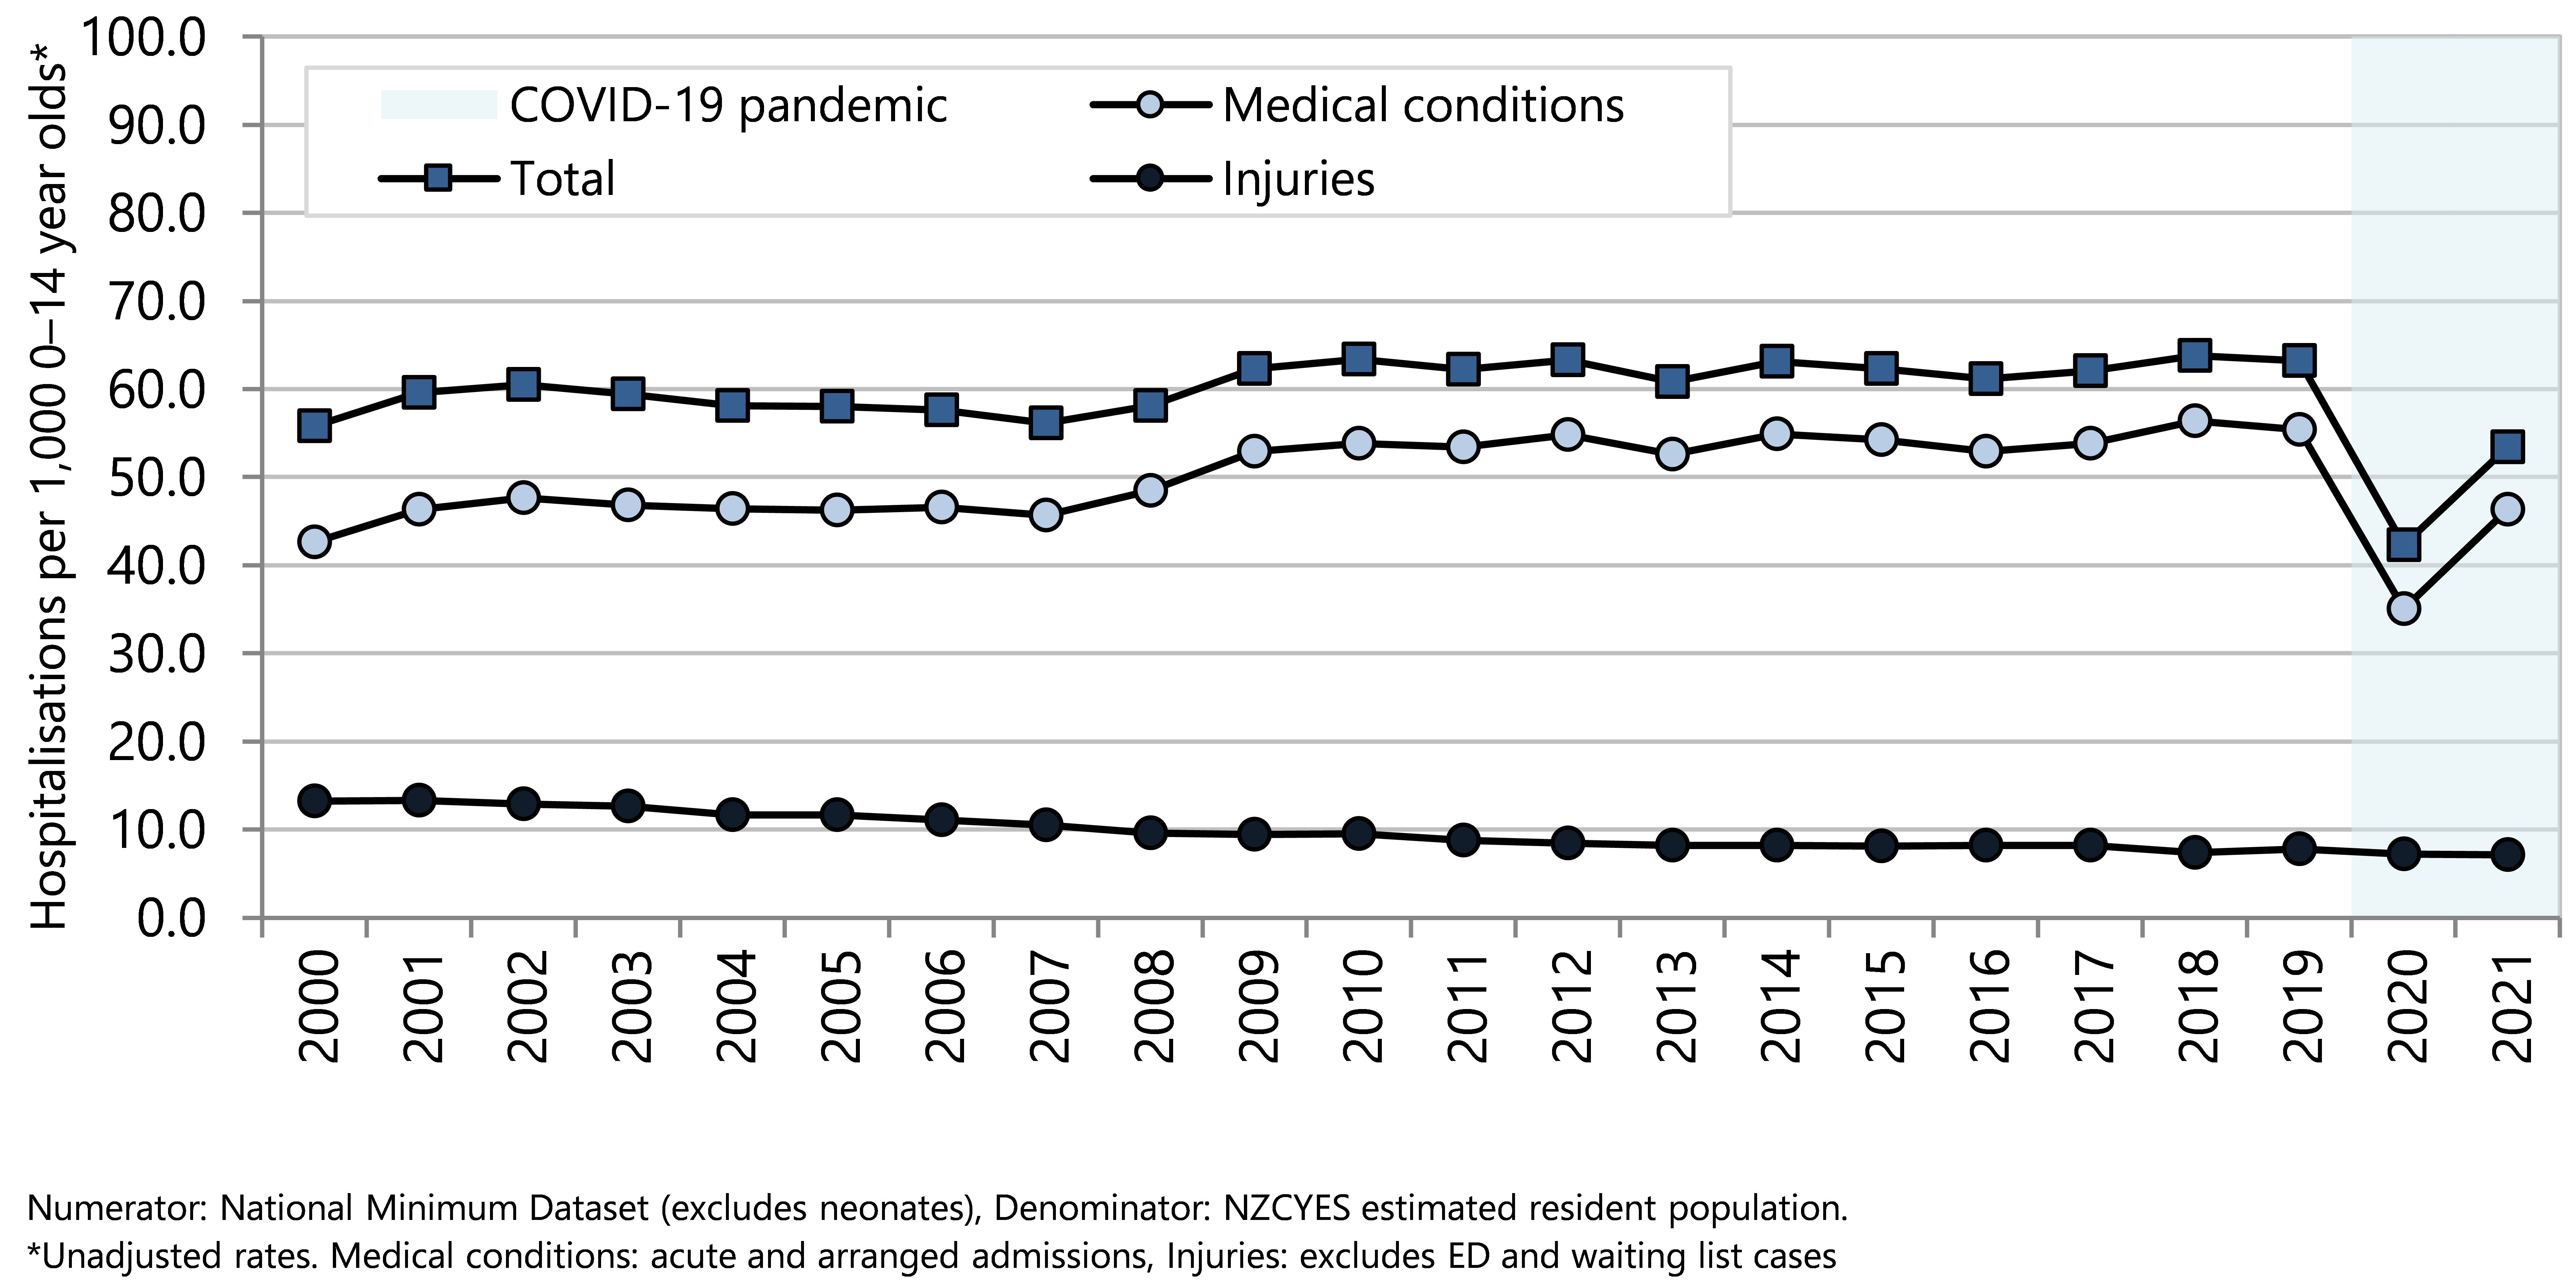
From 2000 to 2018, there was a clear social gradient in PAH rates, with the highest rates for children living in areas with the highest deprivation scores (quintile 5). In 2019, 2020 and 2021, PAH rates in NZDep quintiles 4 and 5 have been similar, and higher than rates in quintiles 1–3. (Figure 53). The overall gap between NZDep quintile 1 and NZDep quintile 5 narrowed abruptly from 37.5 hospitalisations per 1,000 age-specific population in 2019 to 18.1 hospitalisations per 1,000 age-specific population in 2020 and 22.1 in 2021 (Figure 53).
Figure 54 shows that from 2000 to 2021, European children were hospitalised for PAH at a rate lower than the rates for Pacific children, Māori children or Middle Eastern, Latin American and African (MELAA) children. The PAH rate for Asian/Indian children was lower than the rates for other ethnic groups in 2000 but rose to become similar to the rate for European/Other children from 2013. The gap between Pacific and Māori rates compared with European and Asian/Indian rates narrowed in 2020 and increased again in 2021.
Figure 53. Potentially avoidable hospitalisations, 0–14 year olds, by deprivation quintile, Aotearoa 2000–2021
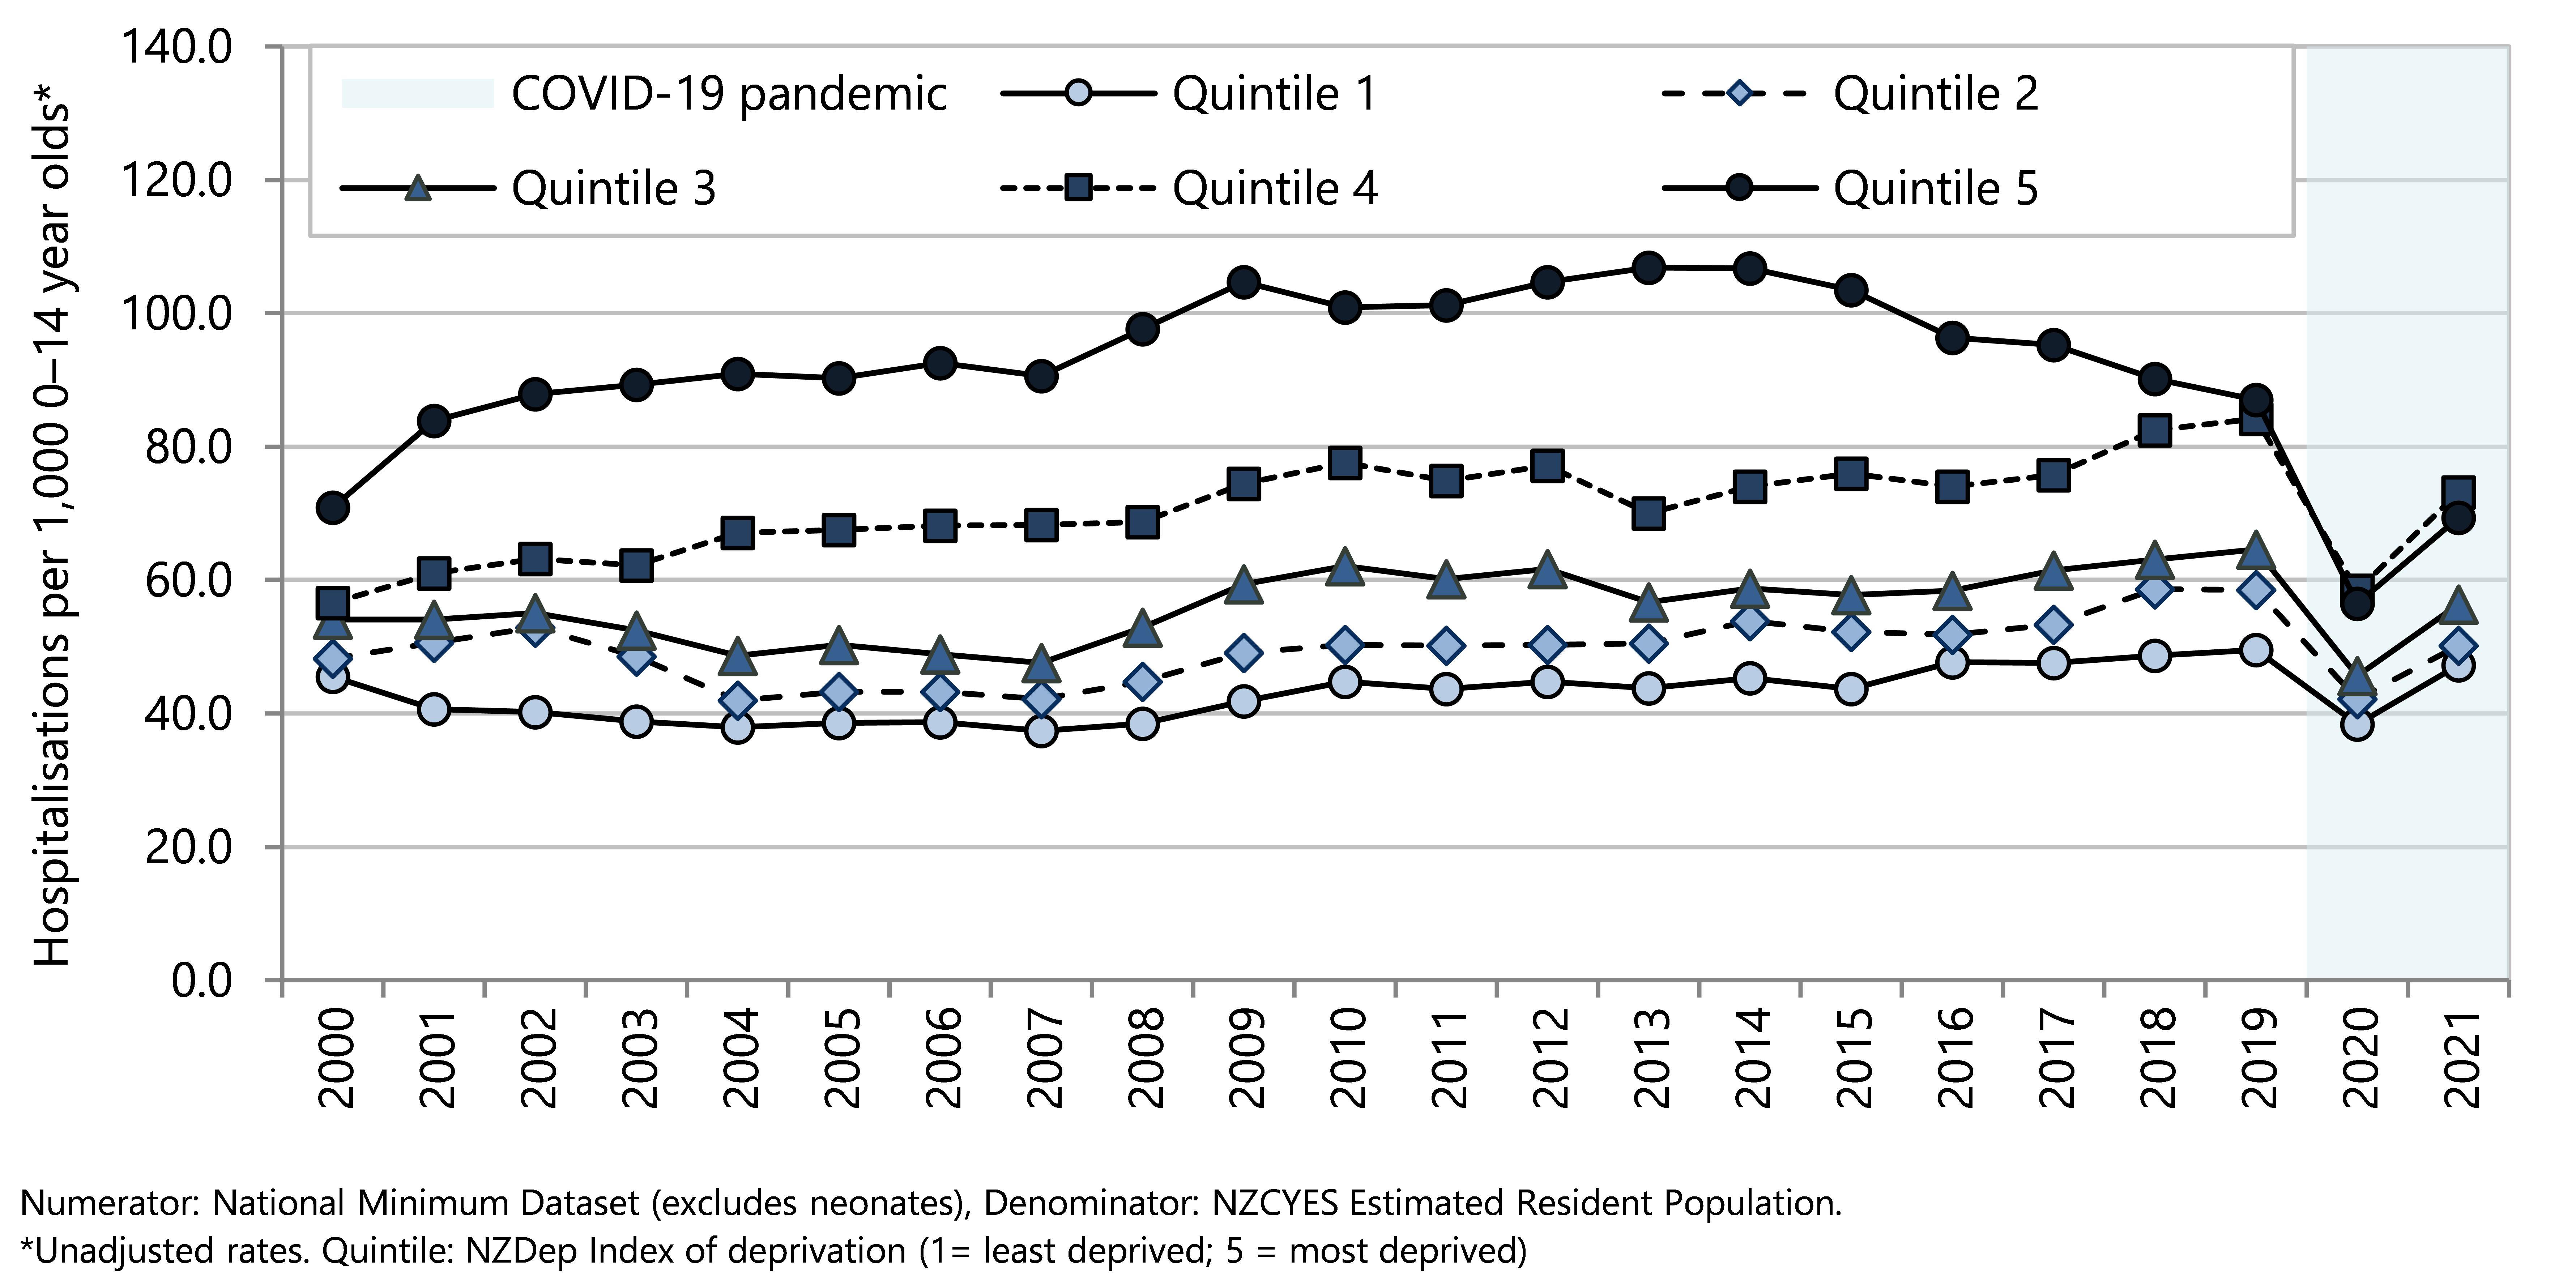
Figure 54. Potentially avoidable hospitalisations, 0-14 year olds, by ethnicity, Aotearoa 2000–2021
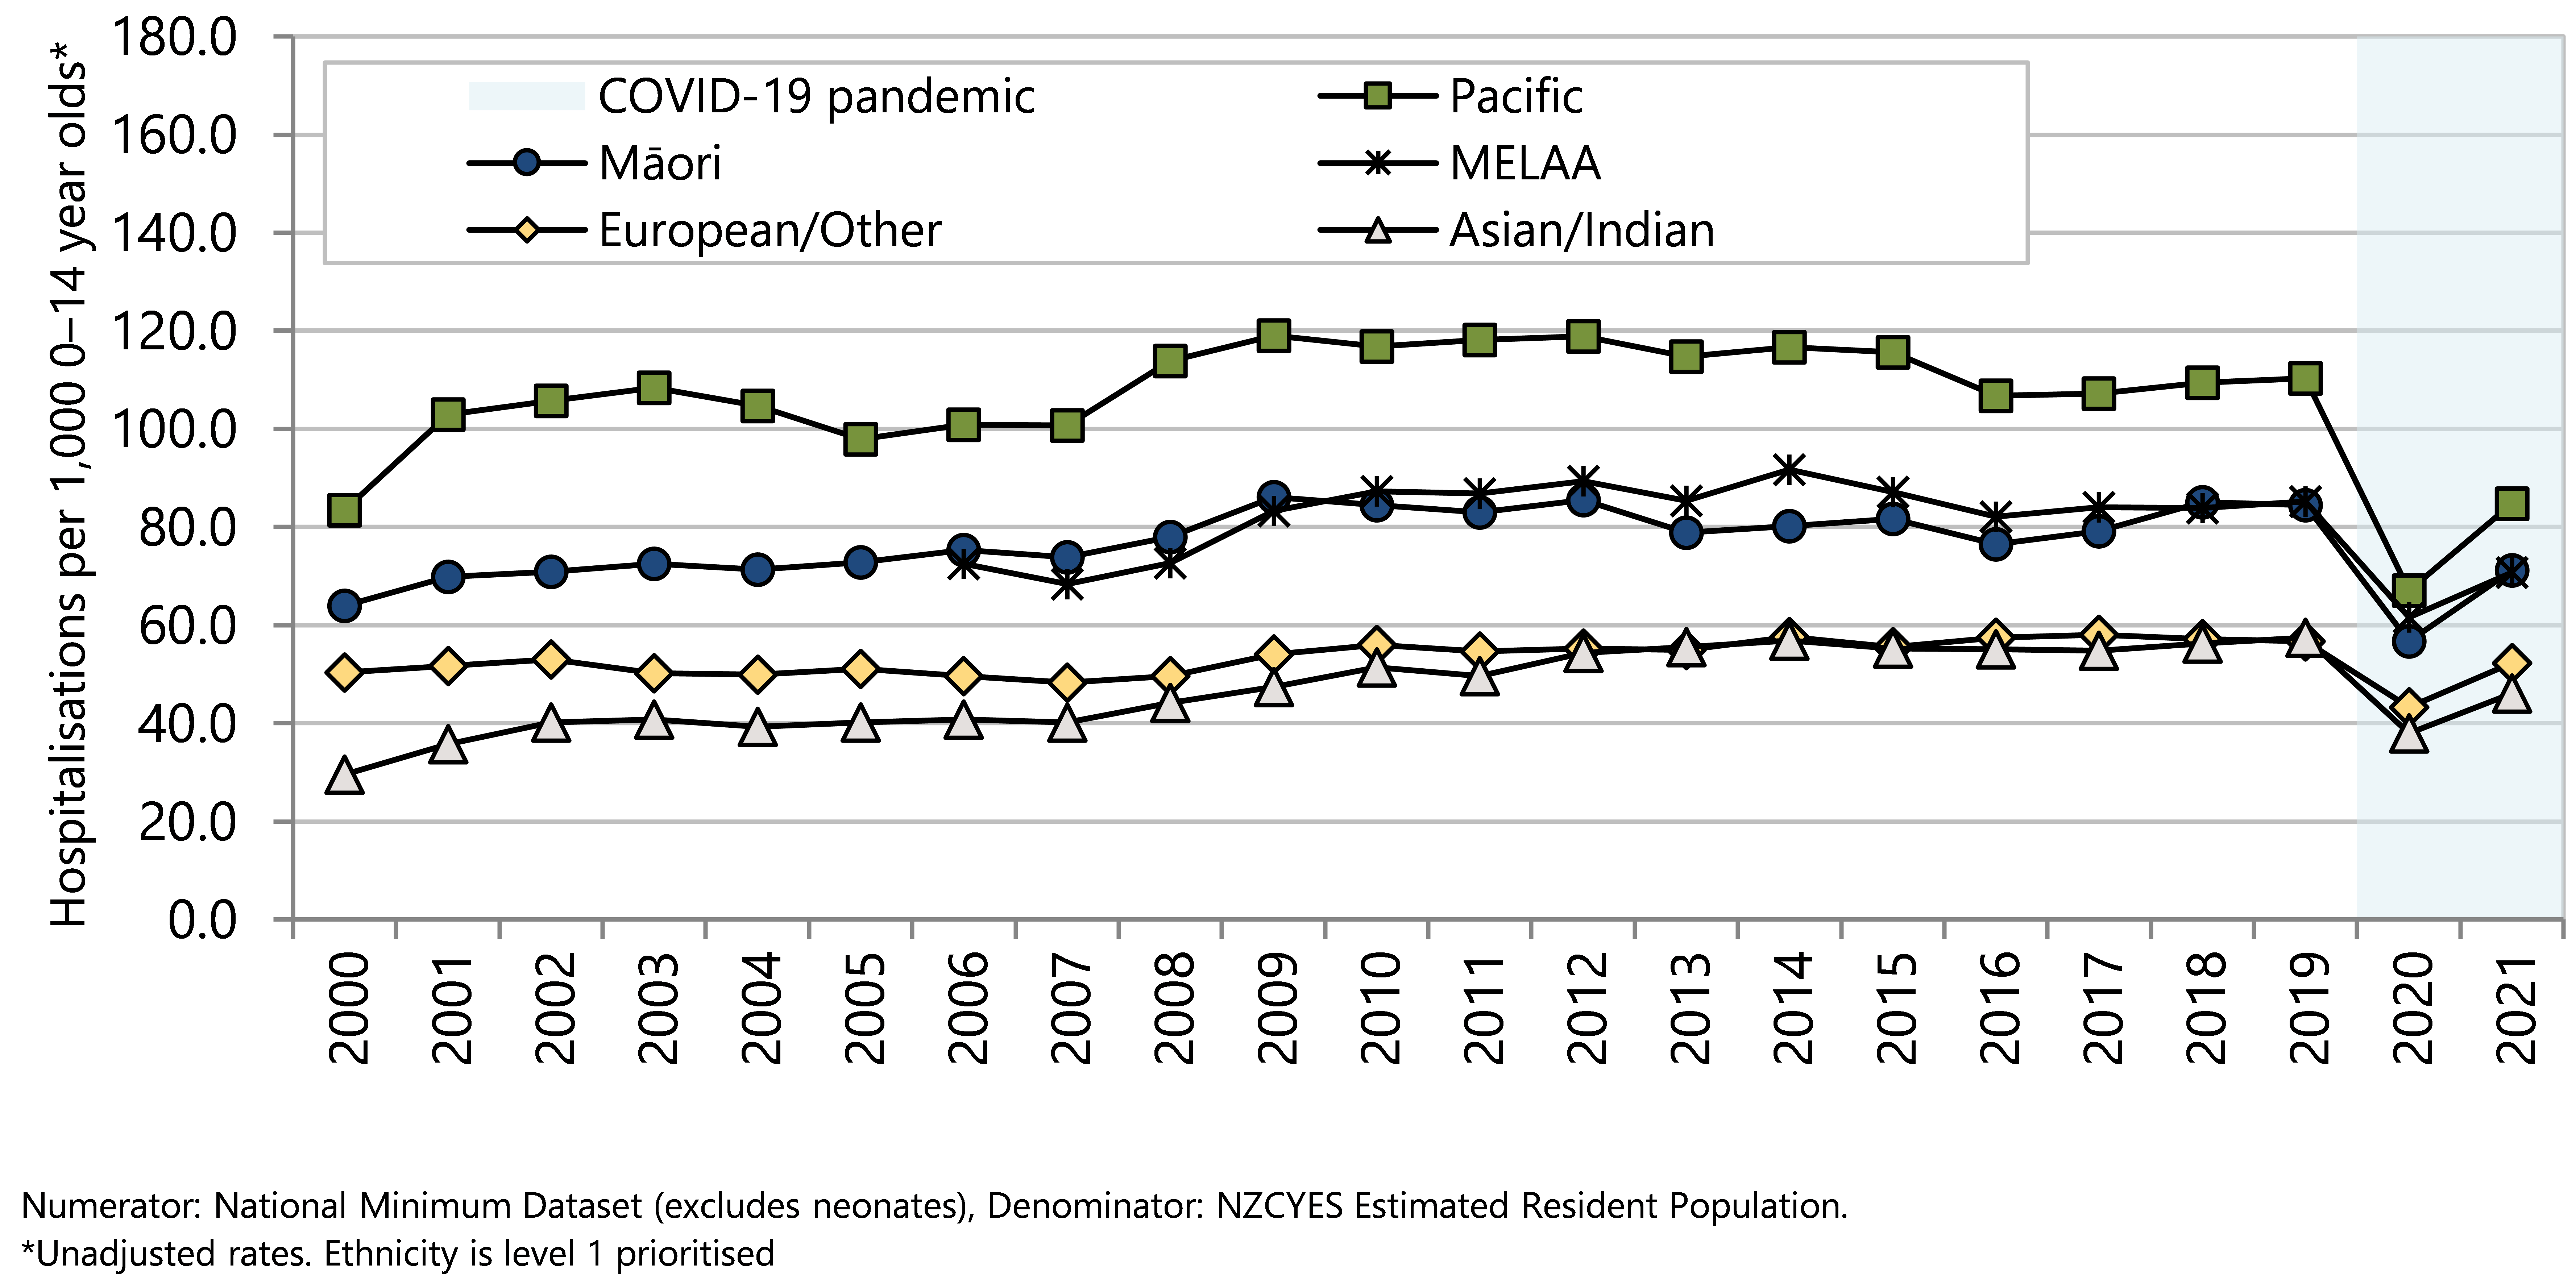
Medical conditions
In the five years from 2017–2021, there were around 235,000 potentially avoidable hospitalisations (PAH) of under-15 year olds for medical conditions, including the subgroup vaccine-preventable diseases. This was an age-specific rate of 49.3 hospitalisations per 1,000 under-15-year-olds.
The age group with the highest hospitalisation rate for medical PAH conditions in children was 0–4 year olds (Figure 55). Within the 0–4 year-old age group, hospitalisation rates for the most common conditions were highest in infants aged less than one year. Among ethnic groups, hospitalisation rates were lowest for European/Other and Asian/Indian children, with higher hospitalisation rates for Māori children and children of Middle Eastern, Latin American and African (MELAA) ethnicity, and the highest rates for Pacific children (Figure 55). Hospitalisation rates for medical conditions were significantly different by NZDep2013 deprivation score, with under-15 year olds living in areas with the highest deprivation scores (quintile 5) experiencing a hospitalisation rate twice as high as those living in areas with the lowest deprivation score (quintile 1) (Figure 55).
This univariate analysis is not able to quantify the independent effect of each demographic factor.
Figure 55 . Potentially avoidable hospitalisations for medical conditions, by demographic factor, 0–14-year-olds Aotearoa 2017–2021
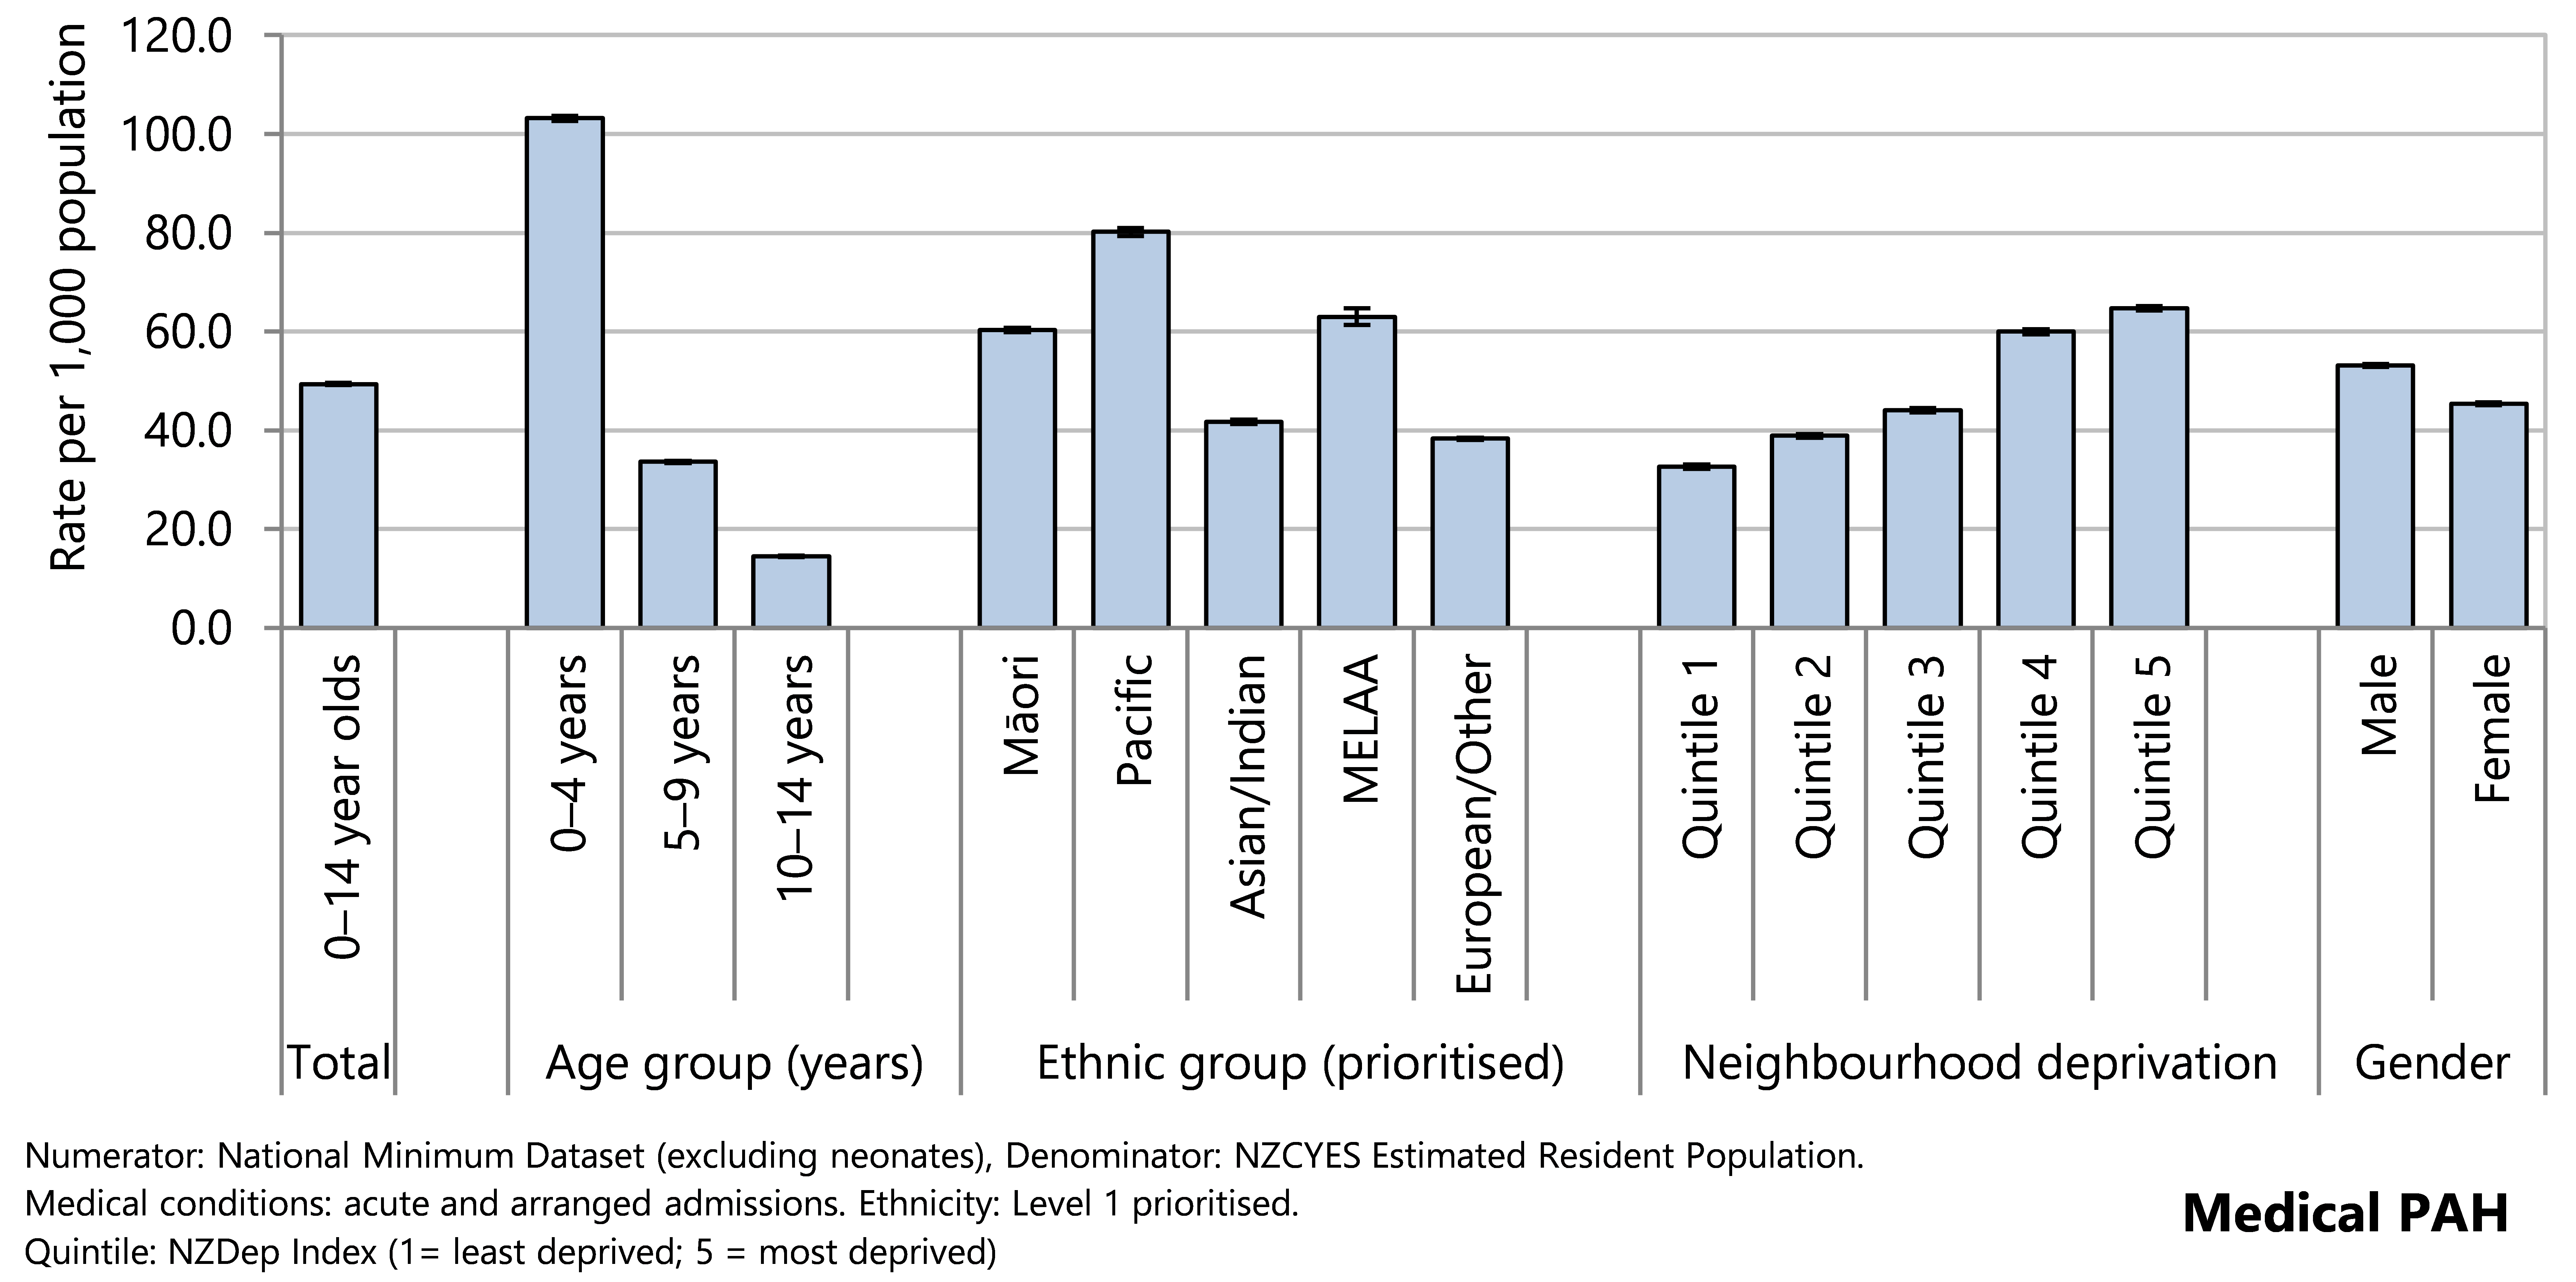
From 2000 to 2019 the PAH rates for children living in areas with the highest deprivation scores (NZDep quintile 5) have consistently been at least twice as high as those of children living in the least deprived quintile (quintile 1). This difference decreased to 1.6–1.7 times as high in 2019 and 2020 (Figure 56).
Inequities by ethnicity persisted from 2000 to 2021 with conditions in society associated with PAH rates for European and Asian children consistently lower than rates for tamariki Māori, Middle Eastern, Latin American, and African children, and Pacific children (Figure 57). Apart from 2020, PAH rates for Pacific children were higher than for all other ethnic groups.
Figure 56 . Potentially avoidable hospitalisations, 0-14 year olds, by deprivation quintile, Aotearoa 2000–2021
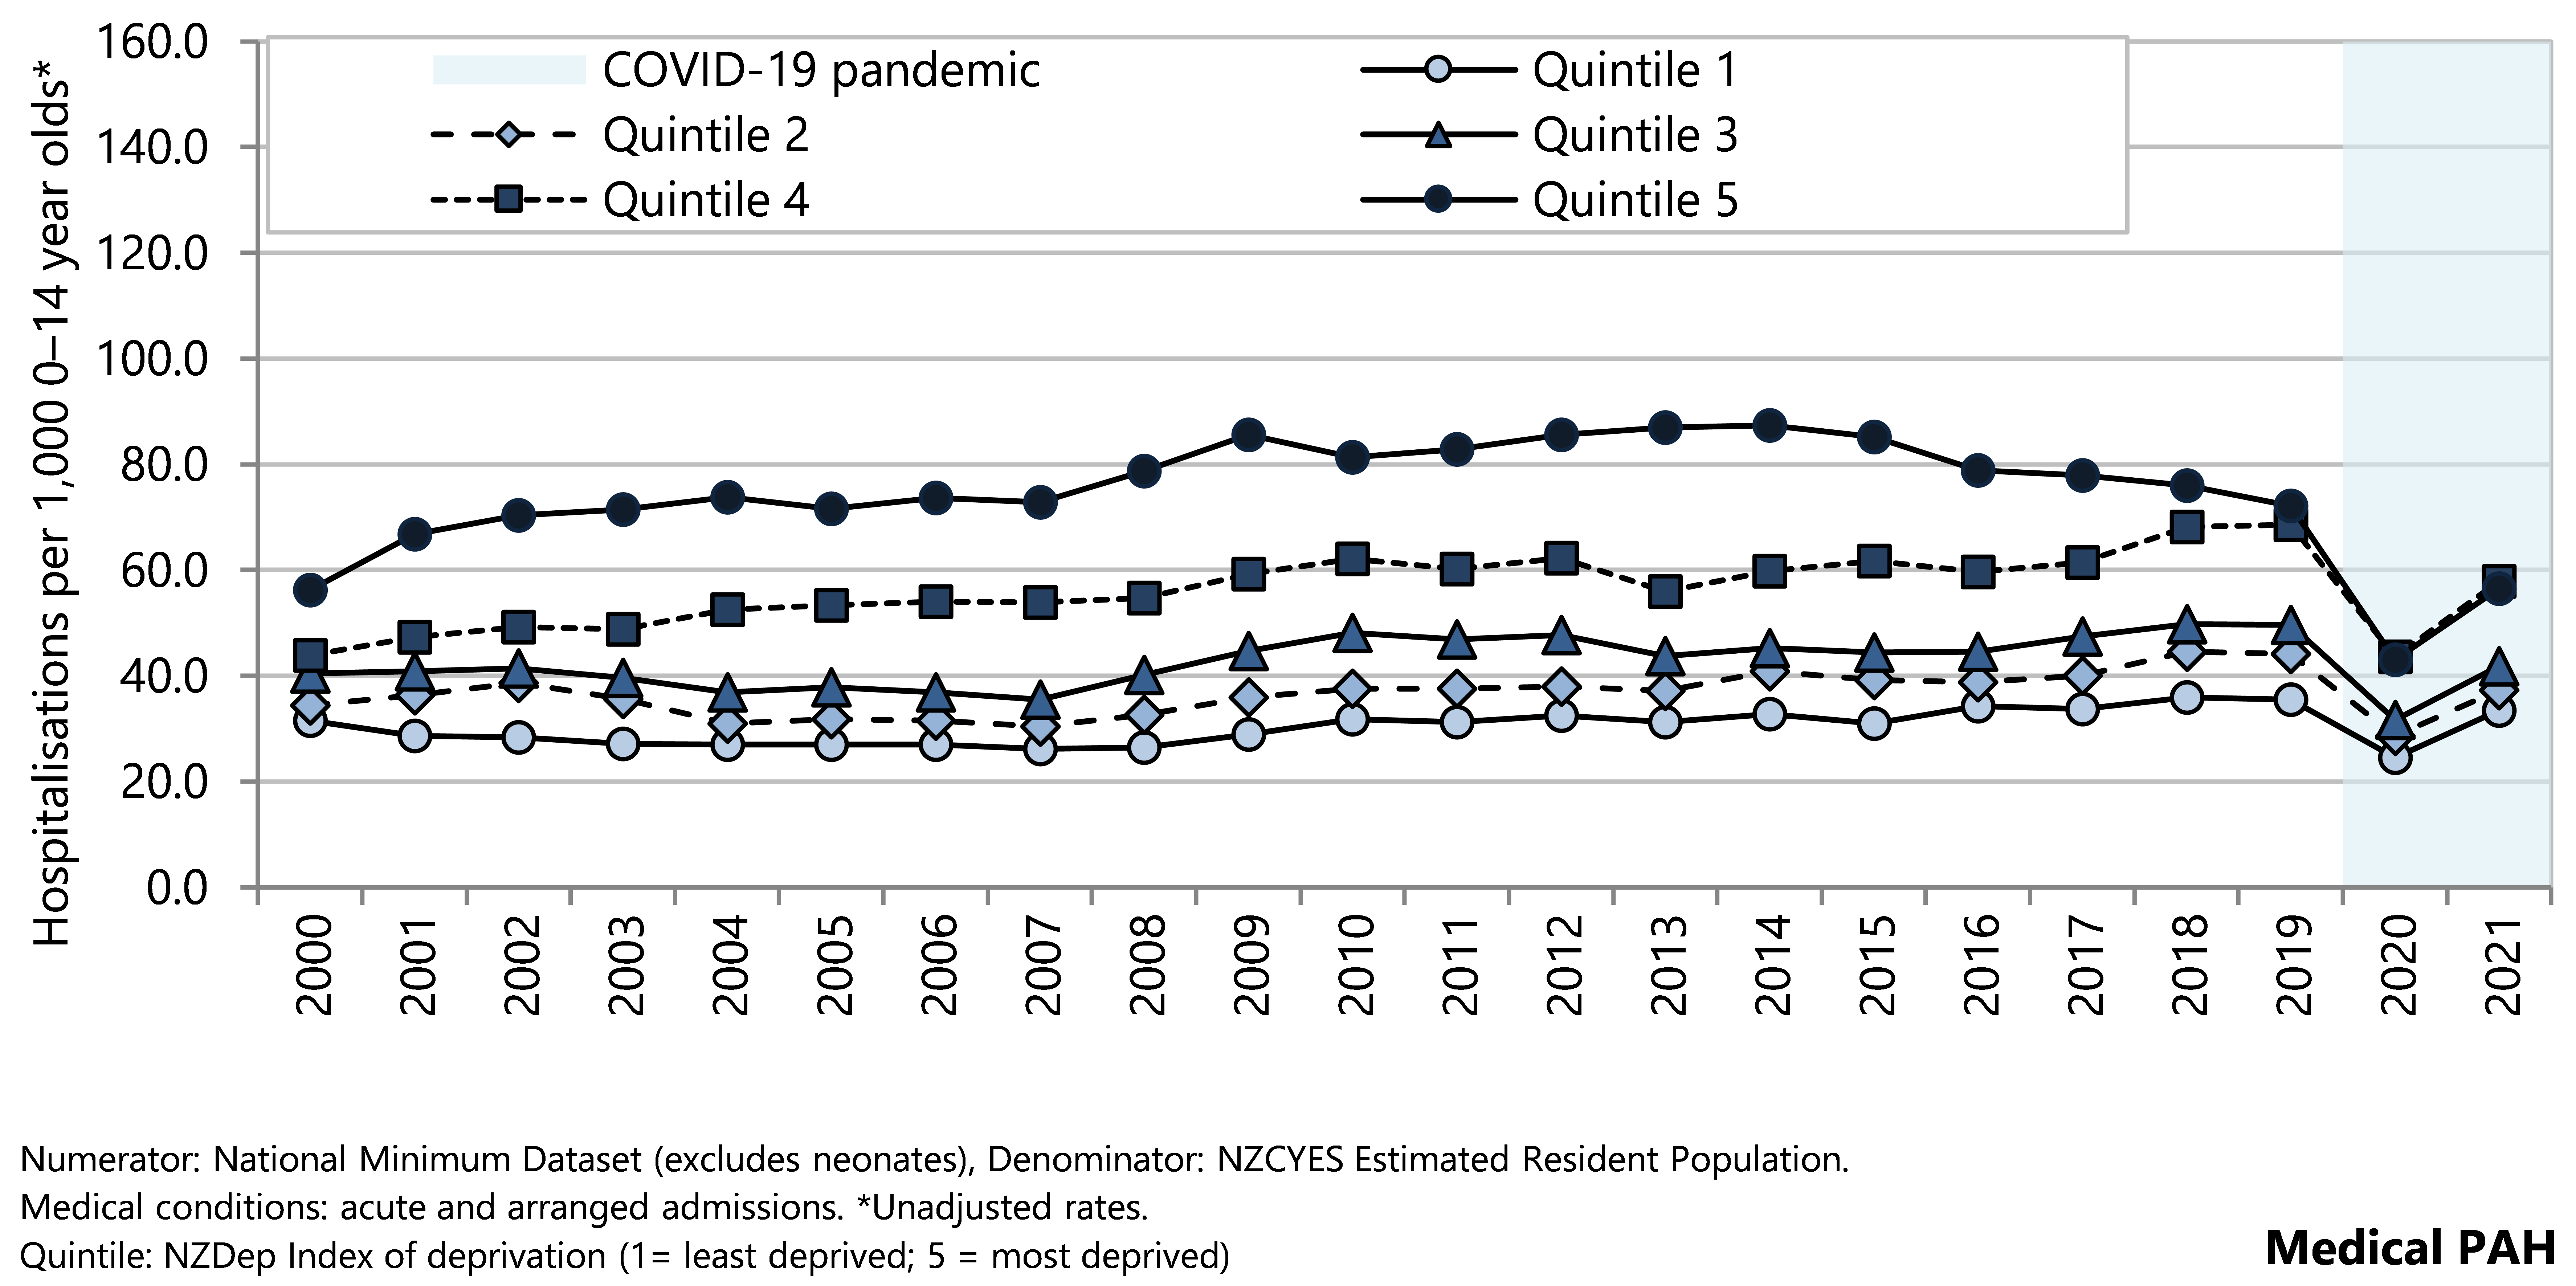
Figure 57 . Potentially avoidable hospitalisations, 0-14 year olds, by ethnicity, Aotearoa 2000–2021
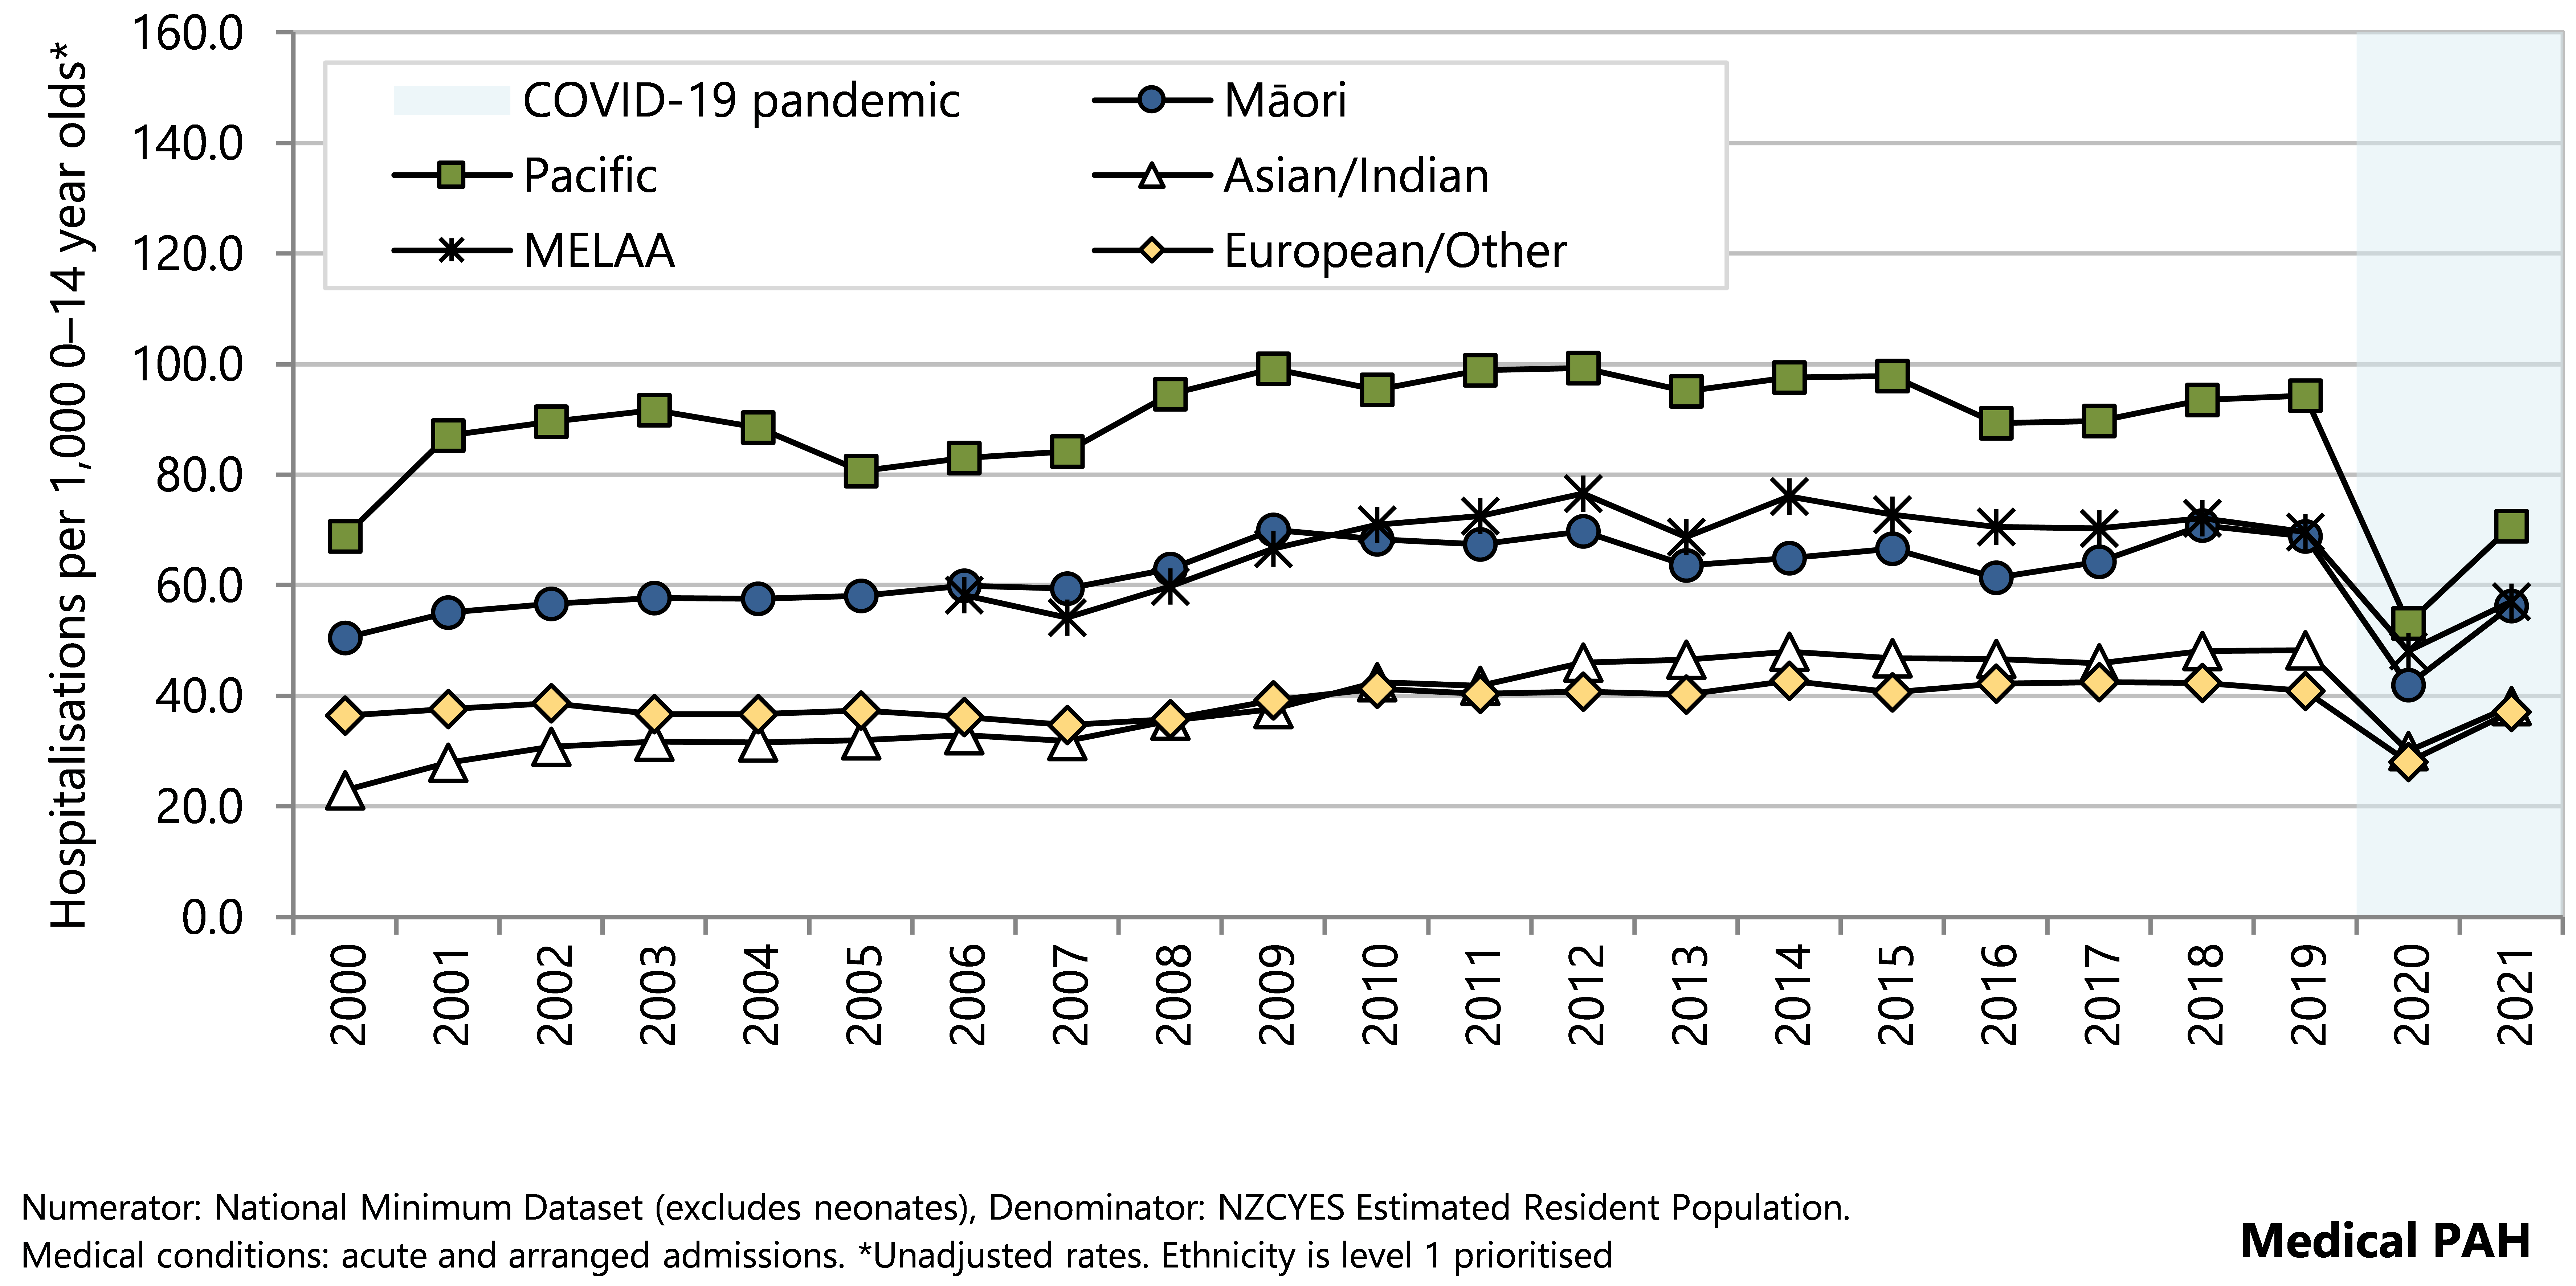
During 2017–2021, respiratory conditions accounted for almost half of medical PAH. Dental conditions (predominantly dental caries) were the next most common diagnostic category, followed by gastrointestinal diseases (such as gastroenteritis) ( Table 6).
Table 6. Potentially avoidable hospitalisations for medical conditions, by main diagnostic category, 0–14 year olds (excluding neonates), Aotearoa 2017–2021
| Main Diagnostic Category | n | Rate per 1,000 0–14 year olds | 95% CI | % of PAH |
| Potentially avoidable hospitalisations of 0–14 year olds in Aotearoa during 2017–2021 | ||||
| Medical conditions | ||||
| Respiratory conditions | 110,743 | 23.22 | 23.08–23.35 | 47.1 |
| Dental conditions*† | 37,575 | 7.88 | 7.80–7.96 | 16.0 |
| Gastrointestinal diseases | 27,461 | 5.76 | 5.69–5.83 | 11.7 |
| Other medical conditions | 21,468 | 4.50 | 4.44–4.56 | 9.1 |
| Dermatological conditions | 15,817 | 3.32 | 3.26–3.37 | 6.7 |
| Epilepsy | 8,582 | 1.80 | 1.76–1.84 | 3.6 |
| Vaccine-preventable diseases | 4,716 | 0.99 | 0.96–1.02 | 2.0 |
| Diabetes (including hypoglycaemia) | 2,754 | 0.58 | 0.56–0.60 | 1.2 |
| Otitis media | 2,470 | 0.52 | 0.50–0.54 | 1.0 |
| Kidney, urinary tract infection | 2,341 | 0.49 | 0.47–0.51 | 1.0 |
| Nutrition deficiency and anaemia | 748 | 0.16 | 0.15–0.17 | 0.3 |
| Cardiovascular diseases | 655 | 0.14 | 0.13–0.15 | 0.3 |
| Sexually transmitted infections (STIs) | 24 | 0.01 | 0.00–0.01 | 0.0 |
| Total | 235,354 | 49.34 | 49.15–49.53 | 100.0 |
|
Numerator: National Minimum Dataset (excludes neonates), Denominator: NZCYES Estimated Resident Population. | ||||
The most common types of respiratory illness contributing to PAH from 2017–2021 were upper respiratory tract infections, asthma and wheeze, and acute bronchiolitis (Table 7).
Table 7. Potentially avoidable hospitalisations for respiratory diseases, by sub-diagnostic category, 0–14 year olds, Aotearoa 2017–2021
| Sub Diagnostic Category | n | Rate per 1,000 0–14 year olds | 95% CI | % |
| Potentially avoidable hospitalisations of 0–14 year olds in Aotearoa during 2017–2021 | ||||
| Respiratory diseases | ||||
| Acute upper respiratory tract infections | 32,027 | 6.71 | 6.64–6.79 | 28.2 |
| Asthma and wheeze | 31,204 | 6.54 | 6.47–6.61 | 27.4 |
| Acute bronchiolitis | 26,729 | 5.60 | 5.54–5.67 | 23.5 |
| Pneumonia* | 11,561 | 2.42 | 2.38–2.47 | 10.2 |
| Unspecified lower respiratory tract infection | 7,976 | 1.67 | 1.64–1.71 | 7.0 |
| Influenza | 2,764 | 0.58 | 0.56–0.60 | 2.4 |
| Bronchiectasis (non-CF) | 1,027 | 0.22 | 0.20–0.23 | 0.9 |
| Acute bronchitis | 440 | 0.09 | 0.08–0.10 | 0.4 |
| Respiratory conditions | 113,728 | 23.84 | 23.71–23.98 | 100.0 |
|
Numerator: National Minimum Dataset (excludes neonates), Denominator: NZCYES estimated resident population; | ||||
Over the twenty years prior to 2020, rates of PAH for upper respiratory tract conditions, asthma and wheeze, bronchiolitis and unspecified lower respiratory tract conditions all increased slightly while PAH for pneumonia decreased slightly (Figure 58). In 2020, rates of all five respiratory conditions decreased sharply, with a particularly marked decline in the hospitalisation rate for bronchiolitis. In 2021 the hospitalisation rates for each of these respiratory conditions increased, close to 2019 rates for URTI, bronchiolitis, and unspecified lower respiratory tract infections (Figure 58).
Figure 58 . Potentially avoidable hospitalisations for respiratory diseases, by sub-diagnostic category, 0–14 year olds, Aotearoa 2000–2021
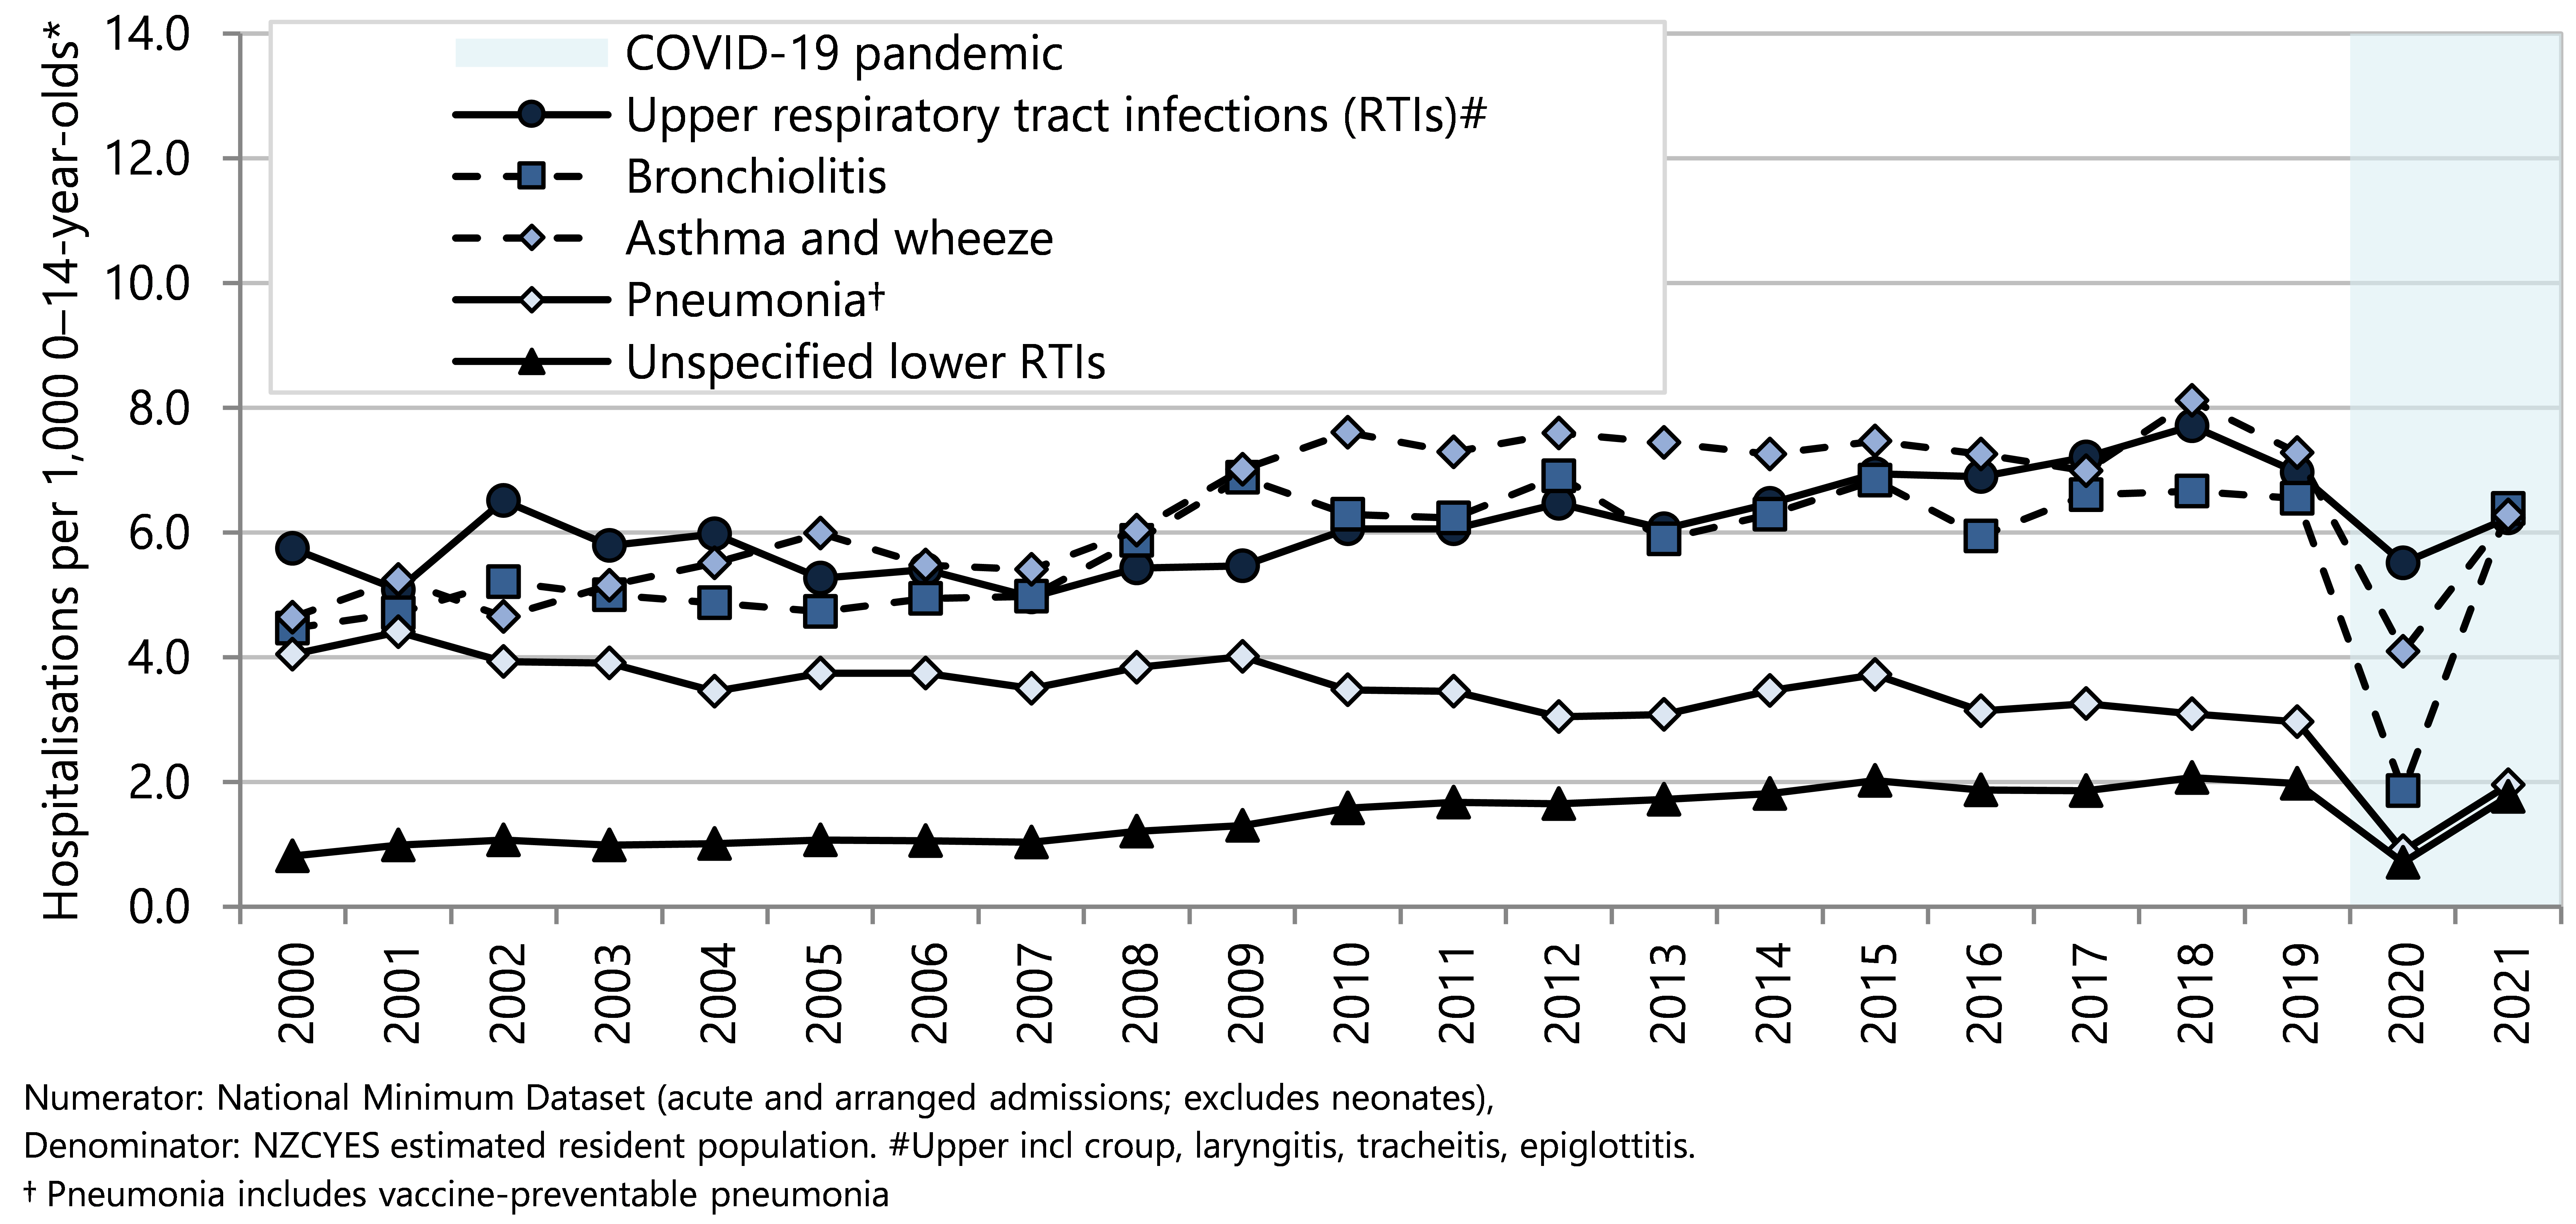
Vaccine-preventable diseases
In the five years from 2017–2021, there were almost 5,000 potentially avoidable hospitalisations of under-15 year olds for vaccine-preventable diseases (VPD). Two-thirds of the VPD PAH were for children aged under five years, for whom the hospitalisation rate was twice as high as for 10–14 year olds (Figure 59).
Inequity in VPD hospitalisation rates by neighbourhood deprivation and ethnicity point to conditions in society that privilege some population groups and result in disproportionate barriers to vaccine access for others (Figure 59). The VPD hospitalisation rate for children living in the most deprived neighbourhoods (quintile 5) was almost three times as high as the rate for children living in the least deprived neighbourhoods (quintile 1) (Figure 59). The highest VPD PAH rates were observed for Pacific children, for whom the rate was almost four times as high as the rates for European/Other children. The VPD hospitalisation rate for Māori children was twice as high as the rate for European/Other children (Figure 59).
Figure 59 . Potentially avoidable hospitalisations for vaccine-preventable diseases, by demographic factor, 0–14 year olds, Aotearoa 2017–2021
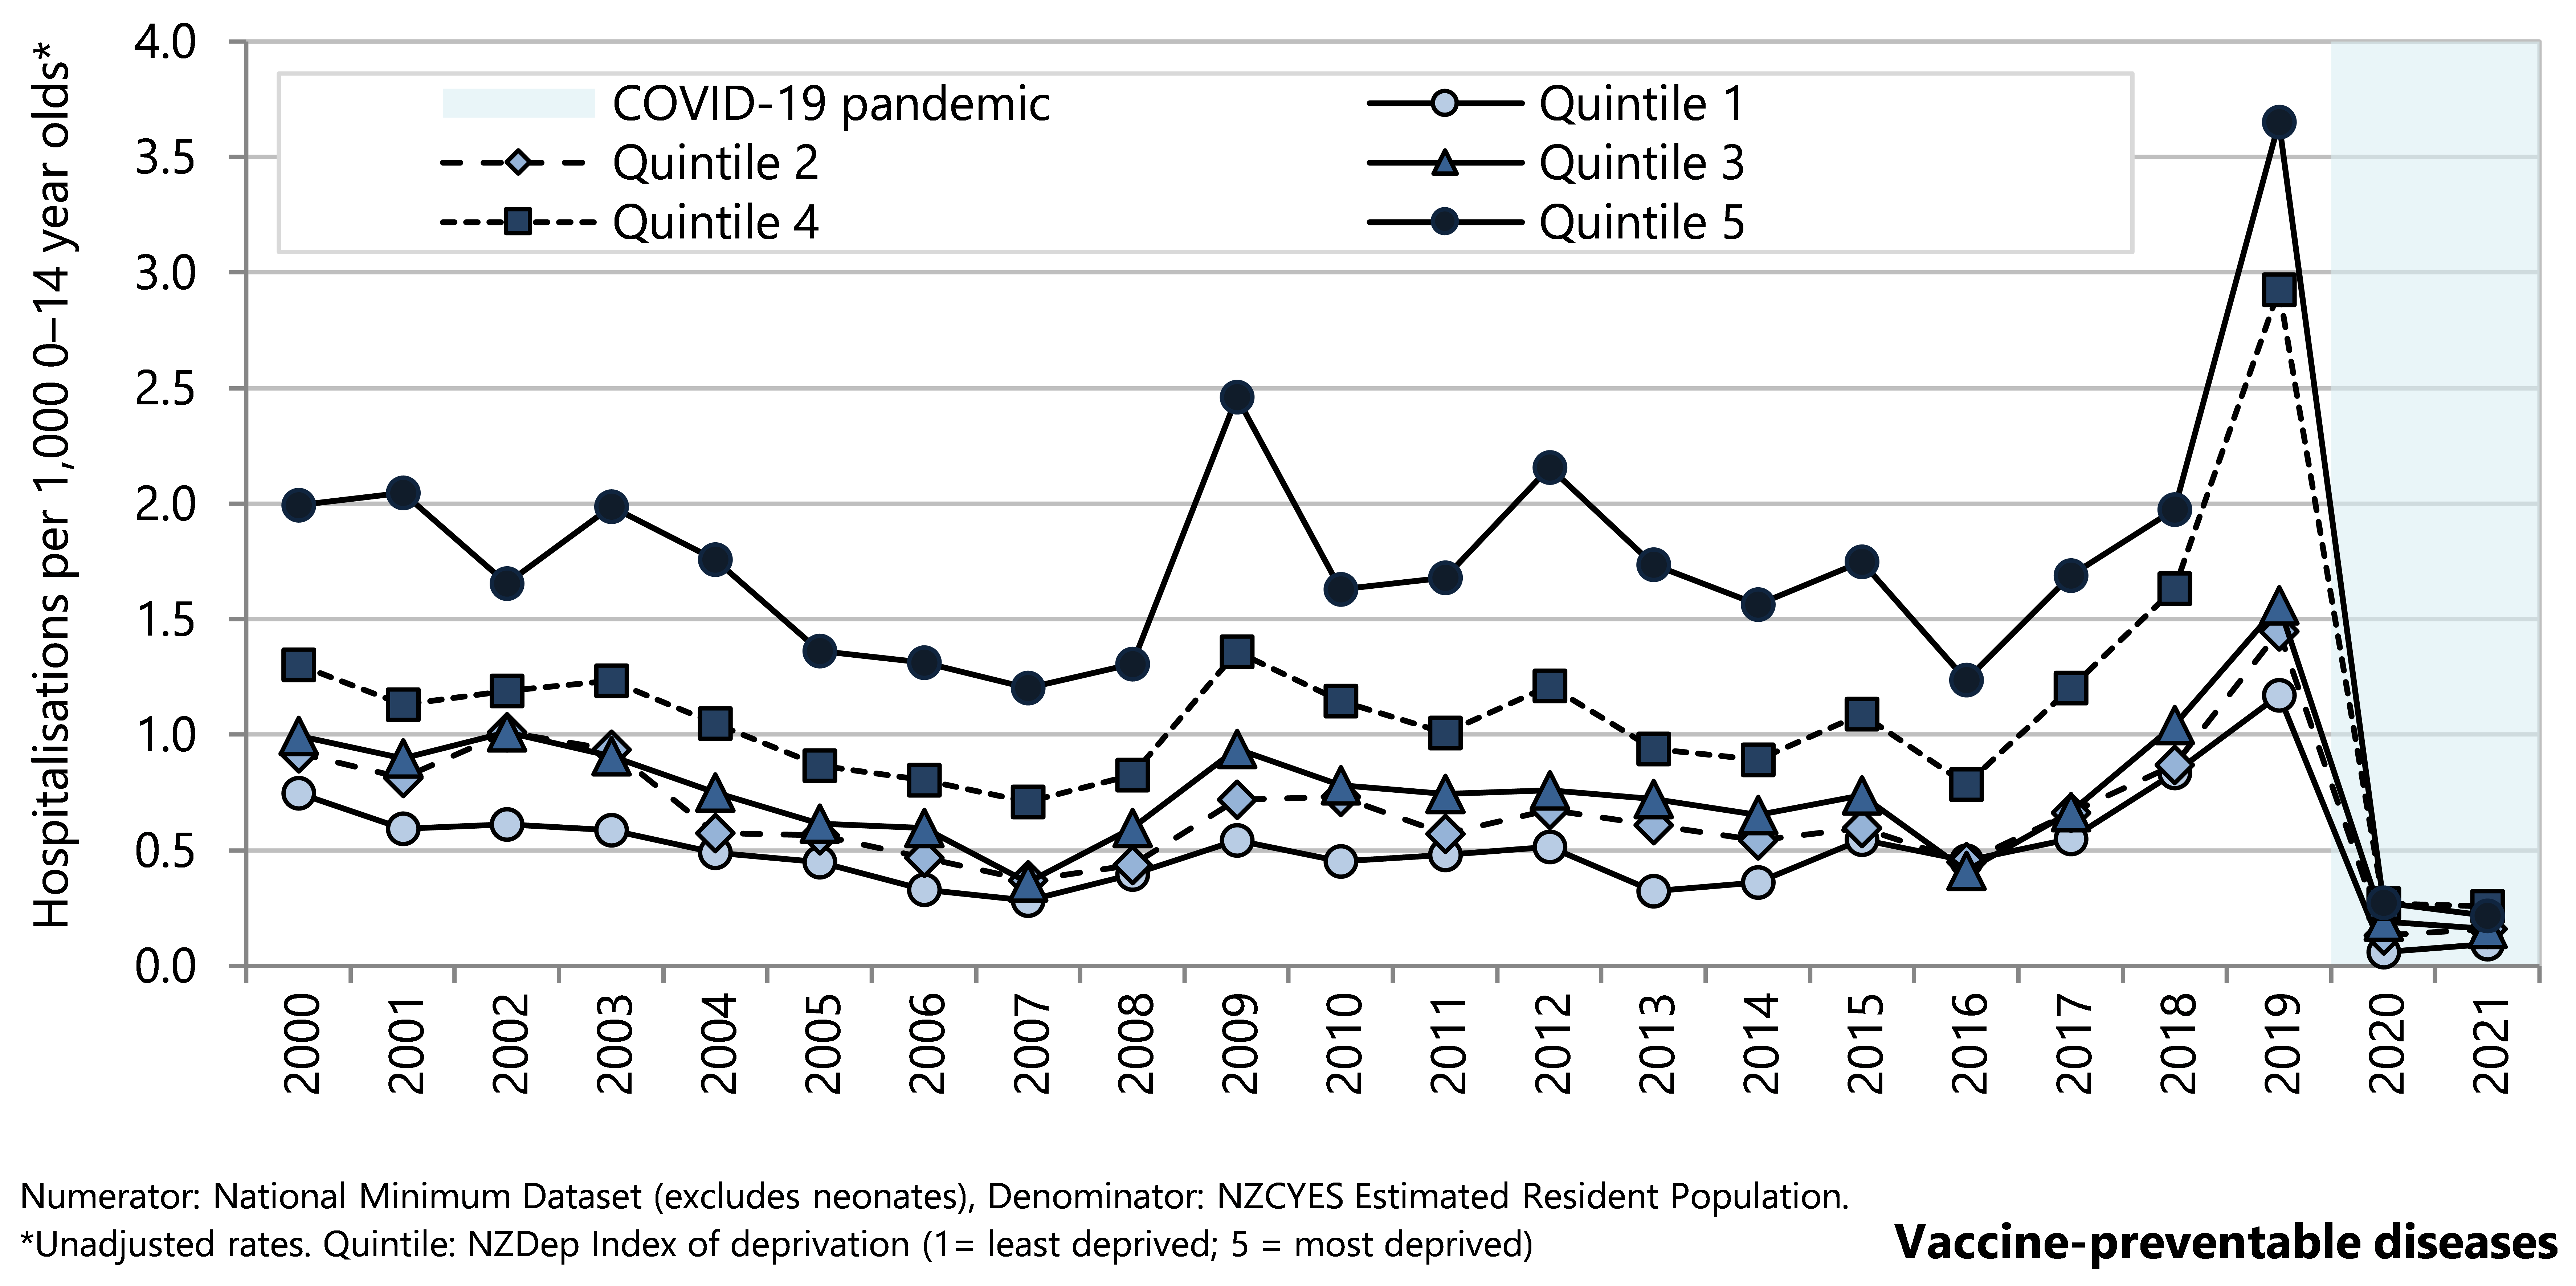
Hospitalisation rates of under-15 year olds for VPD declined overall from 2000–2007, and then varied from year to year with small peaks in 2009 and 2012 and a more marked peak in 2019. In 2020 and 2021 the VPD hospitalisation rates were at very low levels, during implementation of the COVID-19 pandemic alert levels and protection framework.
Hospitalisation rates for VPD have consistently been higher for children living in more deprived neighbourhoods (NZDep2013 quintiles 4 and 5). Although the same temporal patterns in rates are observed in all deprivation quintiles, the rise was greater for children in more deprived quintiles in the years when rates peaked. The decline in 2020 was evident in all NZDep quintiles with narrowing of the gap between quintiles 4 and 5, and quintiles 1–3, narrowing which persisted into 2021 (Figure 60).
Pacific children have consistently had the highest VPD hospitalisation rates and the sharp increase in rate in 2019 was most marked for these children. Tamariki Māori children have consistently had VPD hospitalisation rates higher than those for European/Other and Asian/Indian children (Figure 61).
Figure 60. Potentially avoidable hospitalisations for vaccine-preventable diseases, 0-14 year olds, by deprivation quintile, Aotearoa 2000–2021
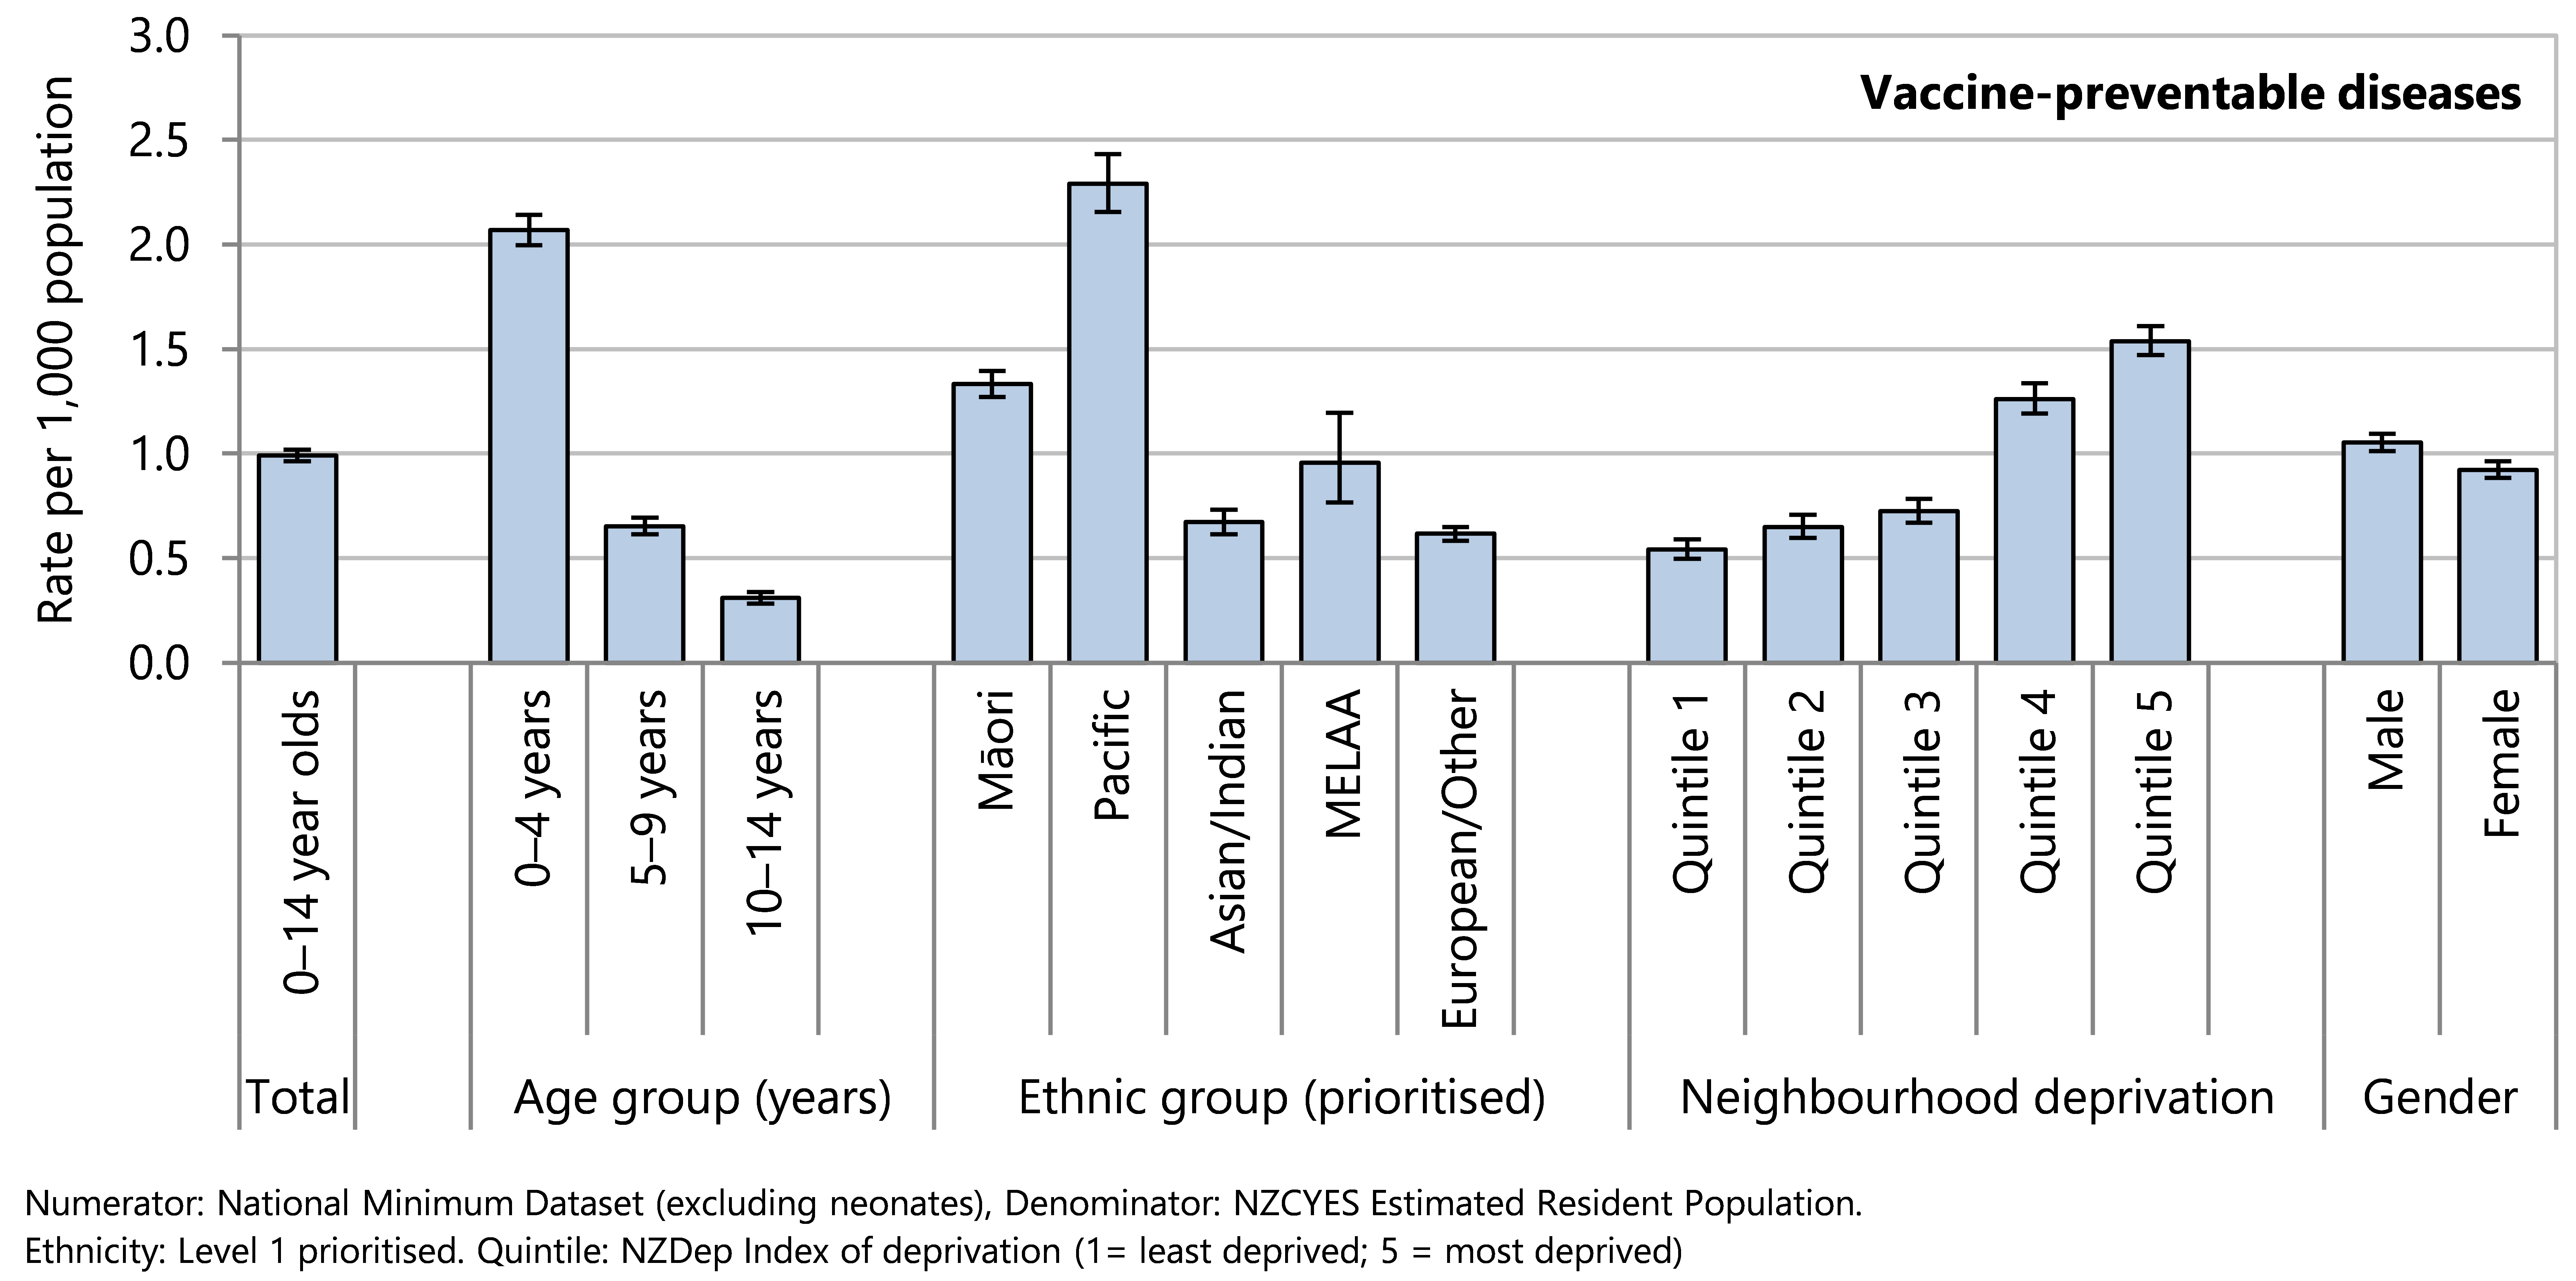
Figure 61. Potentially avoidable hospitalisations for vaccine-preventable diseases, 0-14 year olds, by ethnicity, Aotearoa 2000–2021
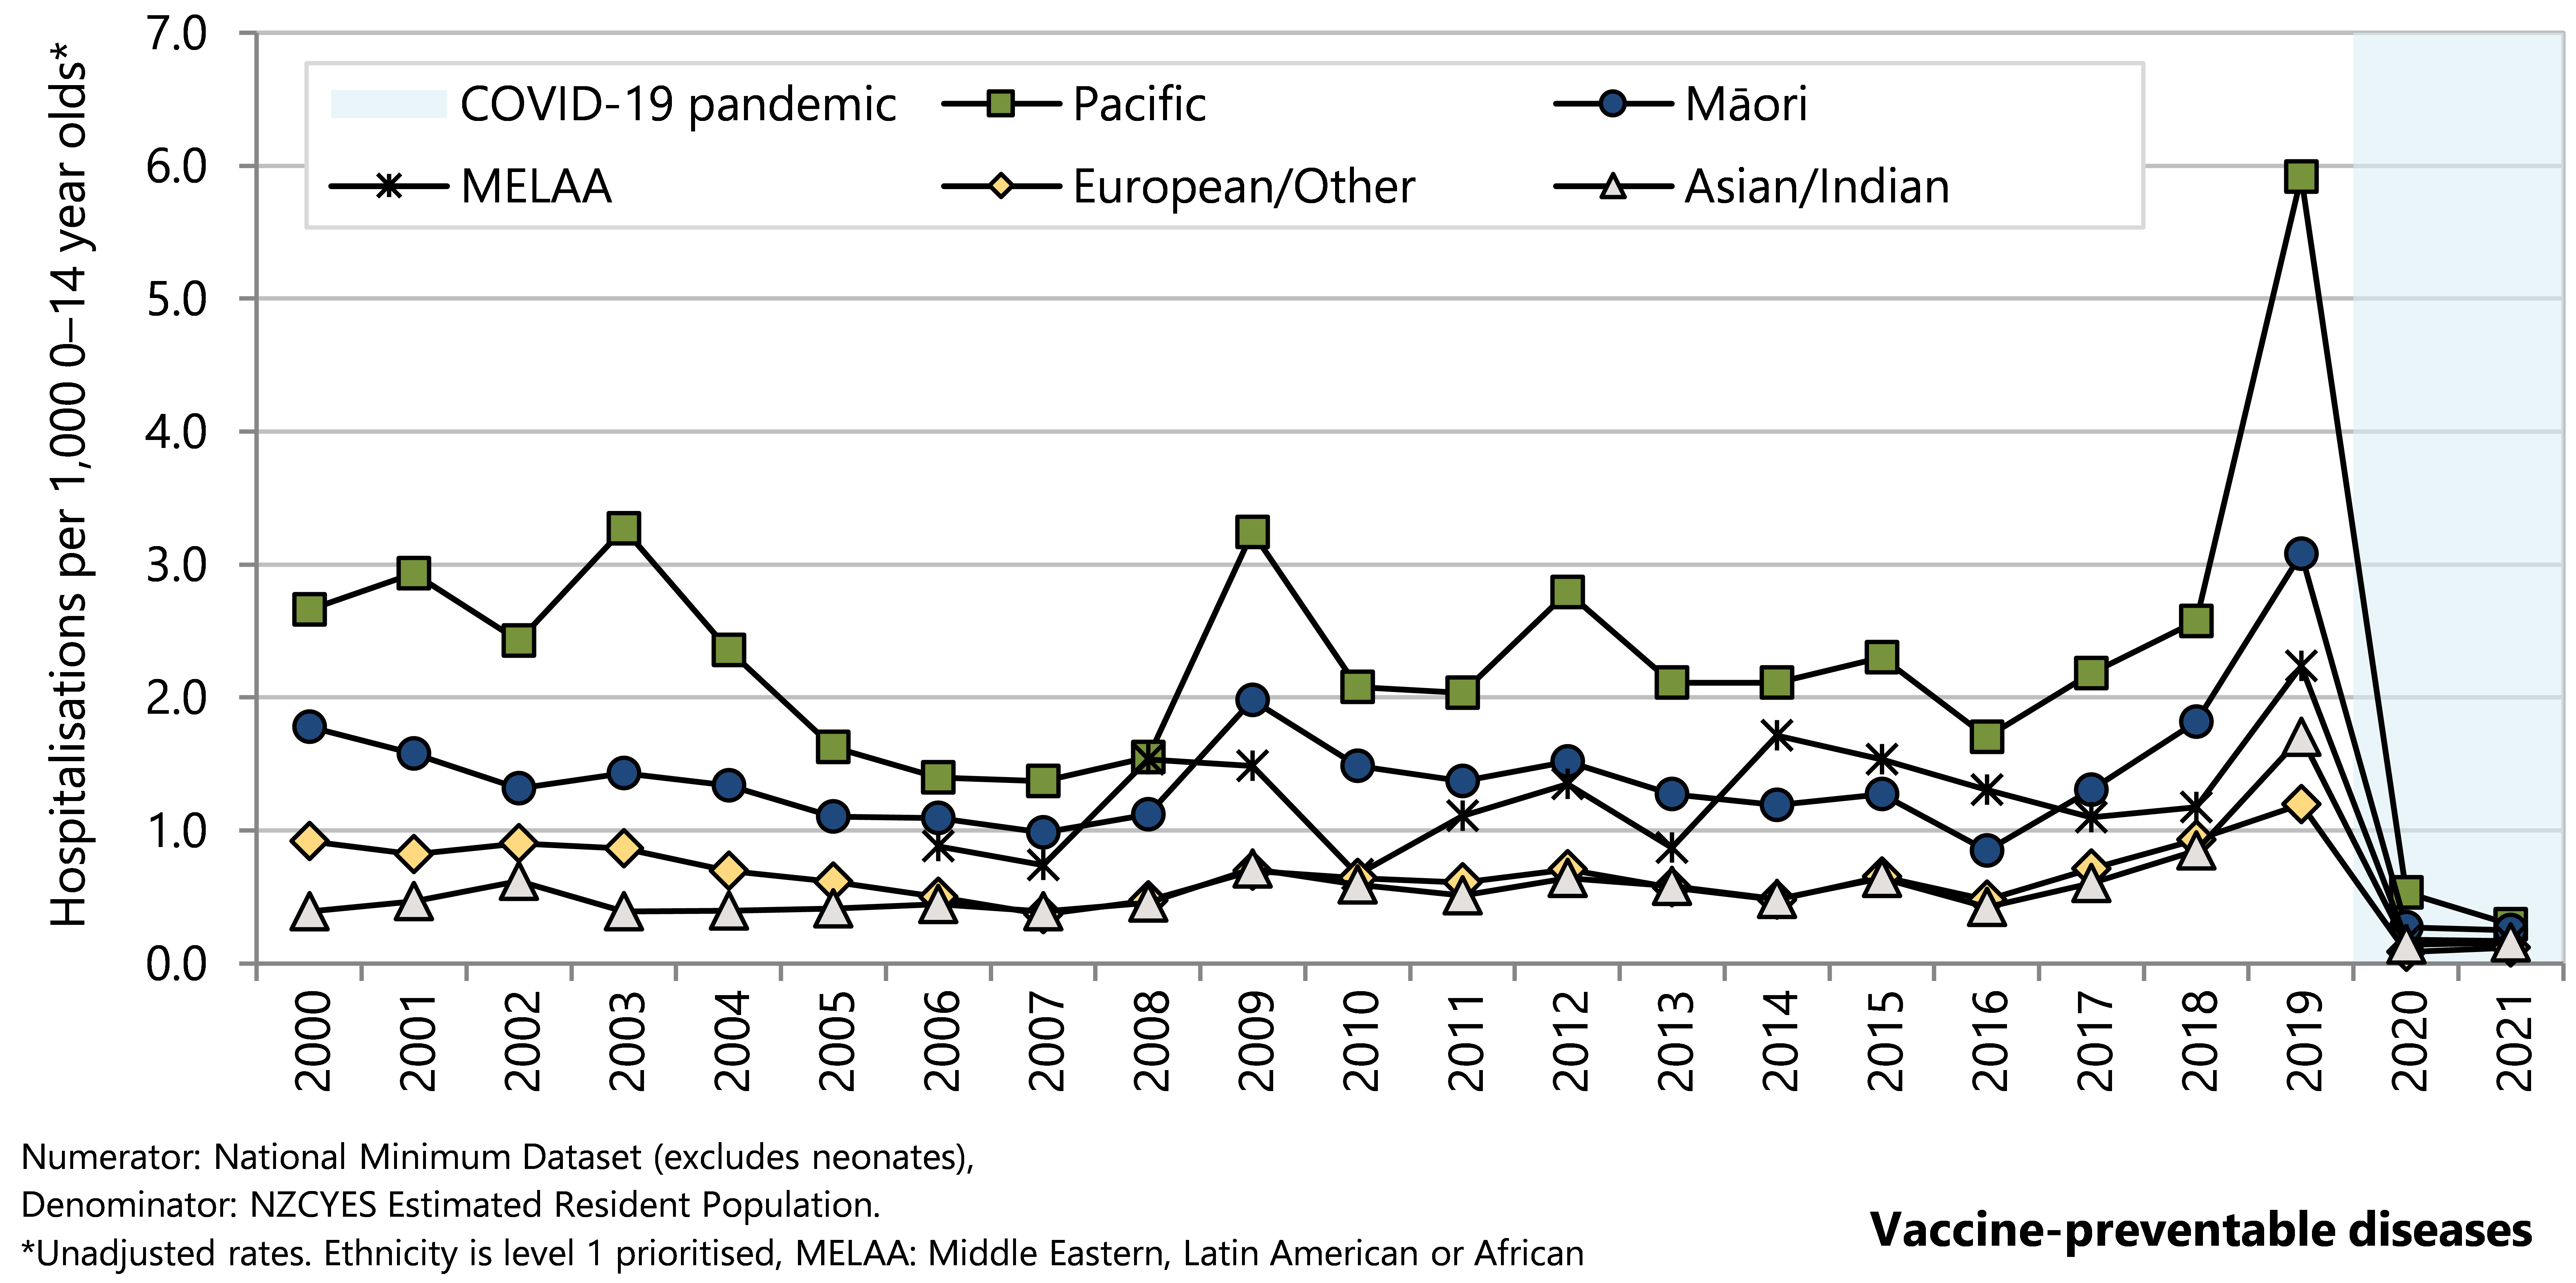
During 2017–2021, influenza accounted for almost 60% of VPD hospitalisations among 0–14 year olds, with a total of 2,763 hospitalisations over this time (Table 8). Varicella accounted for 17.7% of VPD hospitalisations from 2017–2021, and other vaccine-preventable diseases each accounted for fewer than 10% of VPD hospitalisations (Table 8).
Table 8. Hospitalisations for vaccine-preventable diseases, by diagnosis, 0–14 year olds, Aotearoa 2017–2021
| Sub Diagnostic Category | n | Rate per 100,000 0–14 year olds | 95% CI | % |
| Potentially avoidable hospitalisations of 0–14 year olds in New Zealand during 2017–2021 | ||||
| Vaccine preventable diseases | ||||
| Influenza | 2,763 | 57.92 | 0.56–0.60 | 58.6 |
| Varicella | 834 | 17.48 | 16.34–18.71 | 17.7 |
| Measles | 353 | 7.40 | 6.67–8.21 | 7.5 |
| Pertussis (Whooping cough) | 316 | 6.62 | 5.93–7.40 | 6.7 |
| Meningococcal infection | 193 | 4.05 | 3.51–4.66 | 4.1 |
| Streptococcal pneumonia | 107 | 2.24 | 1.86–2.71 | 2.3 |
| Haemophilus pneumonia | 48 | 1.01 | 0.76–1.33 | 1.0 |
| Mumps | 39 | 0.82 | 0.60–1.12 | 0.8 |
| Hepatitis A | 23 | 0.48 | 0.32–0.72 | 0.5 |
| Tuberculosis | 23 | 0.48 | 0.32–0.72 | 0.5 |
| Meningitis | 12 | 0.25 | 0.14–0.44 | 0.3 |
| Diphtheria | <5 | s | s | s |
| Chronic viral hepatitis* | <5 | s | s | s |
| Rubella | <5 | s | s | s |
| Total | 4,716 | 98.76 | 96.09–101.73 | 100.0 |
| Numerator: National Minimum Dataset (excludes neonates). Denominator: NZCYES Estimated Resident Population. | ||||
There were peaks in influenza hospitalisations in 2003, 2009, 2015, and a marked peak in 2019 (Figure 62). Influenza vaccination is available for children in Aotearoa but funded only for children with health conditions that put them at greater risk of becoming seriously ill with influenza.9 There was a peak of measles hospitalisations in 2019 as part of a known outbreak,71 with earlier lower measles hospitalisation peaks in 2010 and 2013 (Figure 63). There were peaks in pertussis (whooping cough) hospitalisation rates in 2000, 2004, 2012 and 2018 (Figure 63). Hospitalisation rates for meningococcal disease declined steeply from 2001 to 2006, and were relatively stable at around 0.04 hospitalisations per 1,000 age-specific population from 2012 to 2021 (Figure 63). Varicella (chicken-pox) hospitalisations declined steadily from 2017–2021 following the addition of varicella vaccination to the immunisation schedule (Figure 63).72 Hospitalisation rates for all common VPD declined sharply in 2020 and stayed low in 2021 (Figure 63).
="_Ref119324299"> Figure 62. Hospitalisations for influenza, 0–14 year olds, Aotearoa 2000–2021
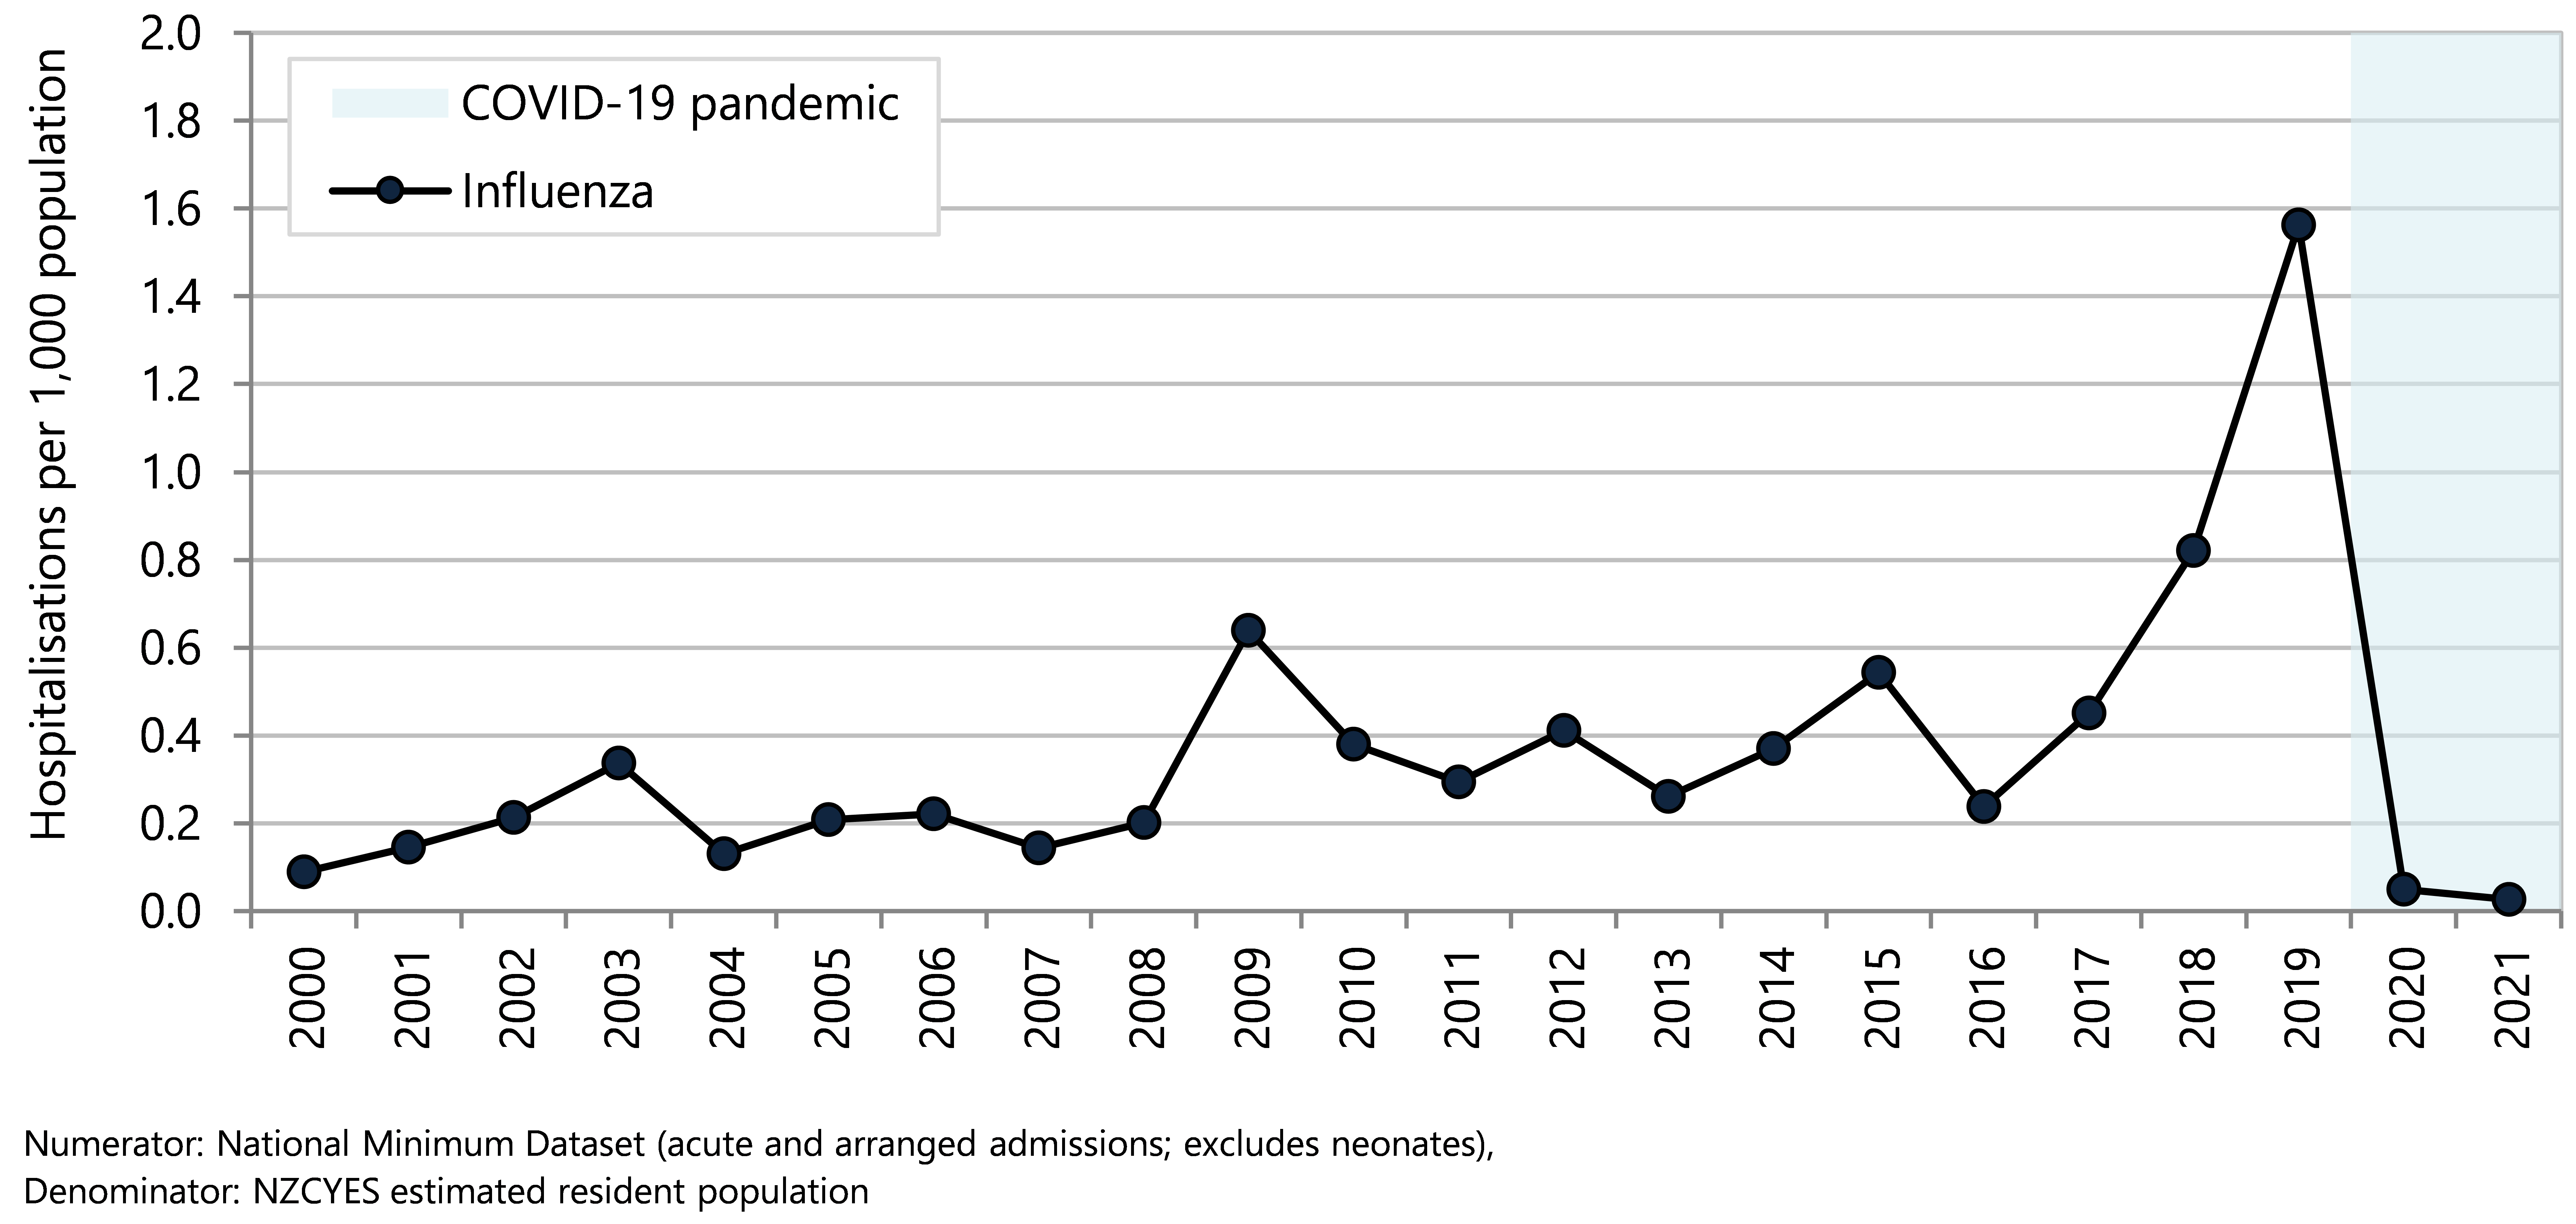
Figure 63. Potentially avoidable hospitalisations for selected vaccine preventable diseases, 0–14 year olds, Aotearoa 2000–2021
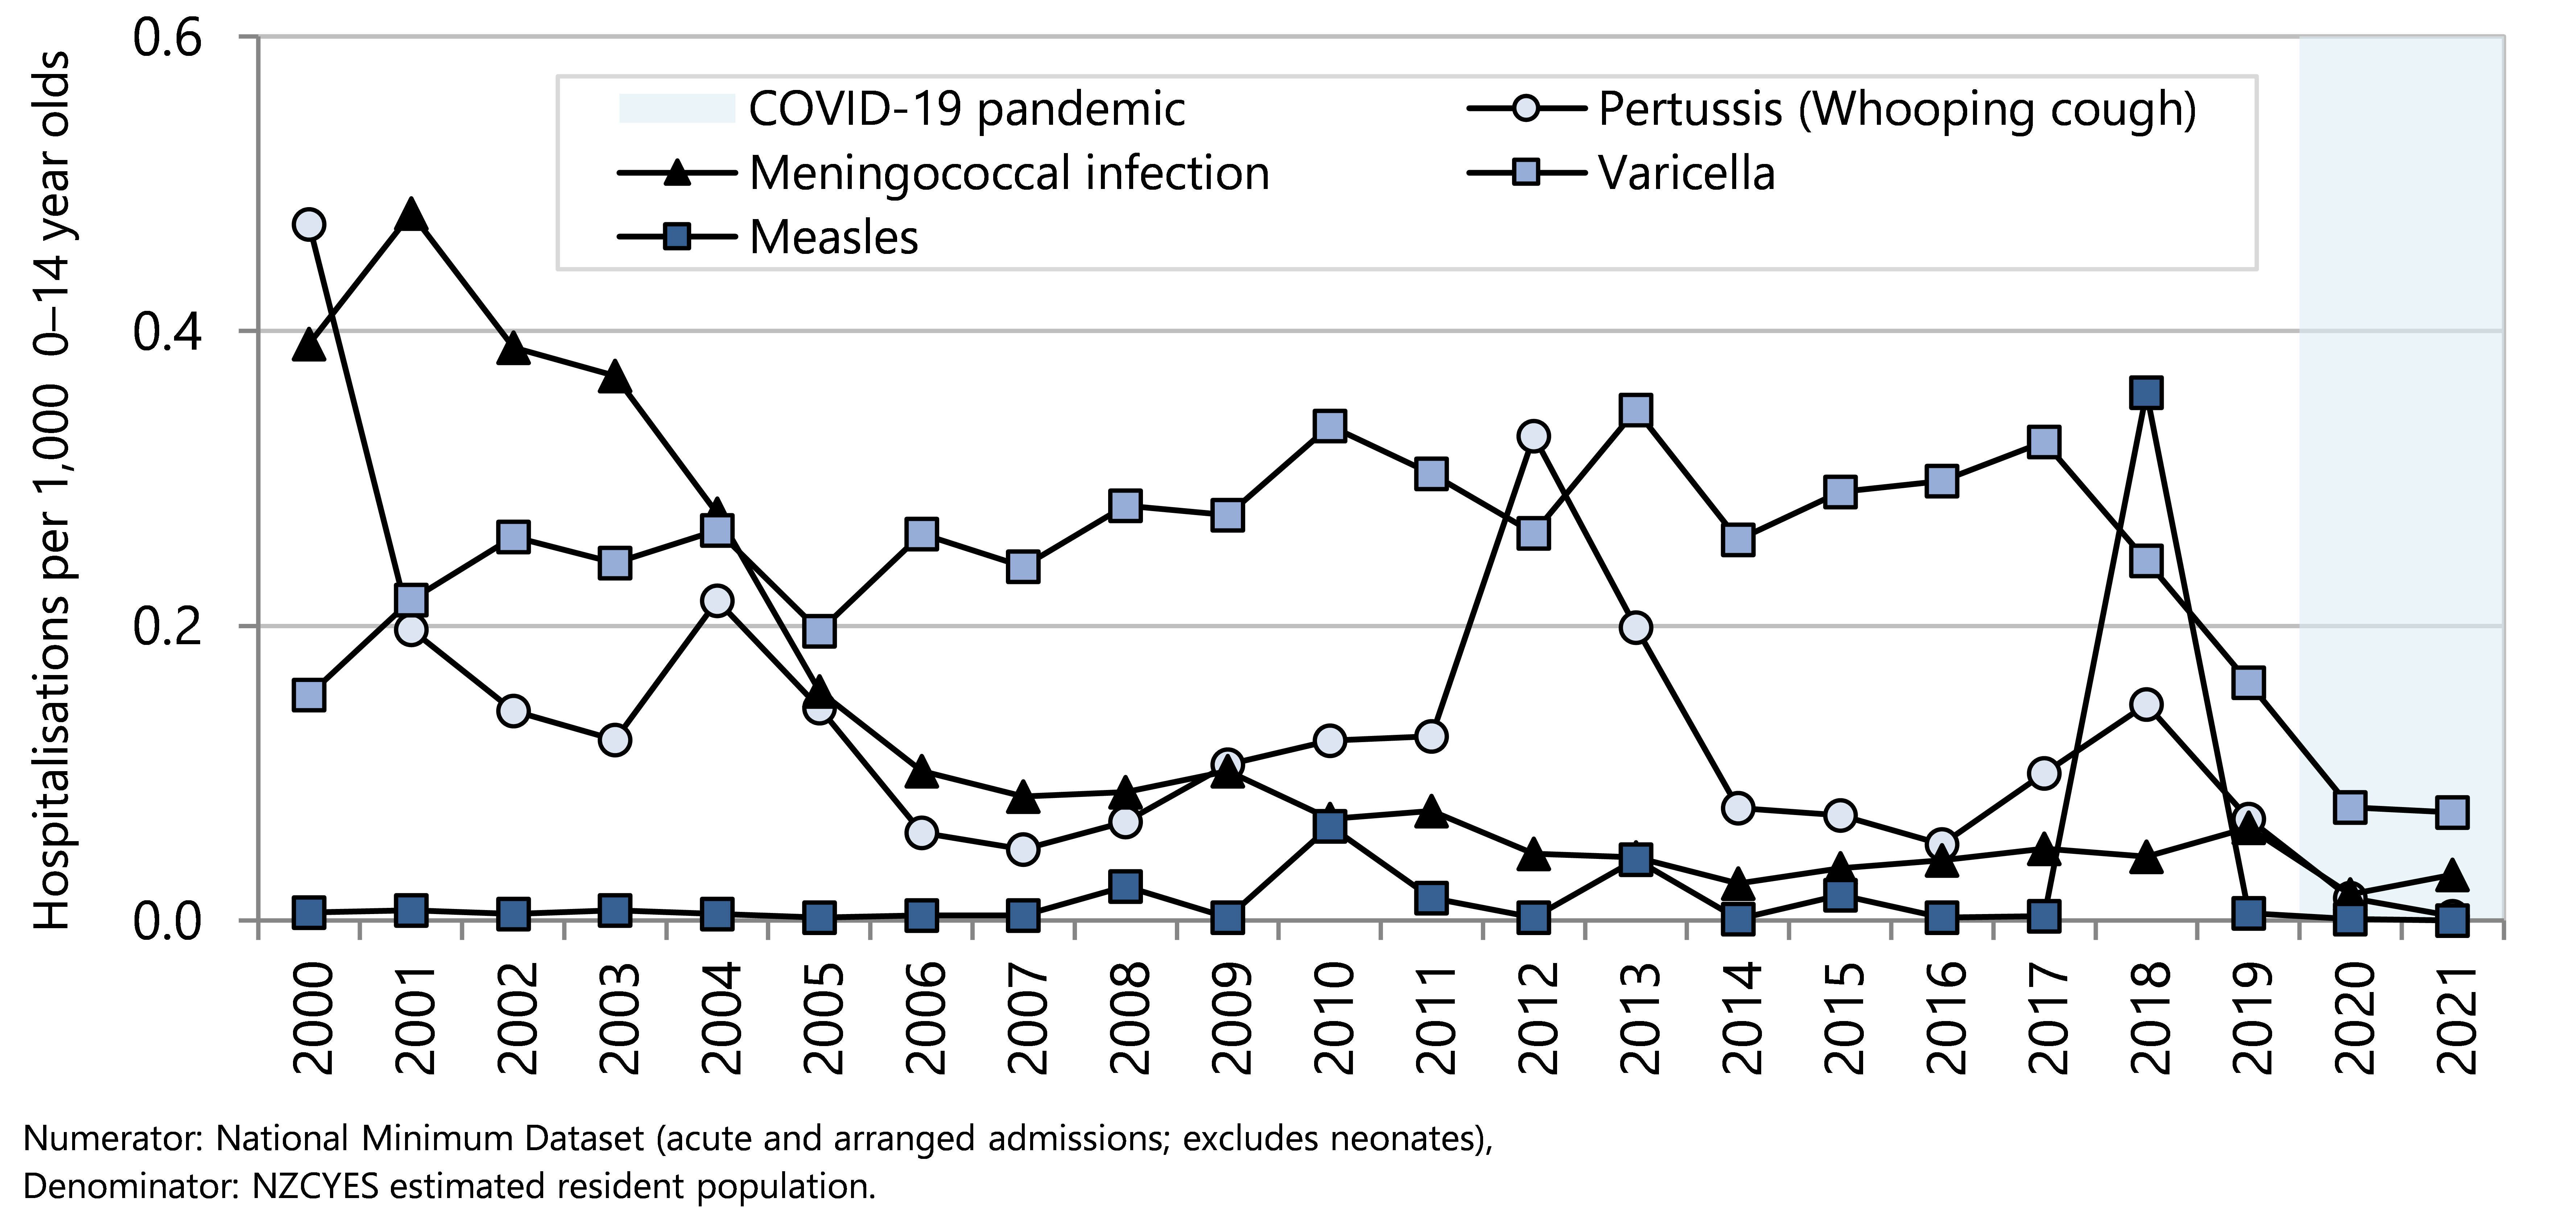
Injuries
In the five years from 2017–2021, there were 36,000 injury-related potentially avoidable hospitalisations (PAH) of under-15 year olds. Injury PAH rates were similar across age groups. Injury rates were somewhat higher for children living in neighbourhoods with higher deprivation scores (NZDep quintiles 4–5) compared with those in lower deprivation areas (NZDep quintiles 1–3). The injury hospitalisation rate for male children was considerably higher than that of female children (Figure 64).
Asian/Indian children had the lowest injury rates, and Middle Eastern Latin American and African (MELAA) children also had lower rates than Māori, Pacific and European/Other children.
Figure 64. Potentially avoidable injury hospitalisations, by demographic factor, 0–14 year olds, Aotearoa 2017–2021
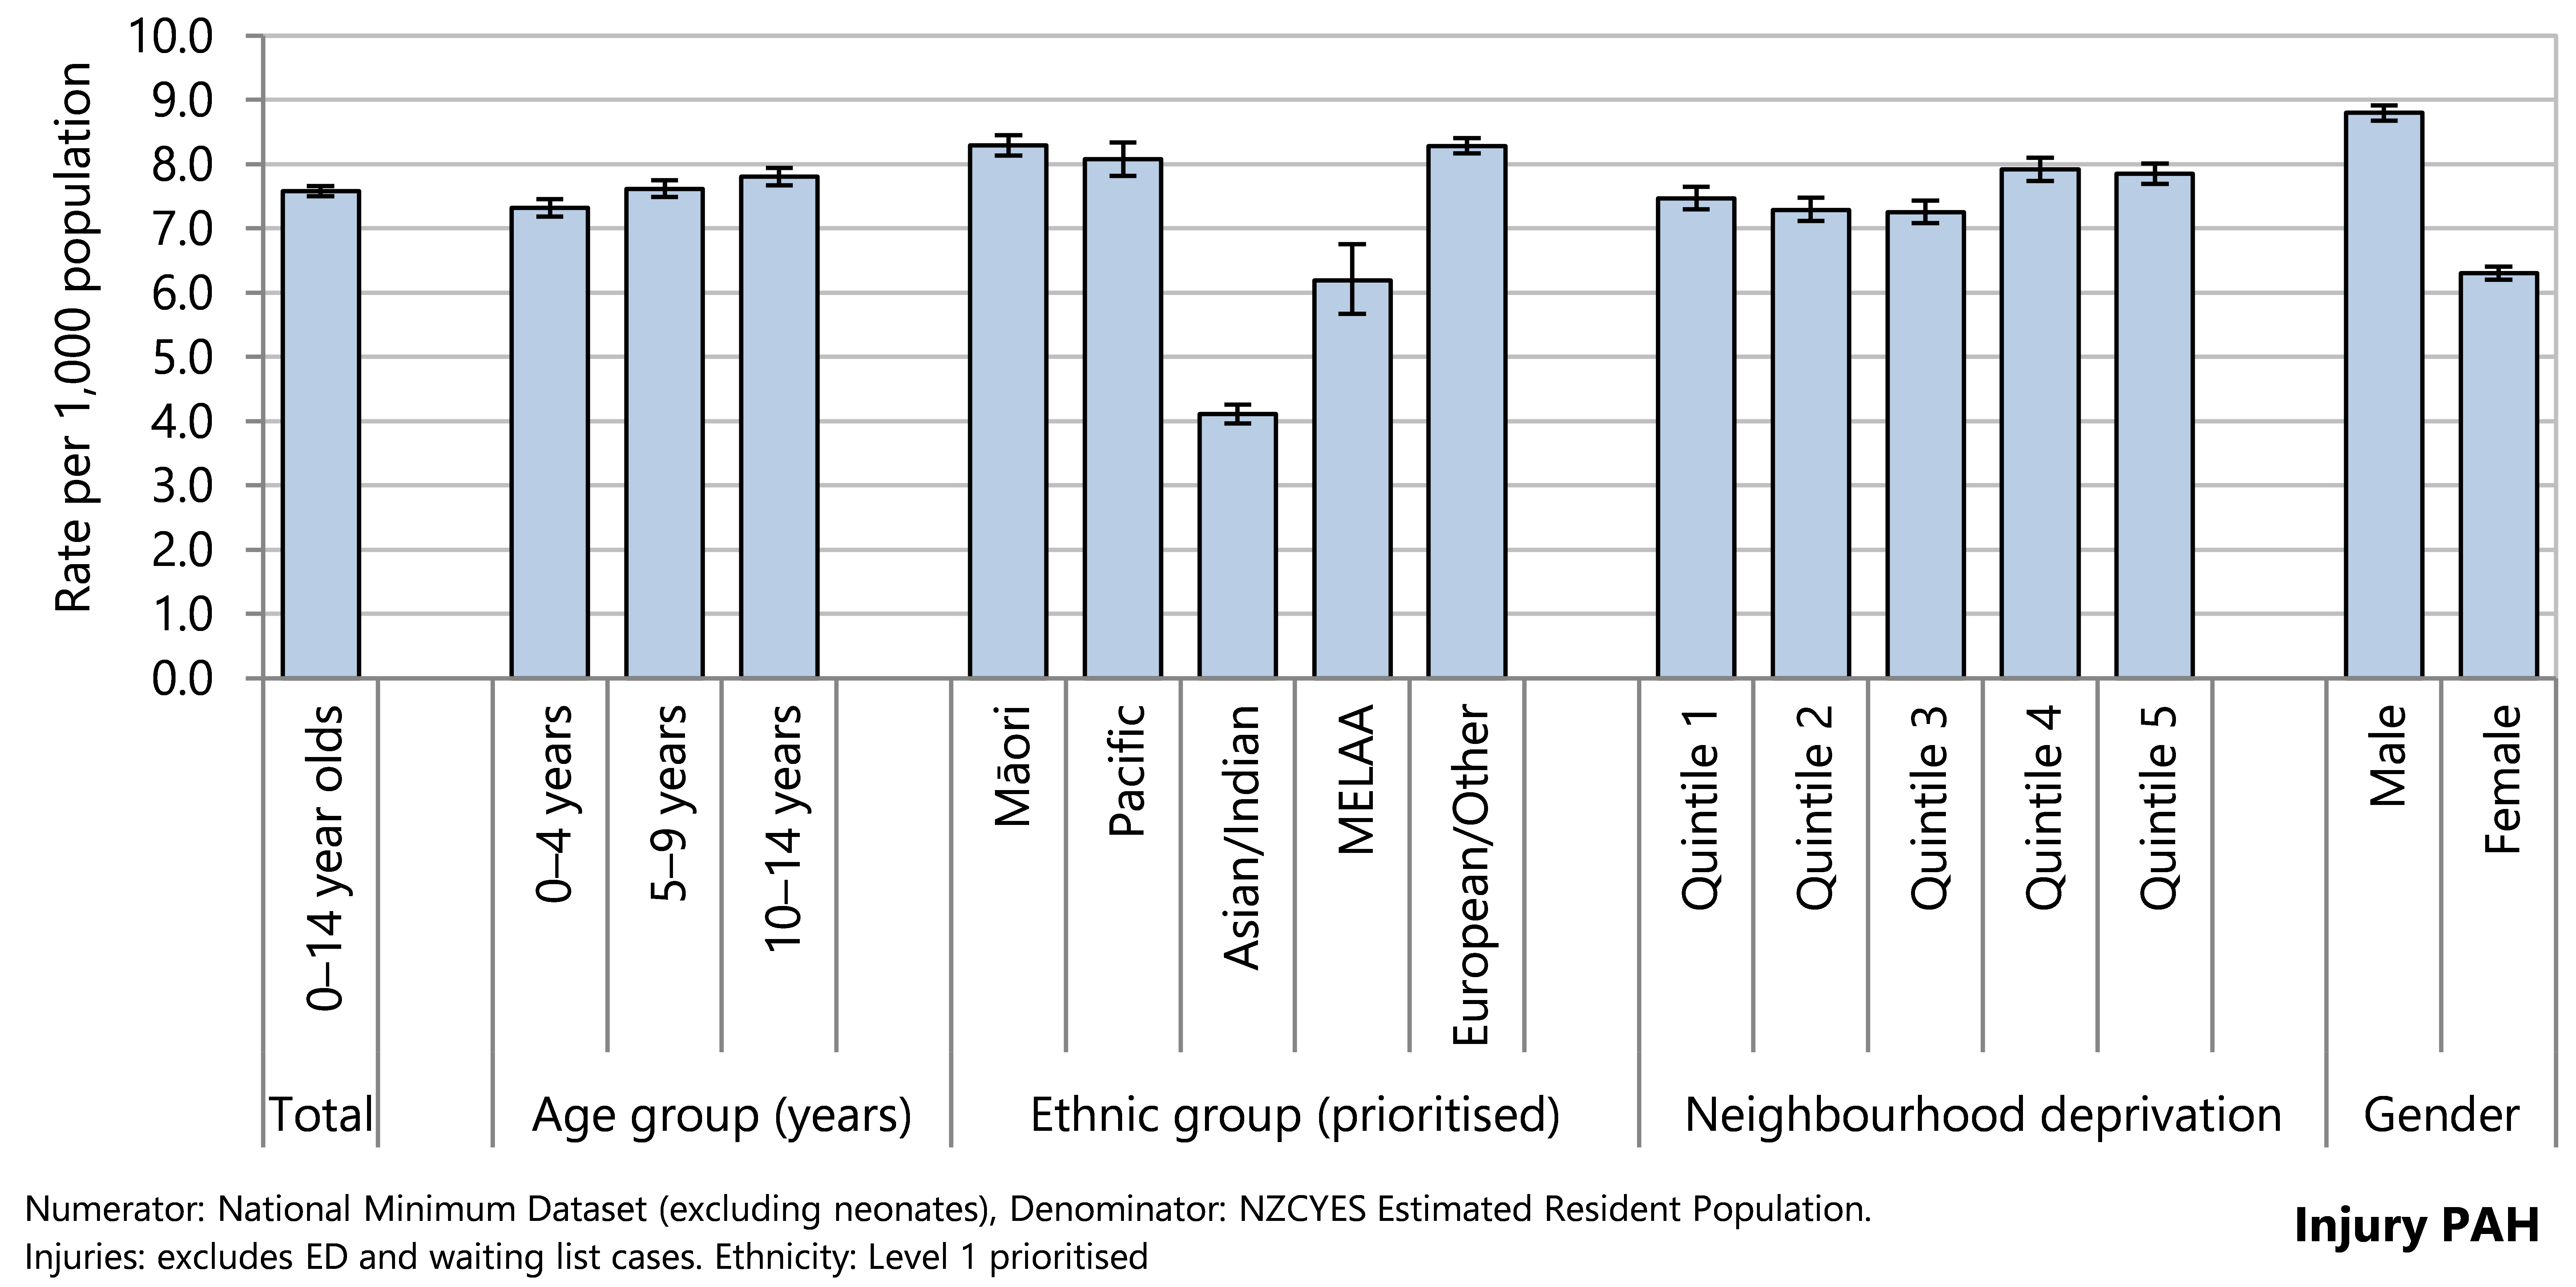
Figure 65. Potentially avoidable injury hospitalisations, 0-14 year olds, by deprivation score, Aotearoa 2000–2021
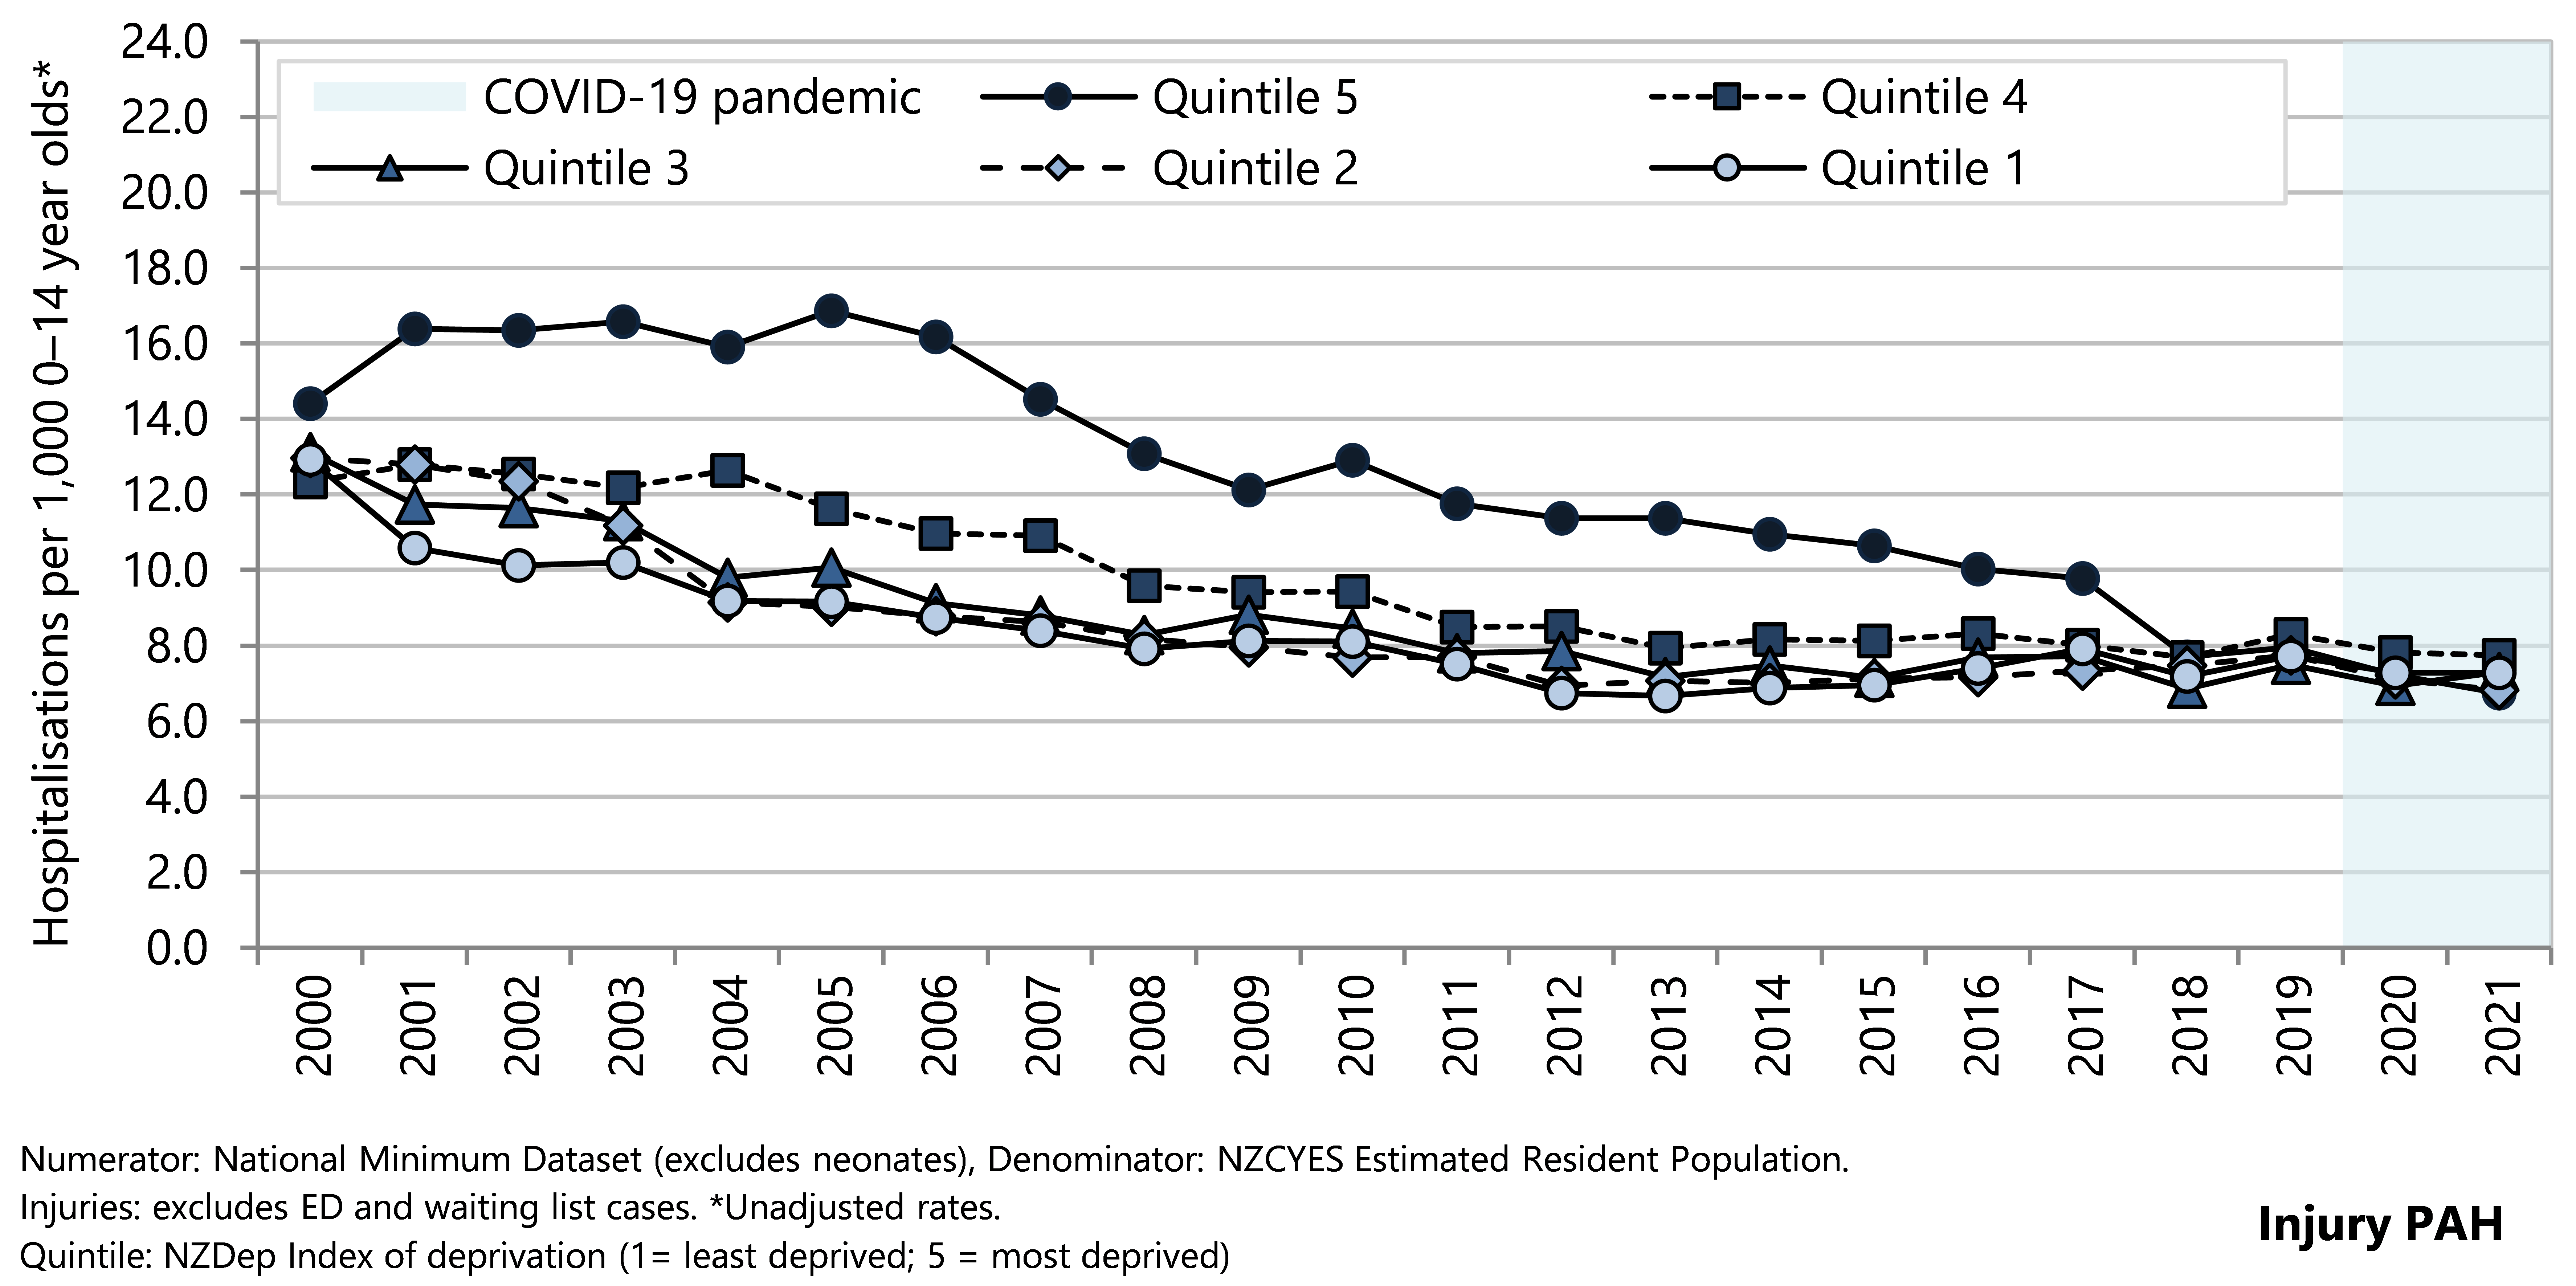
Injury PAH rates declined for all ethnic groups from 2000–2021, with narrowing of the gap between rates for Pacific children, tamariki Māori and European/Other children. Asian/Indian children have consistently had the lowest injury PAH rates, whereas rates for MELAA children decreased from 2006–2016 and have been steady from 2017–2021 (Figure 66).
Figure 66 . Potentially avoidable injury hospitalisations, 0-14 year olds, by ethnicity, Aotearoa 2000–2021
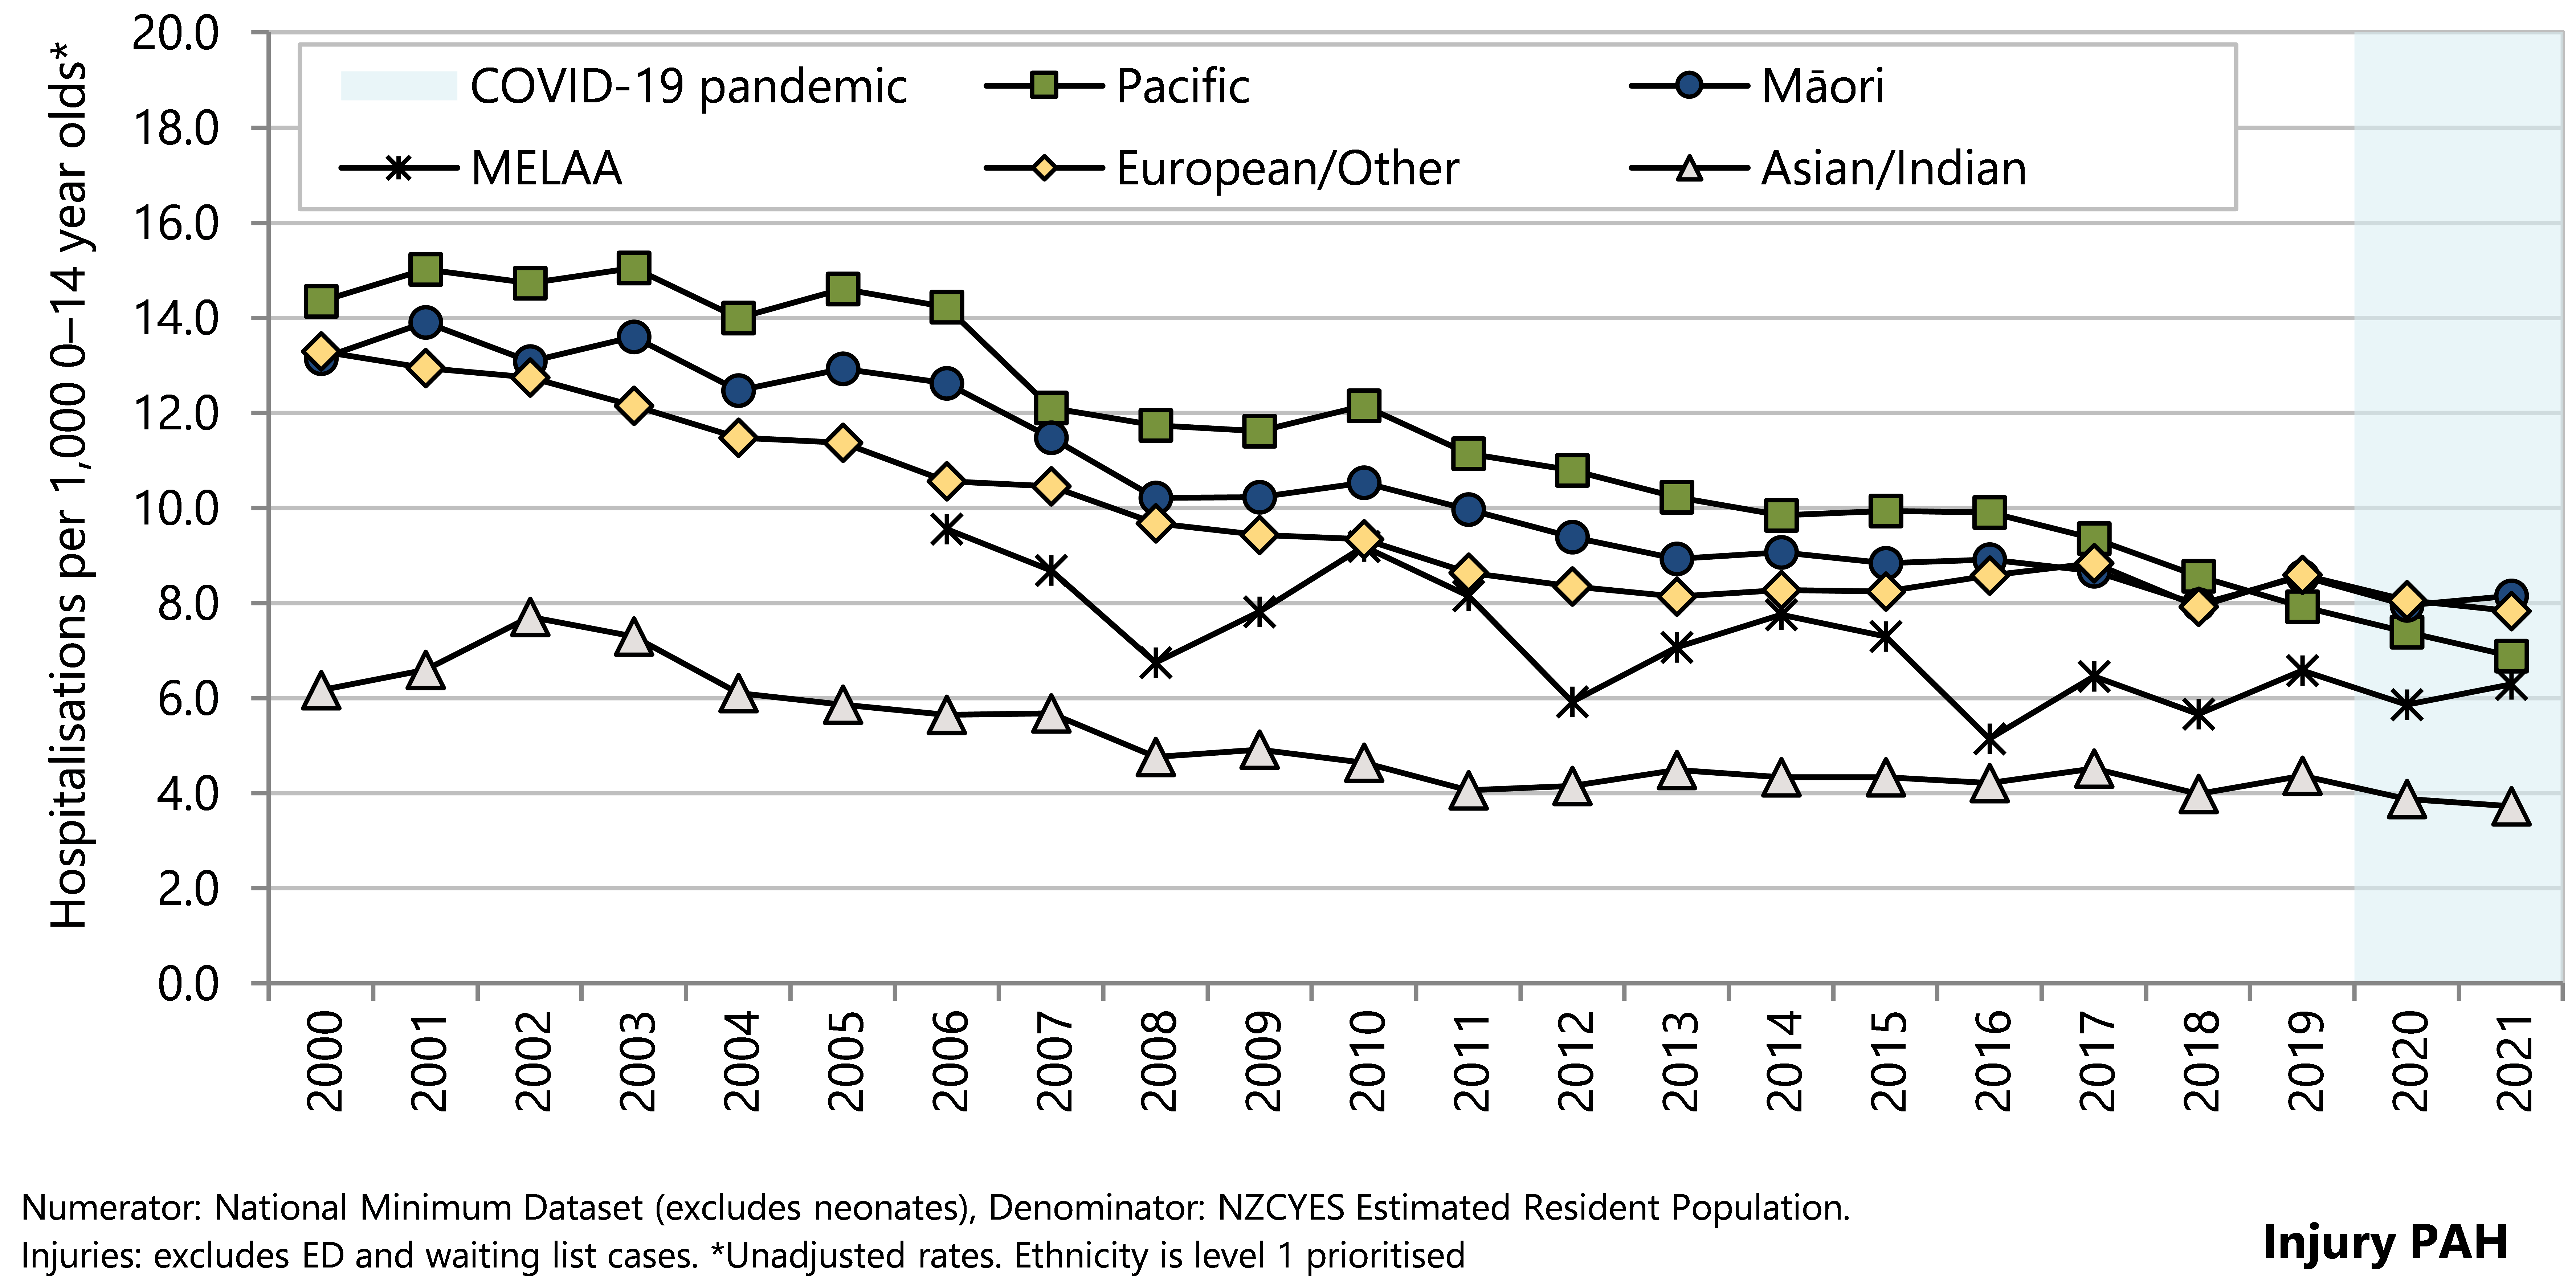
From 2017–2021 almost all (98.2%) of injury PAH in children aged 0–14 years had an unintentional injury code for the external cause ( Table 9). Falls were the leading cause of injury PAH, accounting for over half of all injury PAH. Inanimate mechanical forces (e.g. being struck by sports equipment, being crushed, jammed or pinched in a catch or door, and machinery-related injuries) accounted for around 20% of injury PAH. There were over 800 hospitalisations of under-14 year olds for intentional self harm in the same time period, and 340 hospitalisations for assault (including neglect or maltreatment). Collectively these intentional external causes of injury comprised 1.8% of all injury PAH in this age group (Table 9).
Table 9. Potentially avoidable injury hospitalisations, by external cause of injury, 0–14 year olds, Aotearoa 2017–2021
| Type of Injury | n | Rate per 1,000 0–14 year olds | 95% CI | % |
| Potentially avoidable hospitalisations of 0–14 year olds in New Zealand during 2017–2021 | ||||
| Injuries | ||||
| Unintentional | ||||
| Falls | 36,163 | 7.58 | 7.50–7.66 | 56.0 |
| Mechanical force (inanimate) | 12,665 | 2.66 | 2.61–2.70 | 19.6 |
| Transport accidents | 8,651 | 1.81 | 1.78–1.85 | 13.4 |
| Animate mechanical forces (animal-related) | 2,503 | 0.52 | 0.50–0.55 | 3.9 |
| Thermal injury (including fire) | 1,845 | 0.39 | 0.37–0.40 | 2.9 |
| Poisoning (accidental) | 1,544 | 0.32 | 0.31–0.34 | 2.4 |
| Overexertion and strenuous | 37 | 0.01 | 0.01–0.01 | 0.1 |
| Drowning or submersion | 10 | … | … | 0.0 |
| Other unintentional injuries | 6 | … | … | 0.0 |
| Intentional | ||||
| Intentional self-harm | 808 | 0.17 | 0.16–0.18 | 1.3 |
| Assault | 340 | 0.07 | 0.06–0.08 | 0.5 |
| Total | 64,572 | 10.09 | 10.00–10.18 | 100.0 |
| Numerator: National Minimum Dataset (excludes ED and waiting list cases), Denominator: NZCYES Estimated Resident Population. | ||||
|
| ||||
Immunisation
Article 24 of the Children’s Convention upholds the right to the highest attainable standard of health.58 Supporting a healthy childhood includes measures that can prevent and control infectious diseases, as both a poverty reduction and equity tool.73 Immunisation is a proven and cost-effective public health measure that is integral to this effort and to the United Nations Sustainable Development Goals.74
Childhood vaccines in the National Immunisation Schedule are free to all children in Aotearoa, offering a series of routine vaccinations that cover a wide range of diseases.75 Timely immunisation helps protect the individual child, and benefits the greater community when high coverage achieves herd immunity.76
Areas of higher socio-economic deprivation generally experience lower rates of vaccine coverage and a higher burden of vaccine preventable diseases.77 The inequity compounds. For example, one harmful effect of crowded housing is the increased risk of household transmission of infectious diseases.78 While some missed vaccinations can be attributed to faltering demand or parental refusal, the reasons are multifactorial and include the social determinants of health.79 Several factors contributed to falling vaccination rates during the COVID-19 pandemic including uneven access or late enrolments of newborns to primary care, extra workloads on vaccination outreach services, particularly for highly-mobile populations, healthcare resources being diverted to COVID-19, and people and systems working at capacity. There may also be reluctance to bring well children into a medical centre when COVID-19 case numbers are high (Manatū Hauora personal communication November 2022).
In 2021, the Ministry of Health introduced the Health System Indicators framework and dashboard as a new approach to measuring the performance of the health sector. The immunisation rates for children at 24 months of age is one of the two indicators chosen for the priority of ‘improving child wellbeing’.80
This section reports on immunisation coverage in children up to the age of five years.
Data sources and methods
Indicator
Proportion of children fully immunised at each milestone age
Data source
National Immunisation Register (NIR) https://www.health.govt.nz/our-work/preventative-health-wellness/immunisation/immunisation-coverage/national-and-dhb-immunisation-data
Additional information
Milestone ages for vaccination are: 6 months, 8 months, 12 months (1 year), 18 months, 24 months (2 years), 54 months, and 5 years. Parents are able to opt out of having their child’s immunisation information stored in the NIR. Children are fully immunised when they have received all of the target immunisations on the National Childhood Immunisation Schedule for their age.
Details on which vaccines children receive and when can be found in the New Zealand Immunisation Schedule: https://www.health.govt.nz/our-work/preventative-health-wellness/immunisation/new-zealand-immunisation-schedule
Figure 67 presents the proportions of infants and children fully immunised at 8 months , 24 months, and 5 years old. Immunisation rates at age 8-months increased from 2011 reaching 92.2% in 2017 before a steady decline to the lowest level of 85.7% in 2021/22. Immunisation rates for 24-month-olds were over 90% for nine years until 2018/19, with a fall to 88.3% in 2020/21 and further decline to 85.7% in 2021/22, coinciding with disruptions related to COVID-19. Fully immunised rates for 5‑year-olds increased from 67.0% in 2009/10 to 88.9% in 2019/20, with a decline to 82.8% in 2021/22 coinciding with the COVID-19 pandemic response, including lock-downs and redeployment of the vaccination workforce to contact tracing and other tasks.
Figure 67 . Immunisation coverage, by milestone age, Aotearoa 2008/09–2020/22
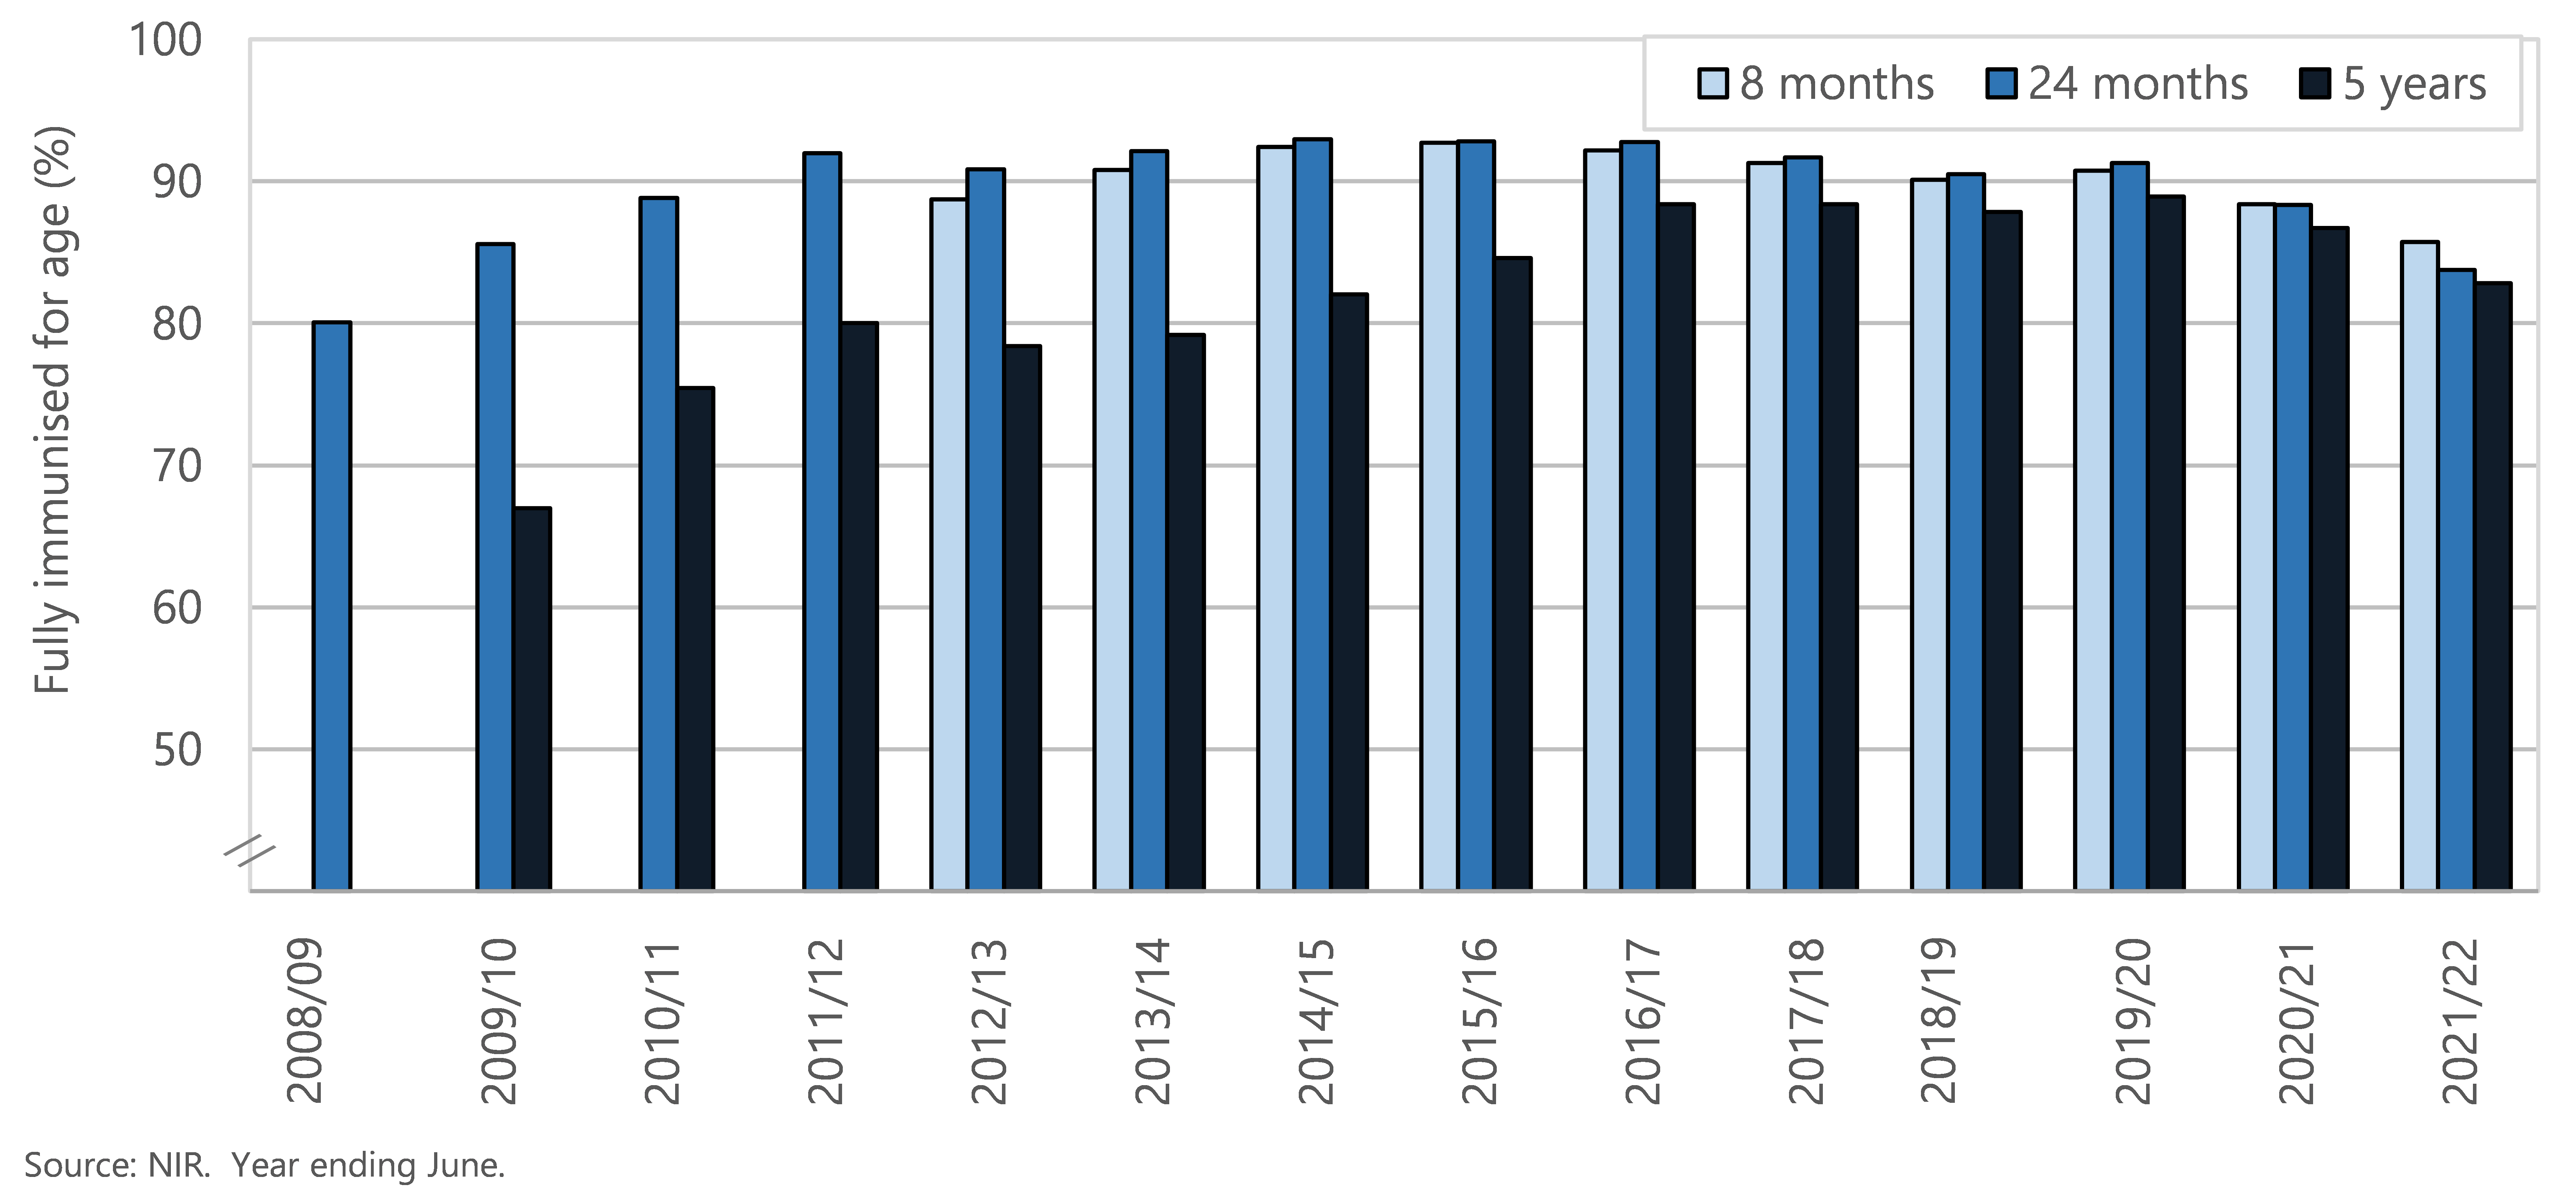
Figure 68 and Figure 69 present the proportions of fully immunised 8-month-olds and 5-year-olds by ethnicity and by deprivation score.
Over the last six years, there has been a marked decline in immunisation rates for 8 month old children of Māori ethnicity and in high deprivation areas. The only ethnic group to sustain immunisation rates in 2019/20 to 2021/22 was the Asian group, who consistently achieved the Ministry of Health’s target of 95% immunisation coverage. In 2021/22 the 8 month immunisation rates were 72.1% for tamariki Māori, 84.2% for Pacific children, 96.5% for Asian and 89.0% for NZ European ( Figure 68). The proportion of 8-month-olds fully immunised in areas with high deprivation scores has been consistently lower than the proportion in less deprived areas and this gap increased from 2016/17 to 2021/22.
Figure 68 . Immunisation coverage at 8 months of age, by ethnicity and NZ Deprivation Index quintile, Aotearoa, years ending 30 June 2014–2022
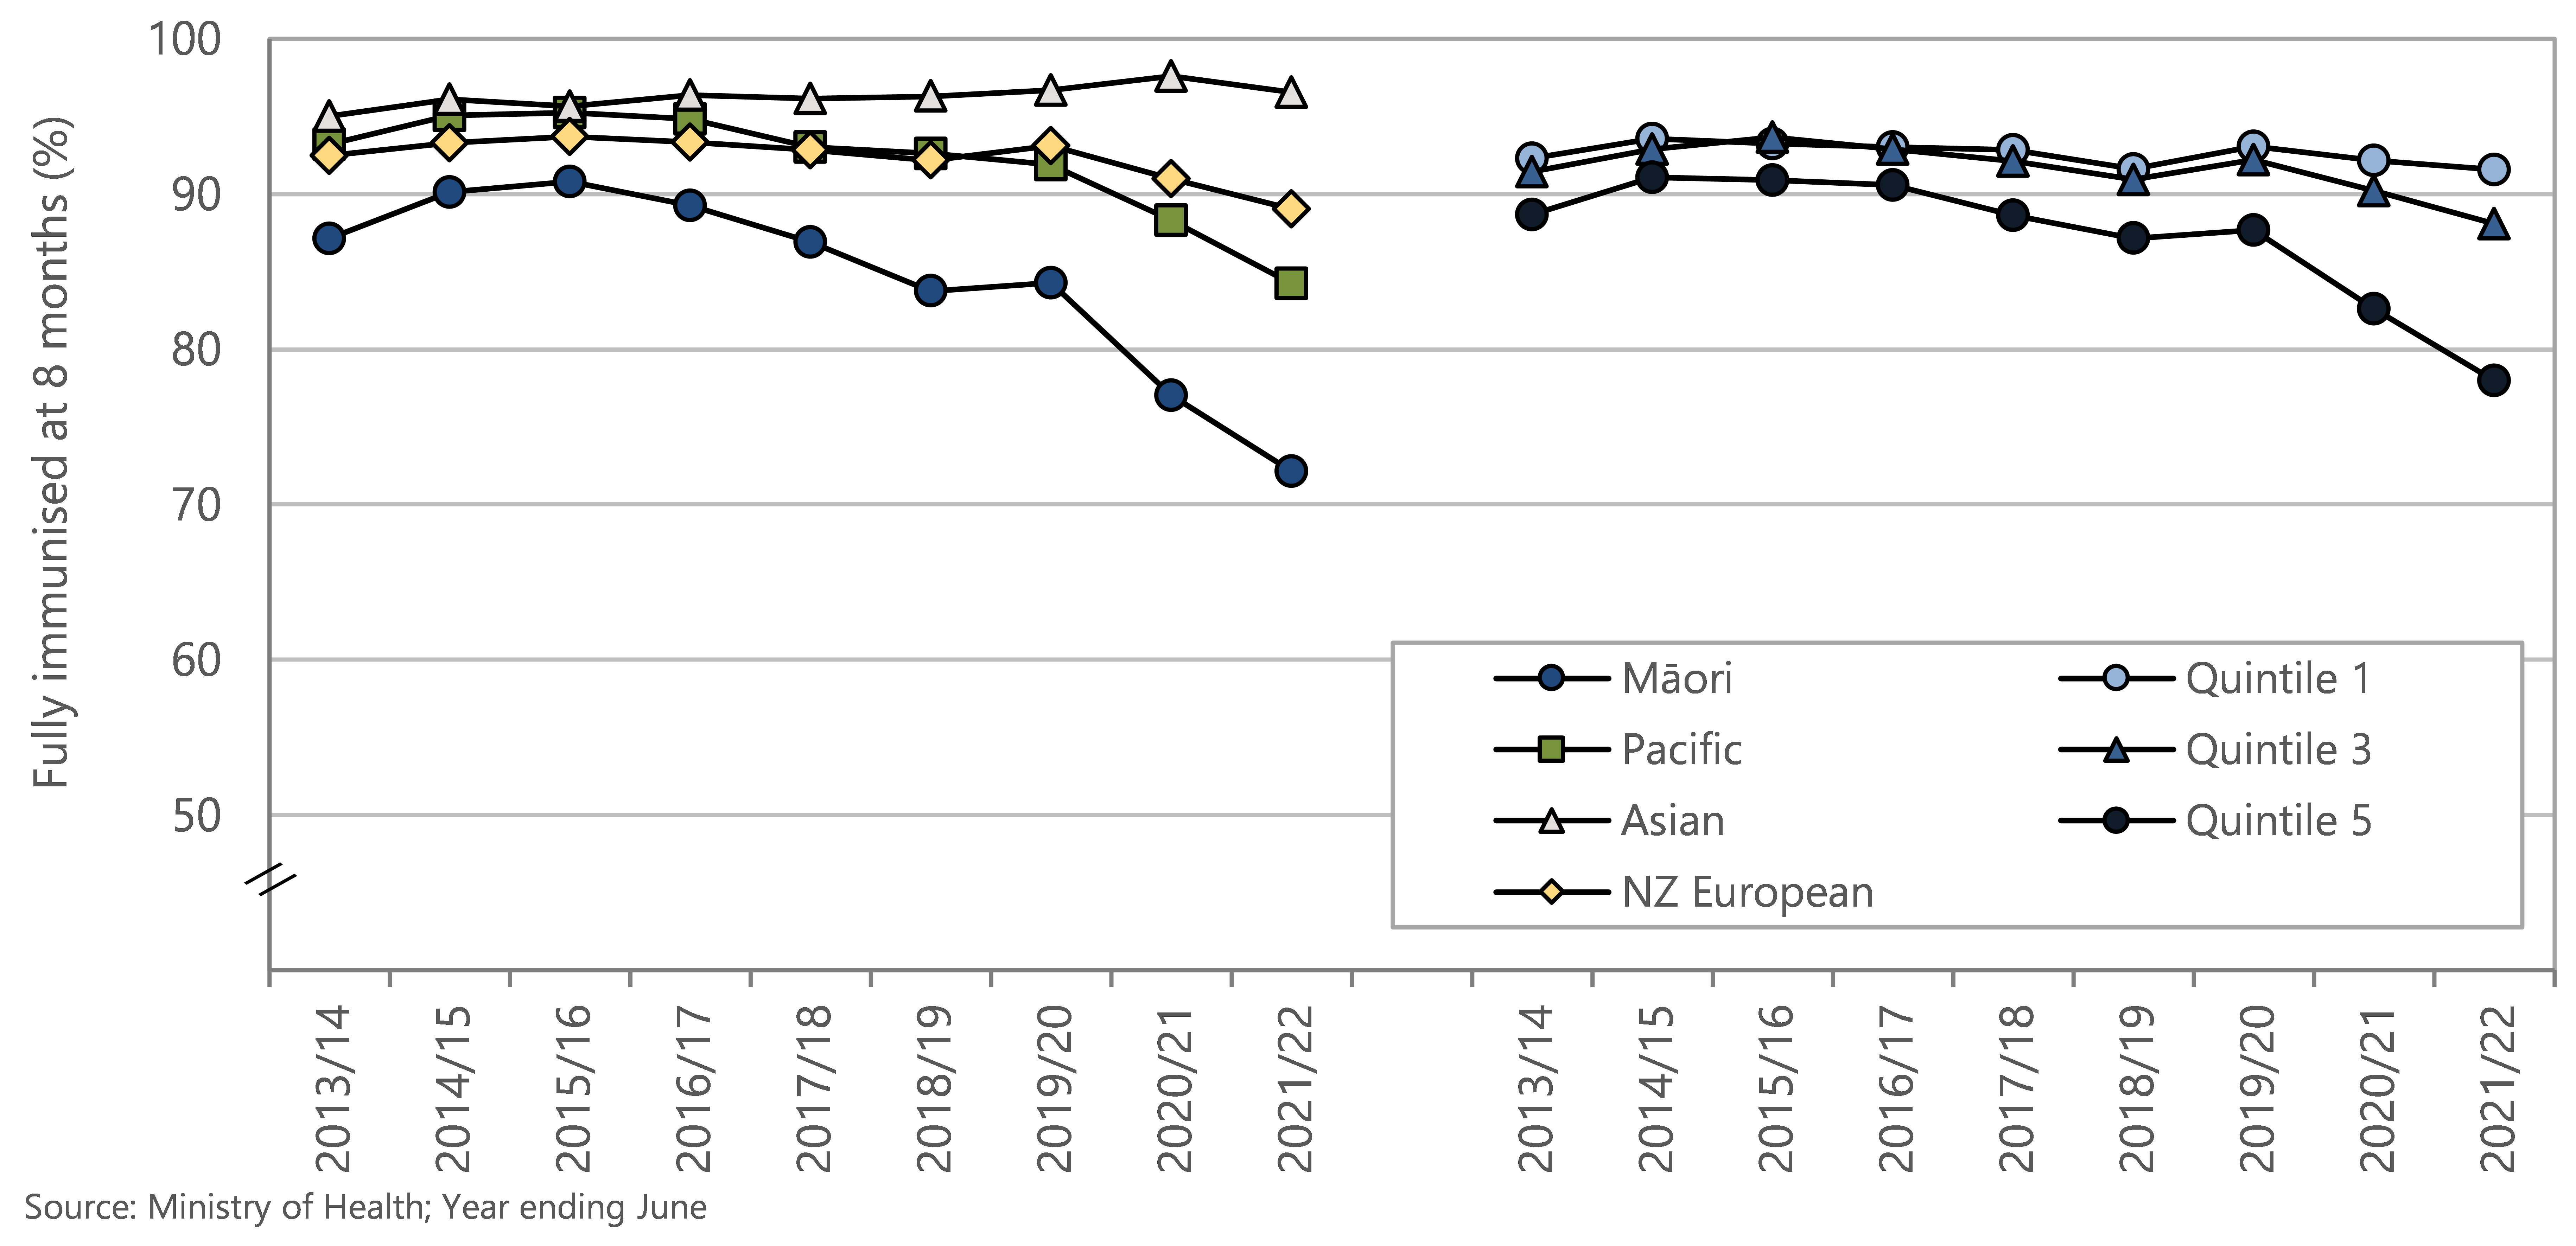
Up until 2020 immunisation rates for 5-year-olds gradually increased for all ethnic groups and deprivation scores. In the last six years Māori immunisation rates for 5-year-olds have been significantly lower than those for other ethnic groups. In 2021/2022, 73.5% of Māori 5-year-olds were fully immunised, compared to 82.6% of Pacific children, 88.9% Asian, and 86.1% NZ European. The proportion of 5-year-olds fully immunised in areas with high deprivation scores has been consistently and increasingly lower than the proportion in less deprived areas.
Figure 69 . Immunisation coverage at 5 years of age, by ethnicity and NZ Deprivation Index quintile, Aotearoa, year ending June 2014–2022
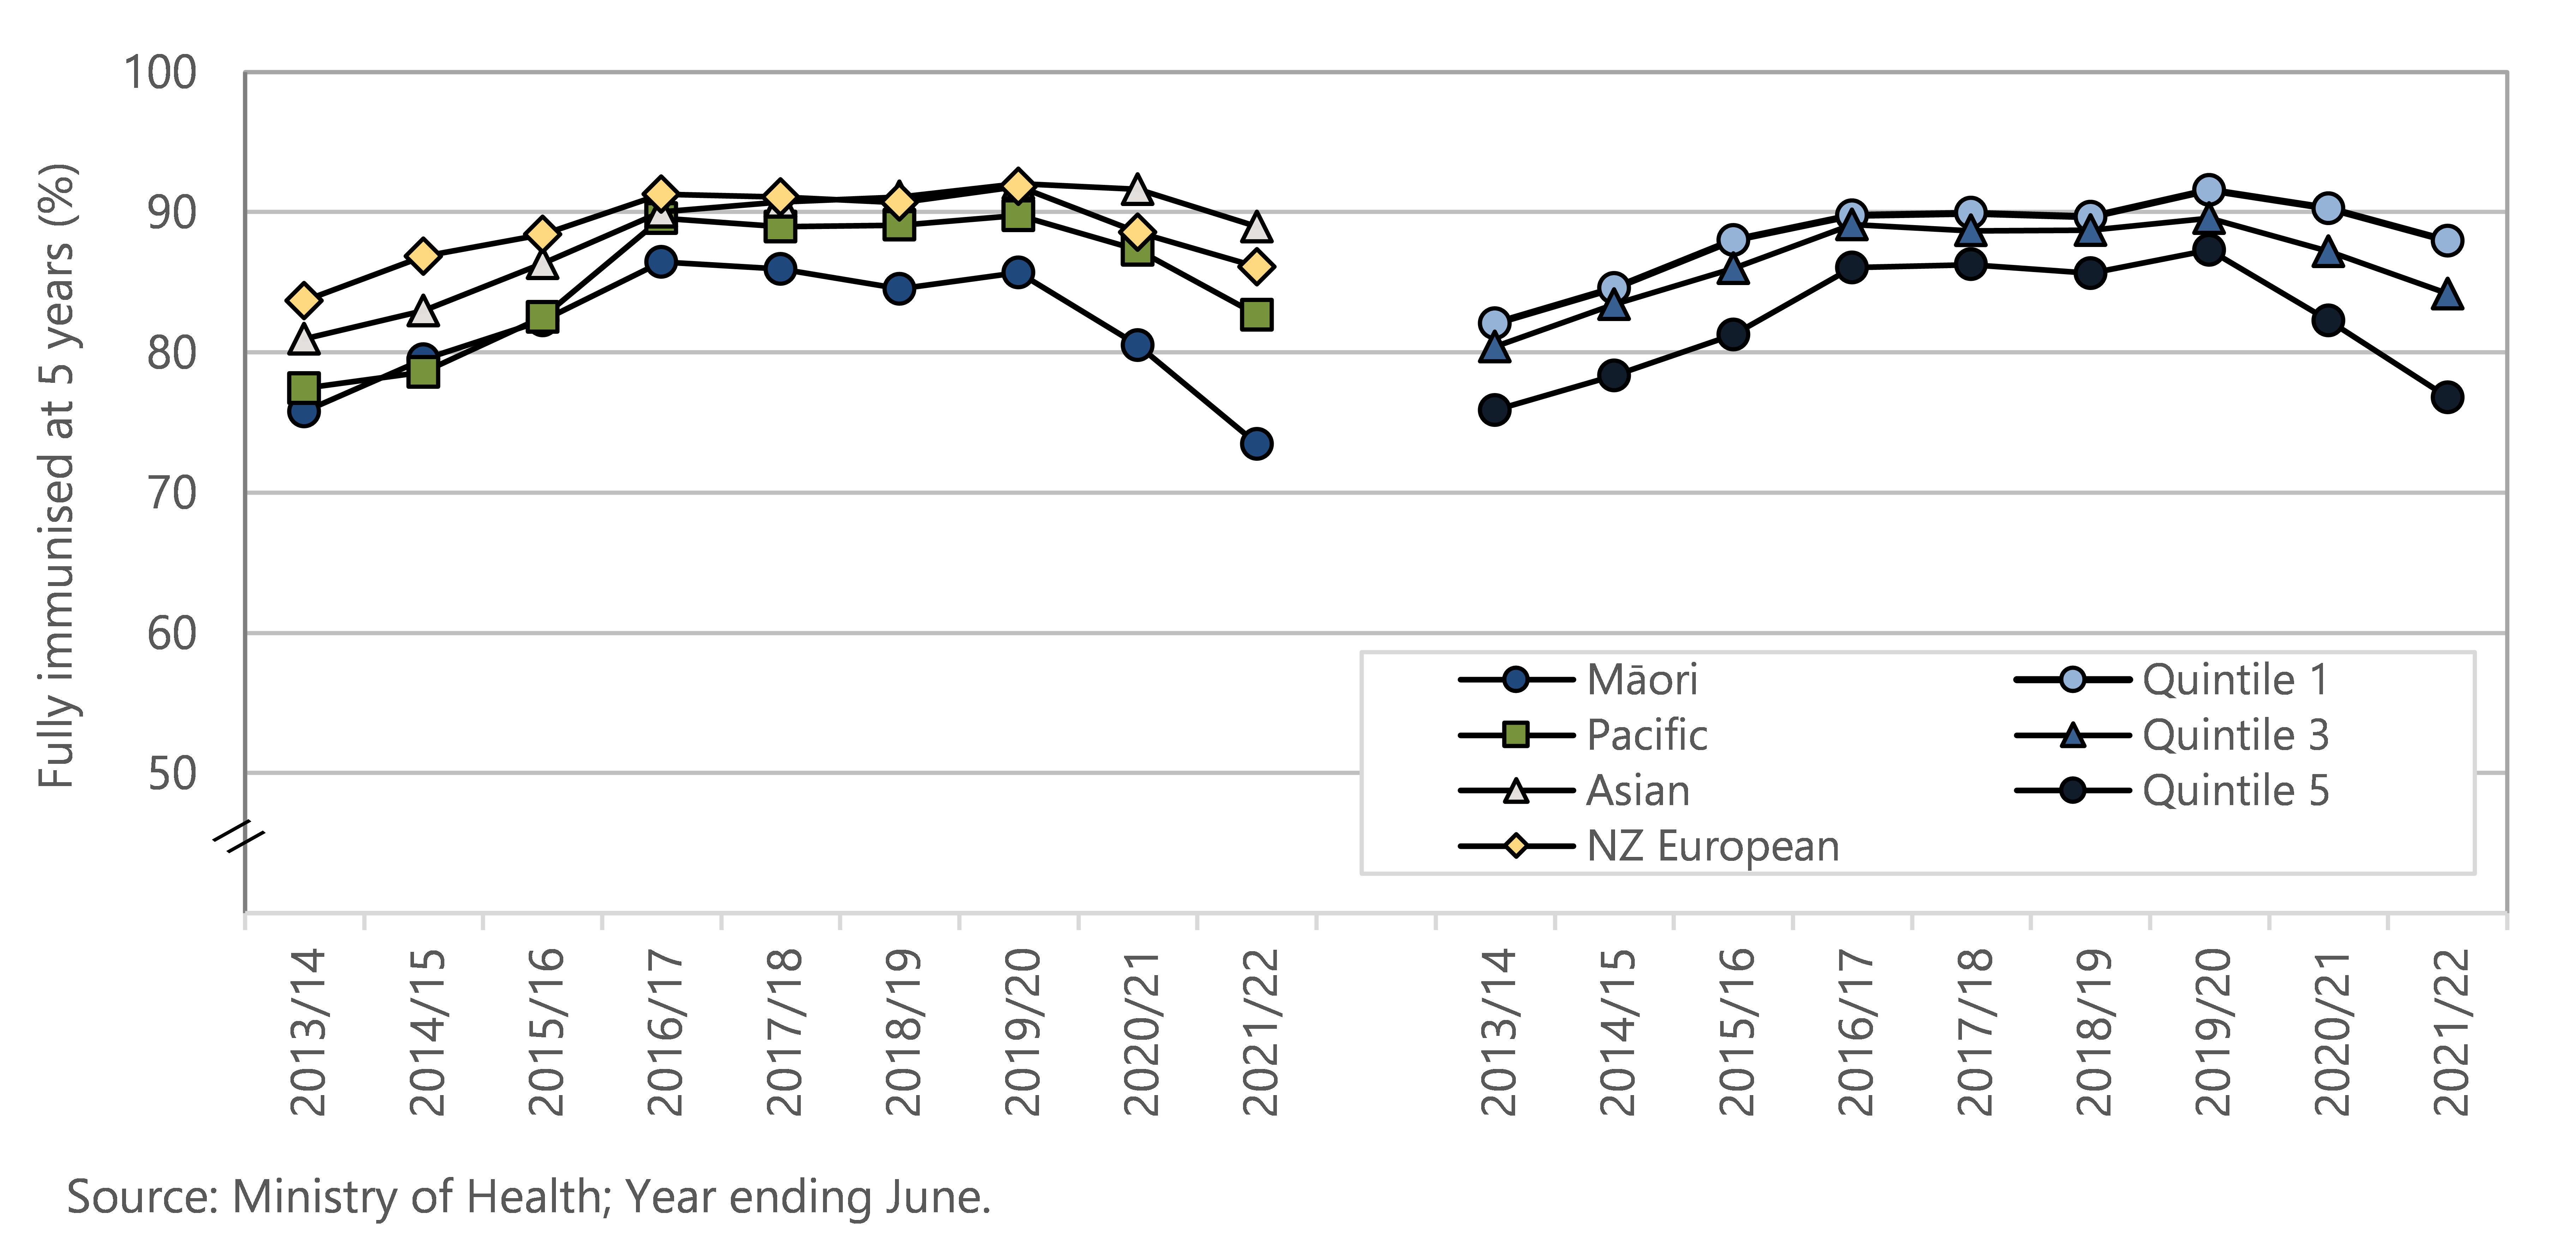
Figure 70 . Fully immunised and immunisation declined, by milestone ages, Aotearoa, year ended June 2022
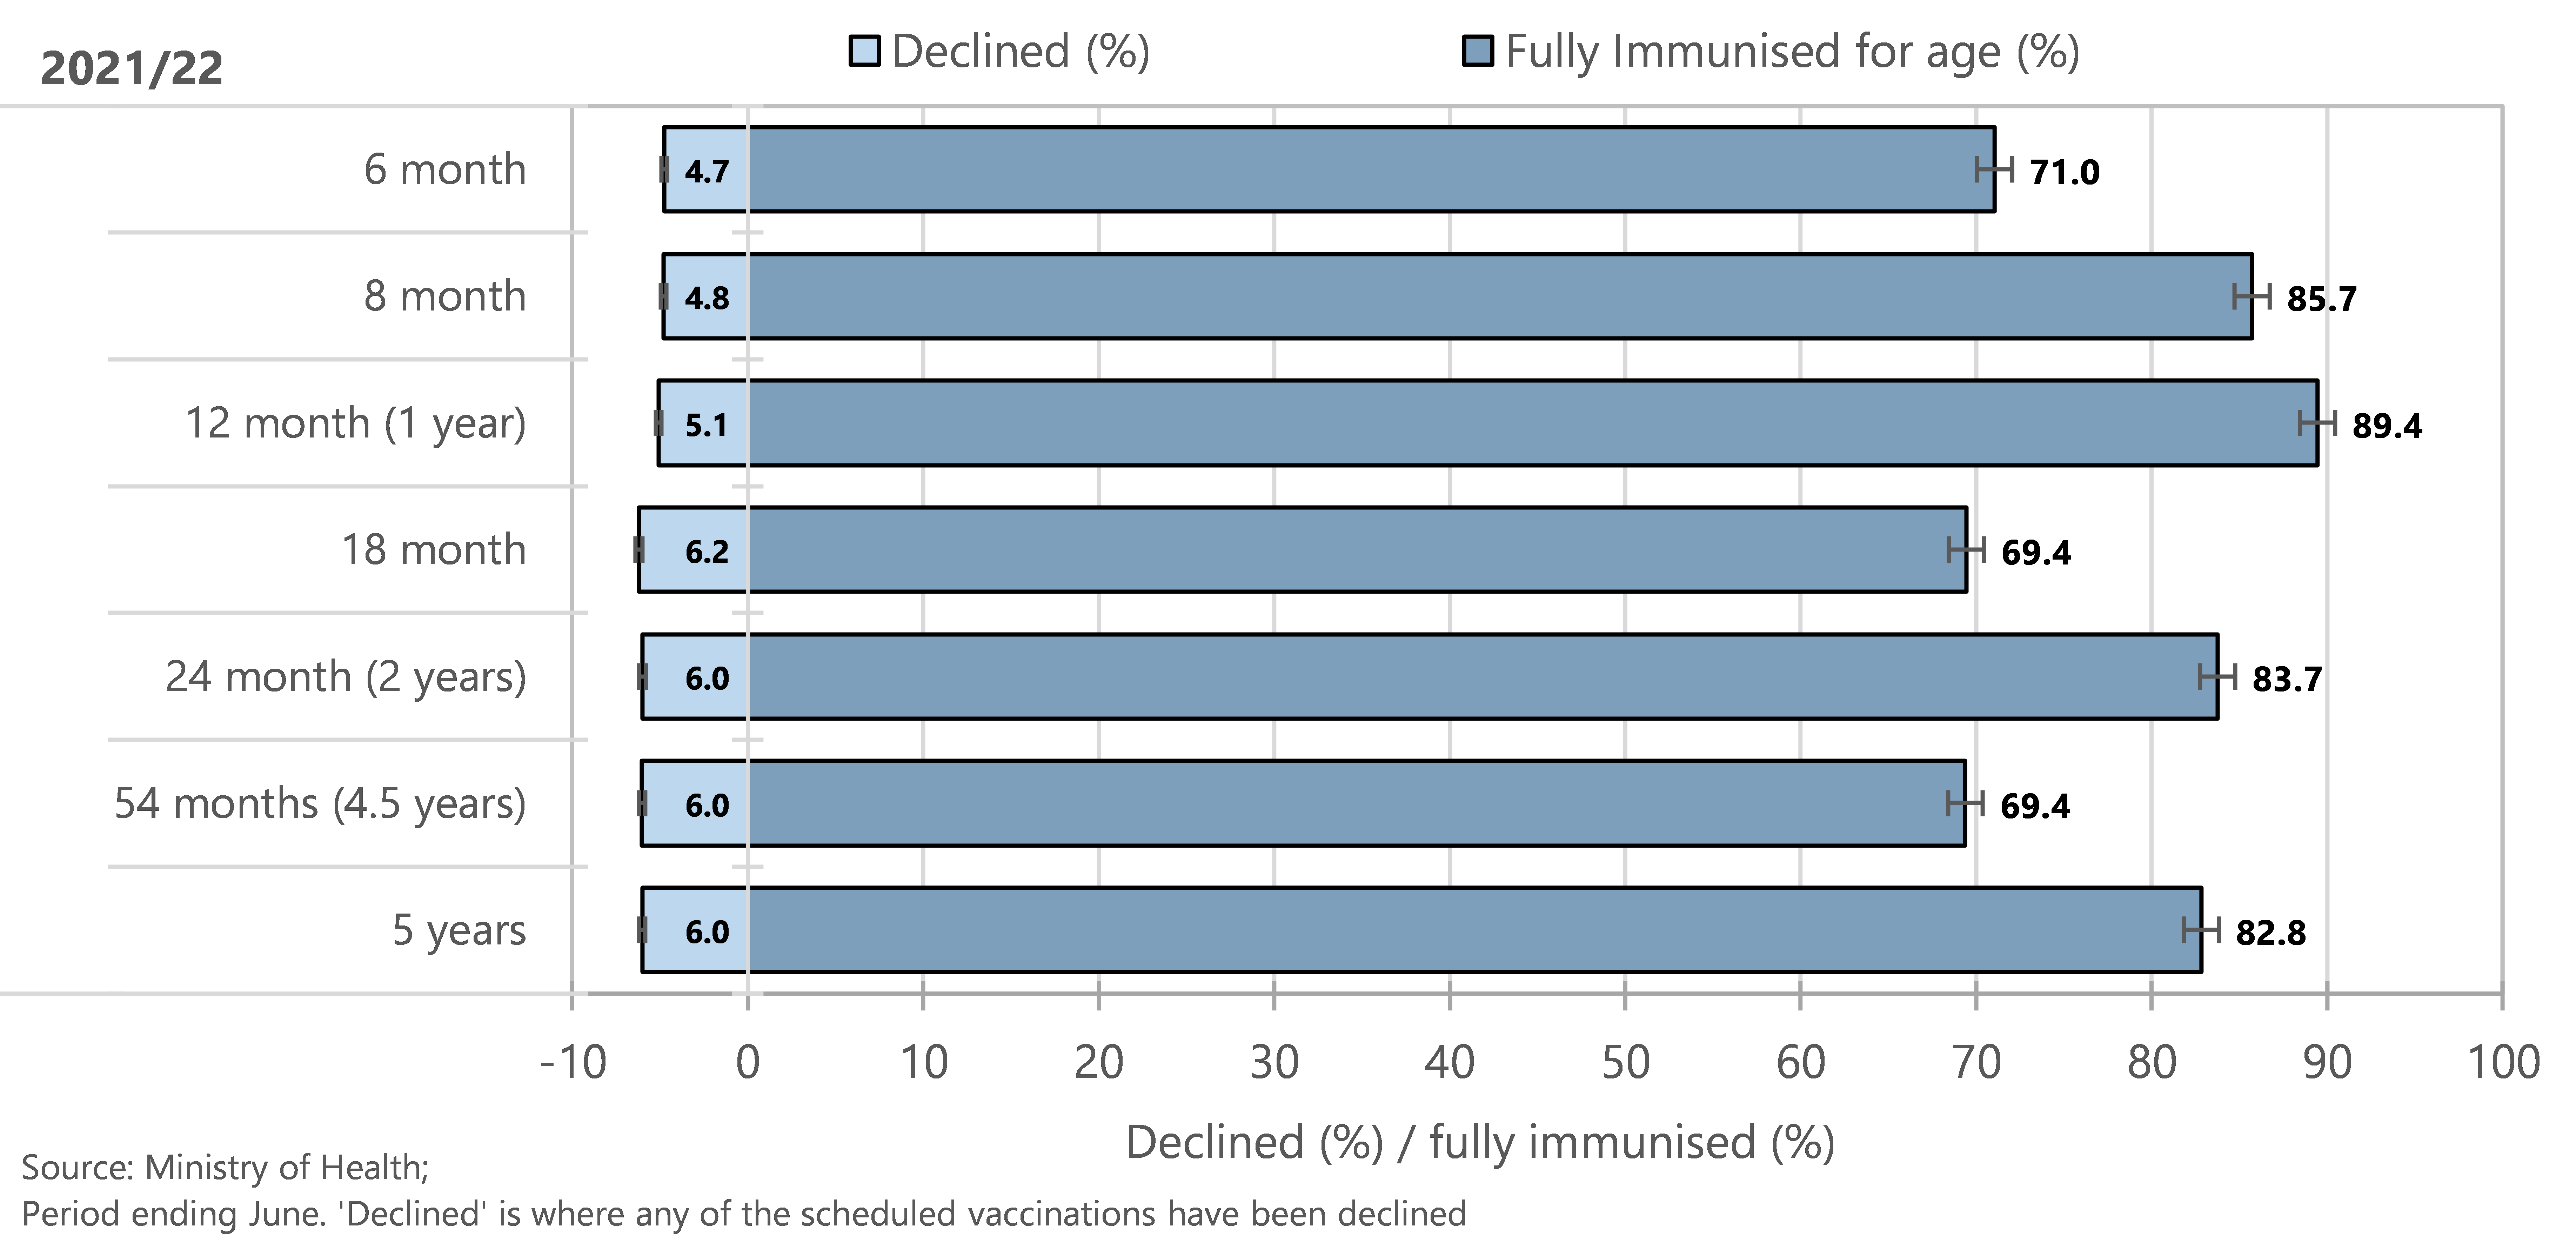
Figure 70 shows that, at each milestone age, around five to six percent of New Zealand children have parents who decline immunisation. The proportion who are fully immunised at the different milestone ages varies, but is highest for 12-month-olds and lowest for one-and-a-half and four-and-a-half-year-olds.
Reducing physical punishment
For all children in Aotearoa to be raised in a positive way their parents and caregivers need to feel confident about managing children's behaviour as part of a loving, nurturing relationship. 81 Physical punishment (e.g. hitting a child with an open hand) violates the rights of children and yet is among the most prevalent harmful traditional practices experienced by children around the world.82-84 Physical punishment is an ineffective method to change child behaviour, and is associated with a number of negative developmental outcomes.85-87 In 2007, New Zealand was the first English-speaking country to prohibit physical punishment, through an amendment to the Crimes Act. 88-90 Legal prohibition of physical punishment has been followed by swift and dramatic change in public opinion and attitudes in many countries, including New Zealand.82,90,91
This indicator presents information from the New Zealand Health Survey on attitudes of parents of 0–14-year-olds towards physical punishment, and the prevalence of 0–14 year olds experiencing physical punishment in the four weeks preceding the survey interview. Sample sizes in the most recent two years of the survey are smaller than usual due to pandemic-related disruptions to data collection.92
Data sources and methods
Indicator
Parental attitude to physical punishment
Children who received physical punishment in past four weeks
Definitions
Parents who agree there are certain circumstances when it's alright for parents to use physical punishment with children
Children aged between 0–14 years old have experienced physical punishment if their parent or caregiver reported having used “Physical punishment, such as smacking” when the child misbehaved during the past four weeks.
Data sources
Source: New Zealand Health Survey Annual Data Explorer 2020/21.
Indicator: Children who received physical punishment in past 4 weeks (0-14 years)
Numerator(s): Sum of the weights for the respondents in the group
Denominator : Sum of the weights for all respondents/population group
Additional information
Relevant NZ Health Survey question: physical punishment (C3.15 and C3.16a):
Question C3.15: Thinking back over the past 4 weeks, when [child’s name] misbehaved, which of the following, if any, have you done?
Made him/her go without something or miss out on something
Yelled at him/her
Explained why he/she should not do it
Physical punishment, such as smacking
Told him/her off
Sent him/her to the bedroom or other place in the house
Ignored his/her behaviour
Something else [specify] ______
My child has not misbehaved during the past 4 weeks
Question C3.16a: Using the scale on the showcard, to what extent do you disagree or agree with the following statement? There are certain circumstances when it’s alright for parents to use physical punishment, such as smacking, with children.
Strongly disagree / Disagree / Neither disagree nor agree / Agree / Strongly agree
Survey data (by financial year) is referred to by the year of data beginning/ending. For more information on the NZ Health Survey, please refer either to the Ministry of Health website ( https://www.health.govt.nz ) or to appendices in this report.
Figure 71 . Parental attitude to physical punishment in 0–14 year olds, by NZ Health survey year, New Zealand 2015/16–2020/21
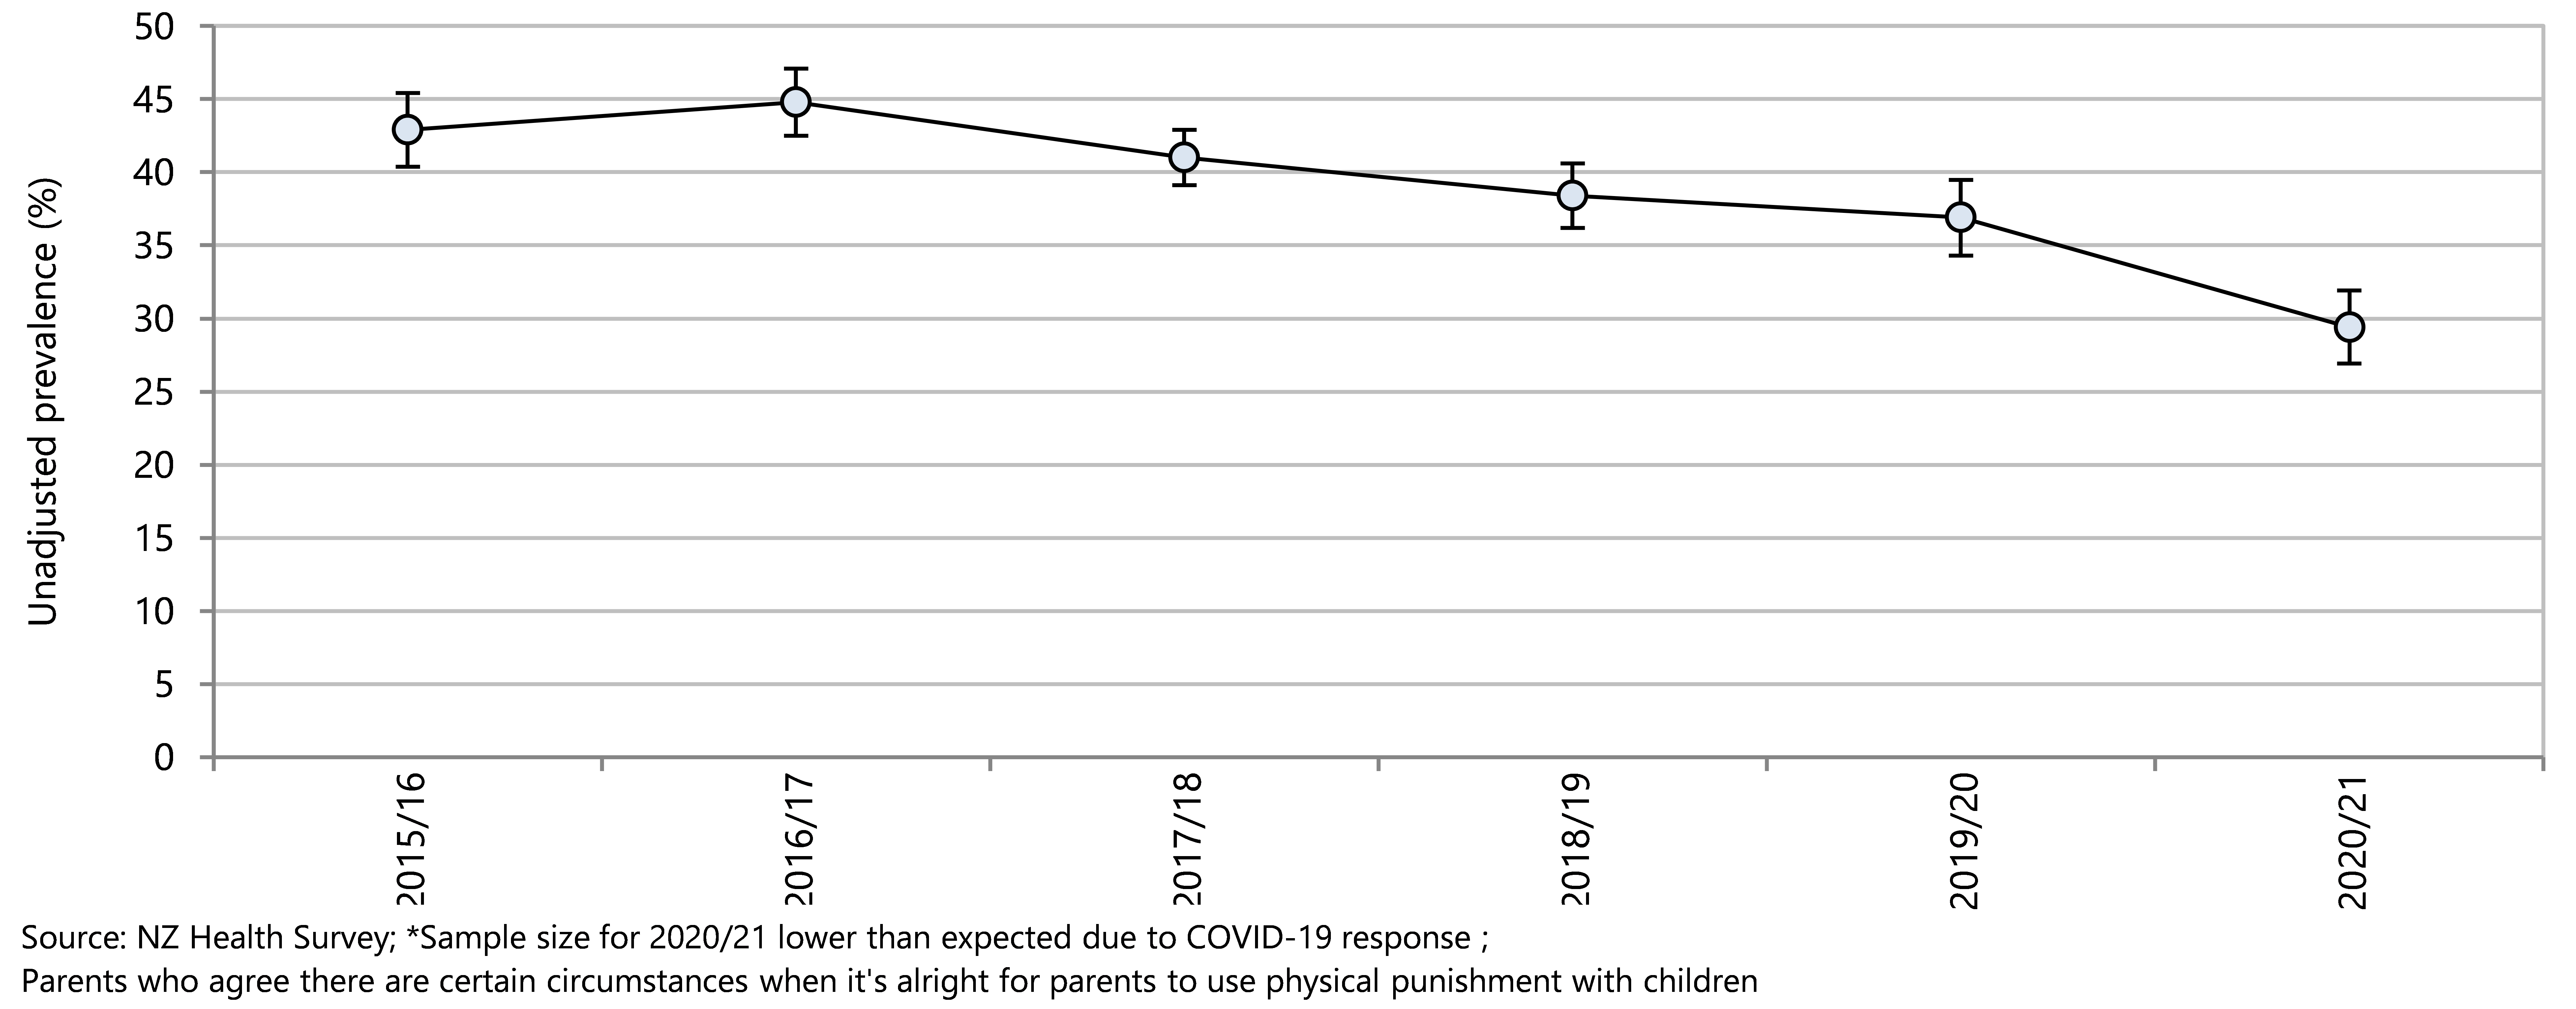
Since 2011/12 there has been an overall fall in the prevalence of children aged 0–14 years experiencing physical punishment in the previous four weeks (Figure 72). In 2020/21, 2.5% of children were reported to have received physical punishment compared to 7.4% in 2011/12.
The percentages of 0–14 year olds who received physical punishment in the previous four weeks are presented as unadjusted rates by demographic factor in Figure 73 and as adjusted rate ratios in Figure 74 . In the unadjusted analysis, although rates varied by each demographic factor, differences between demographic groups were mostly not statistically significant (Figure 73). In the adjusted analysis, rates of physical punishment were significantly higher for Māori children (compared to non-Māori children), and for Pacific children (compared to non-Pacific children) (Figure 74). Rates did not differ statistically between children living in the most deprived neighbourhoods (quintile 5) and those in the least deprived neighbourhoods in either unadjusted and adjusted analyses (Figure 73, Figure 74).
Figure 72 . Physical punishment in 0–14 year olds, by NZ Health survey year, Aotearoa 2006/07–2020/21
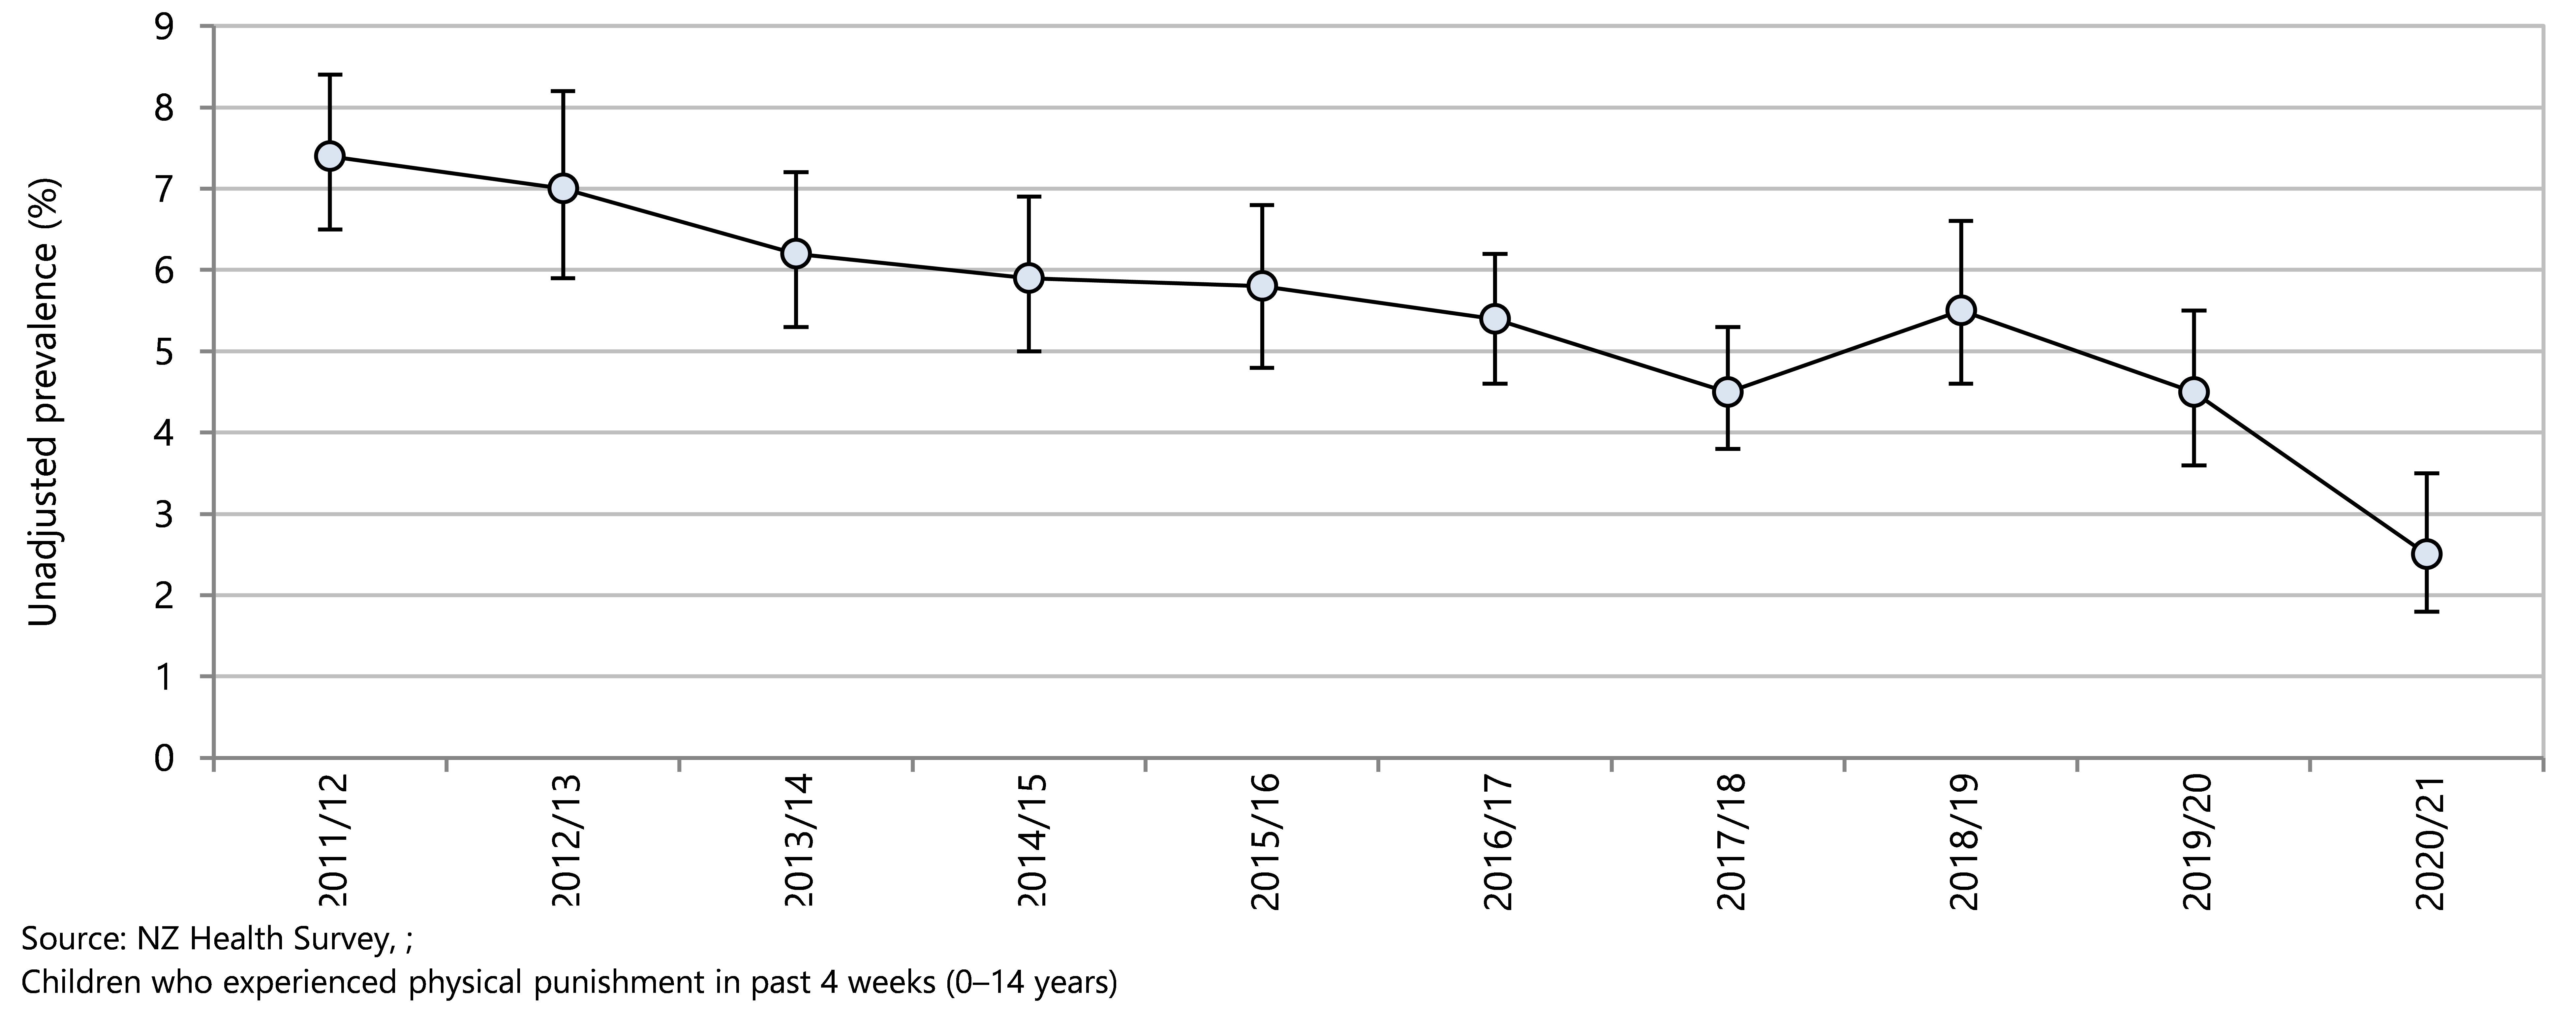
Figure 73 . Physical punishment in 0–14 year olds, by demographic factor, Aotearoa 2020/21
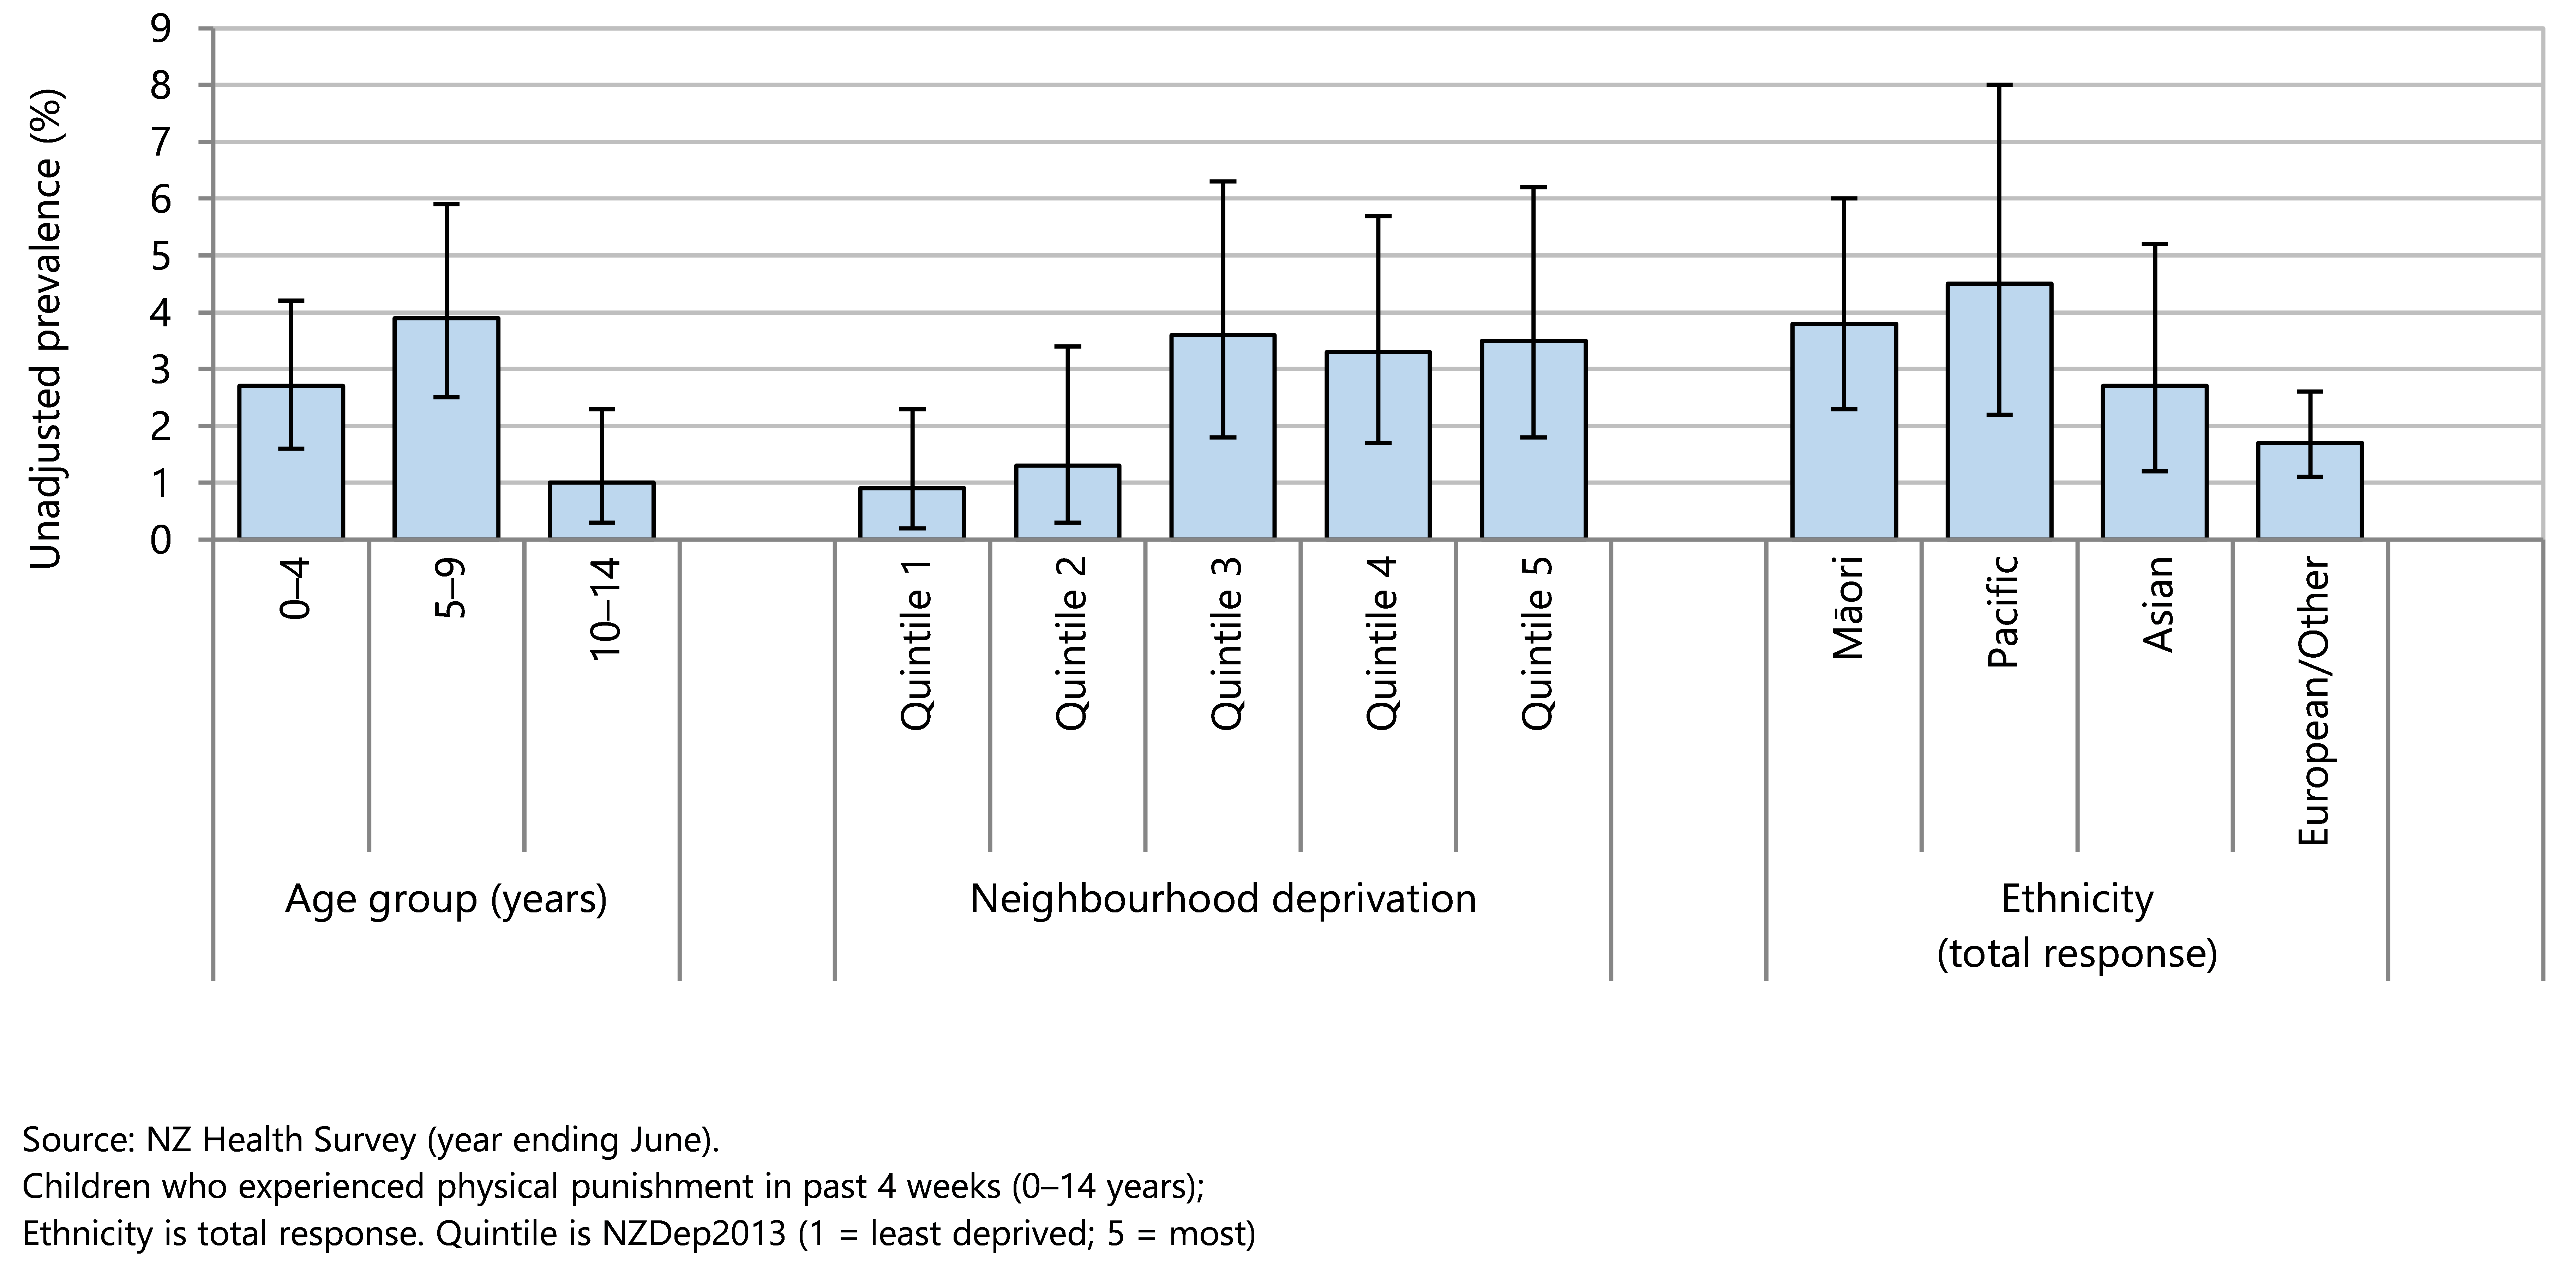
Figure 74 . Physical punishment in 0–14 year olds, by demographic factors, Aotearoa 2020/21
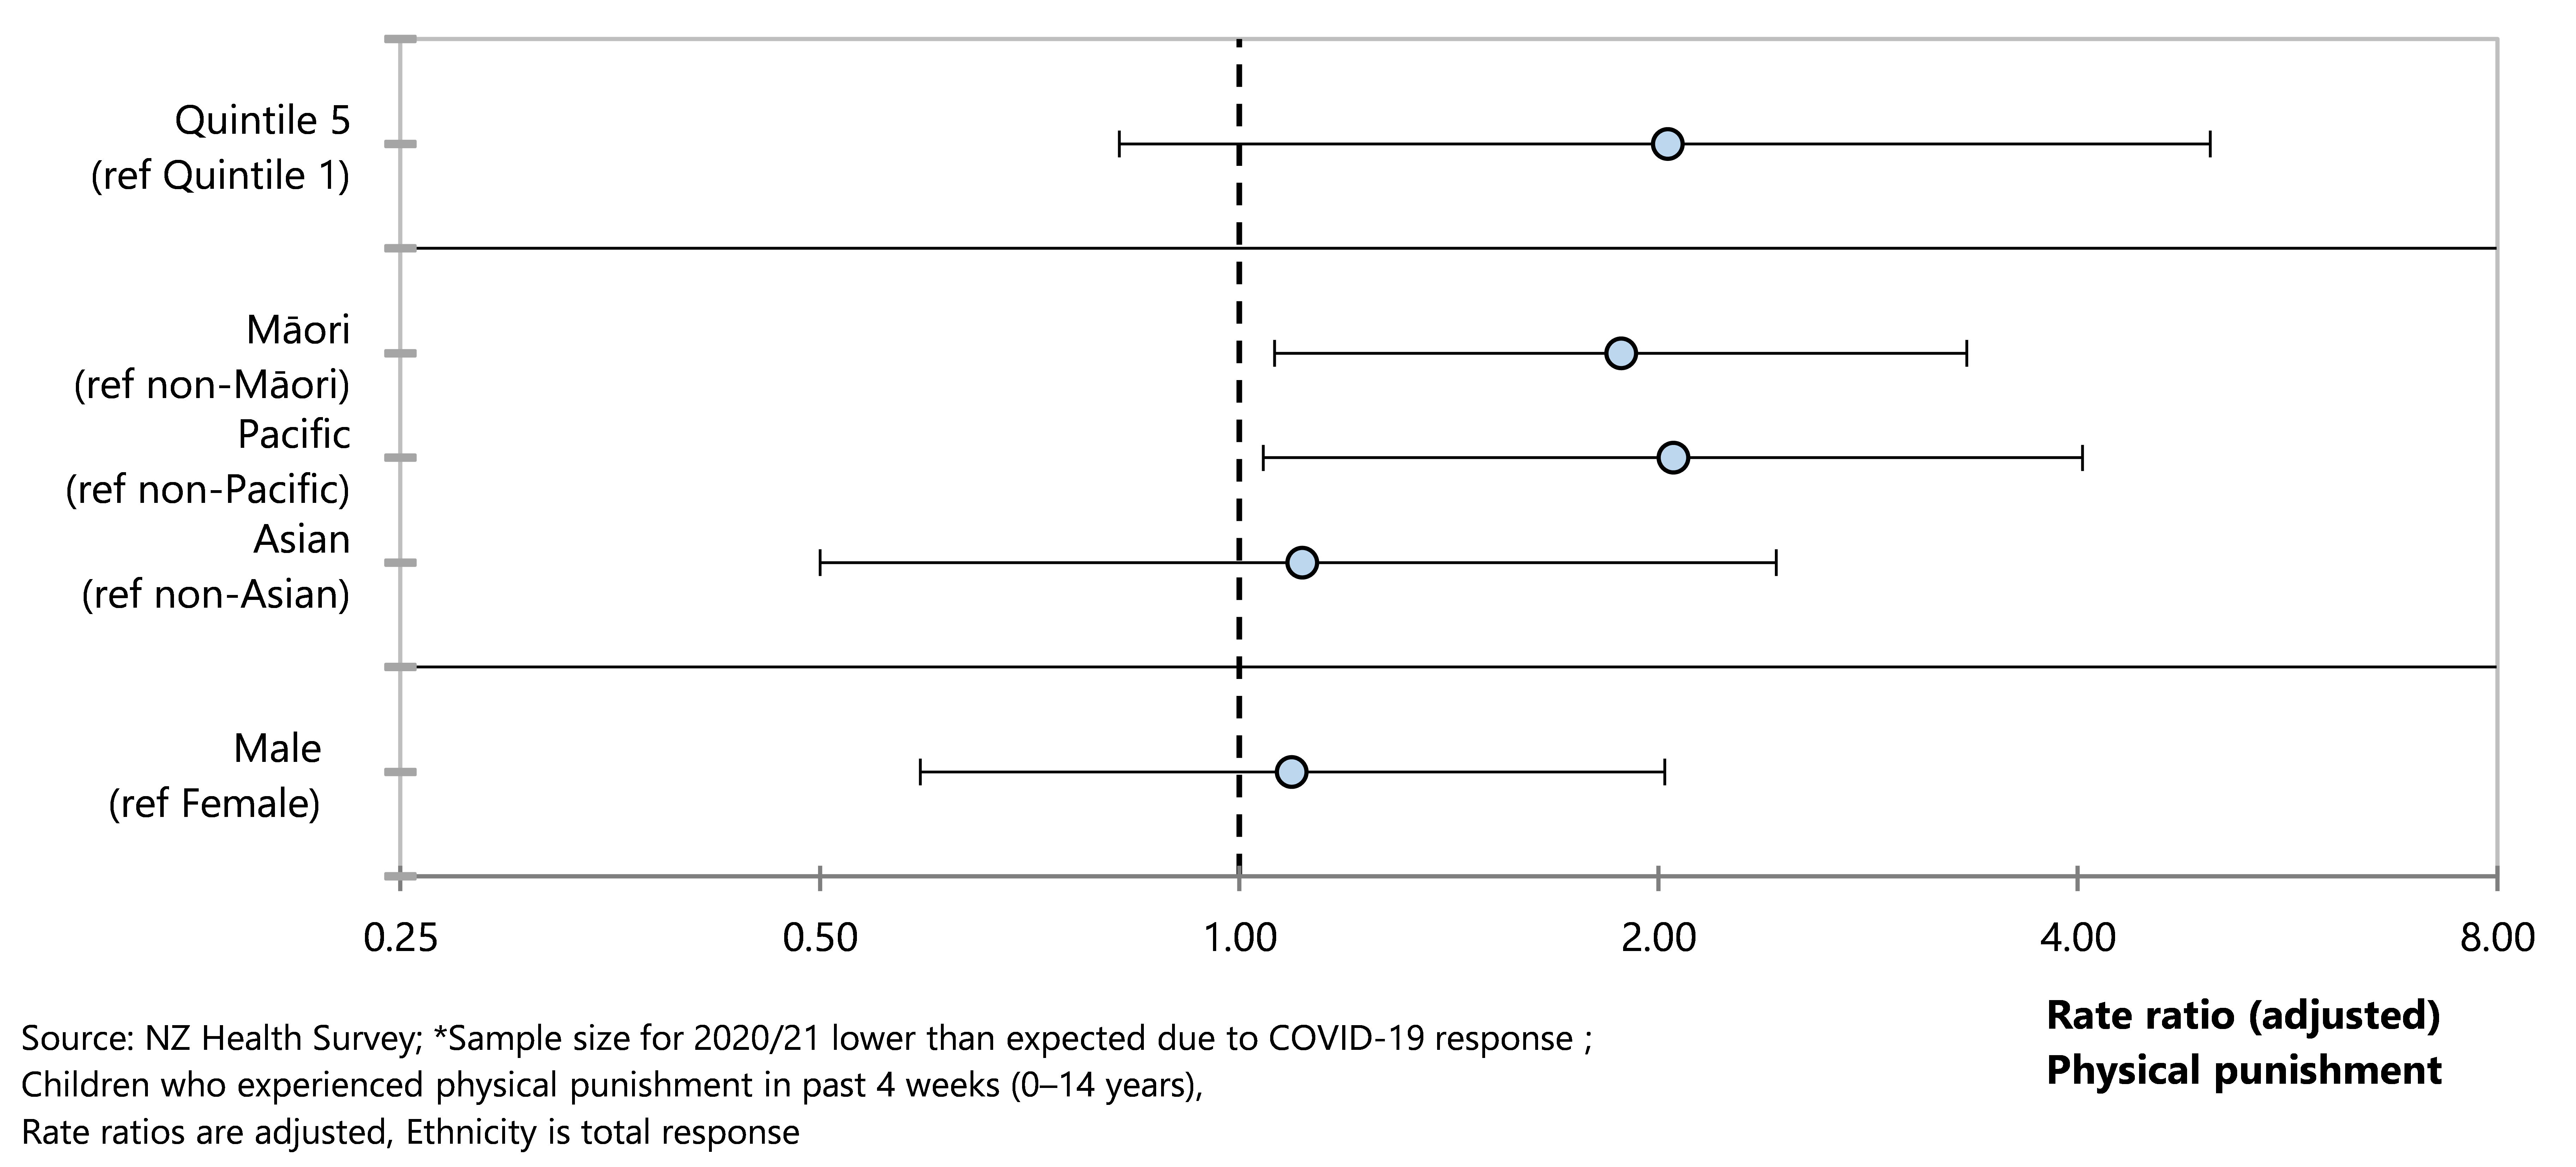
Care and protection
Oranga Tamariki receives reports of concern when someone believes that a child or young person has been harmed or is at serious risk of harm. These reports of concern are assessed by a social worker to determine if further action is required. Oranga Tamariki aims to support families, children and young people so that children and young people can be safely kept at home but if this is not achievable children or young people may need to be placed in care and protection custody.93
The relationship between care and protection concerns and the socioeconomic status of the area in which a child lives has been studied in Aotearoa New Zealand.94 While there is a strong correlation between socioeconomic status and care and protection concerns, there is also evidence of biases in the responses such as patterns of placements in response to substantiated findings. There is a need to apply an inequalities perspective to child protection, similarly to health inequities and develop a much more nuanced understanding of the dynamic relationships between deprivation and contact with the child protection system.94 Action is needed to recognise and address family poverty and its effects as a significant life stressor, to provide preventive services that are responsive to community and cultural needs, and to address biases in the system.94
The section reports on care and protection notifications, substantiated abuse findings, and children and young people in care and protection custody of the Chief Executive, using data from Oranga Tamariki.
Data sources and methods
Indicator
Numbers of Reports of Concern and proportion of Reports of Concern that require further action
Substantiated findings of abuse in children and young people notified to Oranga Tamariki
Children and young people in care and protection custody of the Chief Executive
Data source
Oranga Tamariki
Further information
For more information on Oranga Tamariki data please refer either to the Oranga Tamariki website https://www.orangatamariki.govt.nz/, or to the data source appendix in this report.
The total number of reports of concern (ROC) decreased overall from 2010/11 to 2021/22 ( Figure 75). A child or young person may have more than one notification in a year so the number of children who were the subject of ROC is lower than the total number of reports. In the year to 31 March 2022 Oranga Tamariki received 68,500 reports of concern about 50,800 distinct children. In the 2021/22 financial year Oranga Tamariki received reports of concern about 49,349 distinct children, of whom 29,298 were assessed as requiring further action (Figure 75). The proportion of reports of concern that required further action fell overall from 70% in 2010/11 to 59% in 2021/22.
Figure 75. Care and protection reports of concern, distinct children and distinct children requiring further action, Aotearoa 2010/11–2020/21
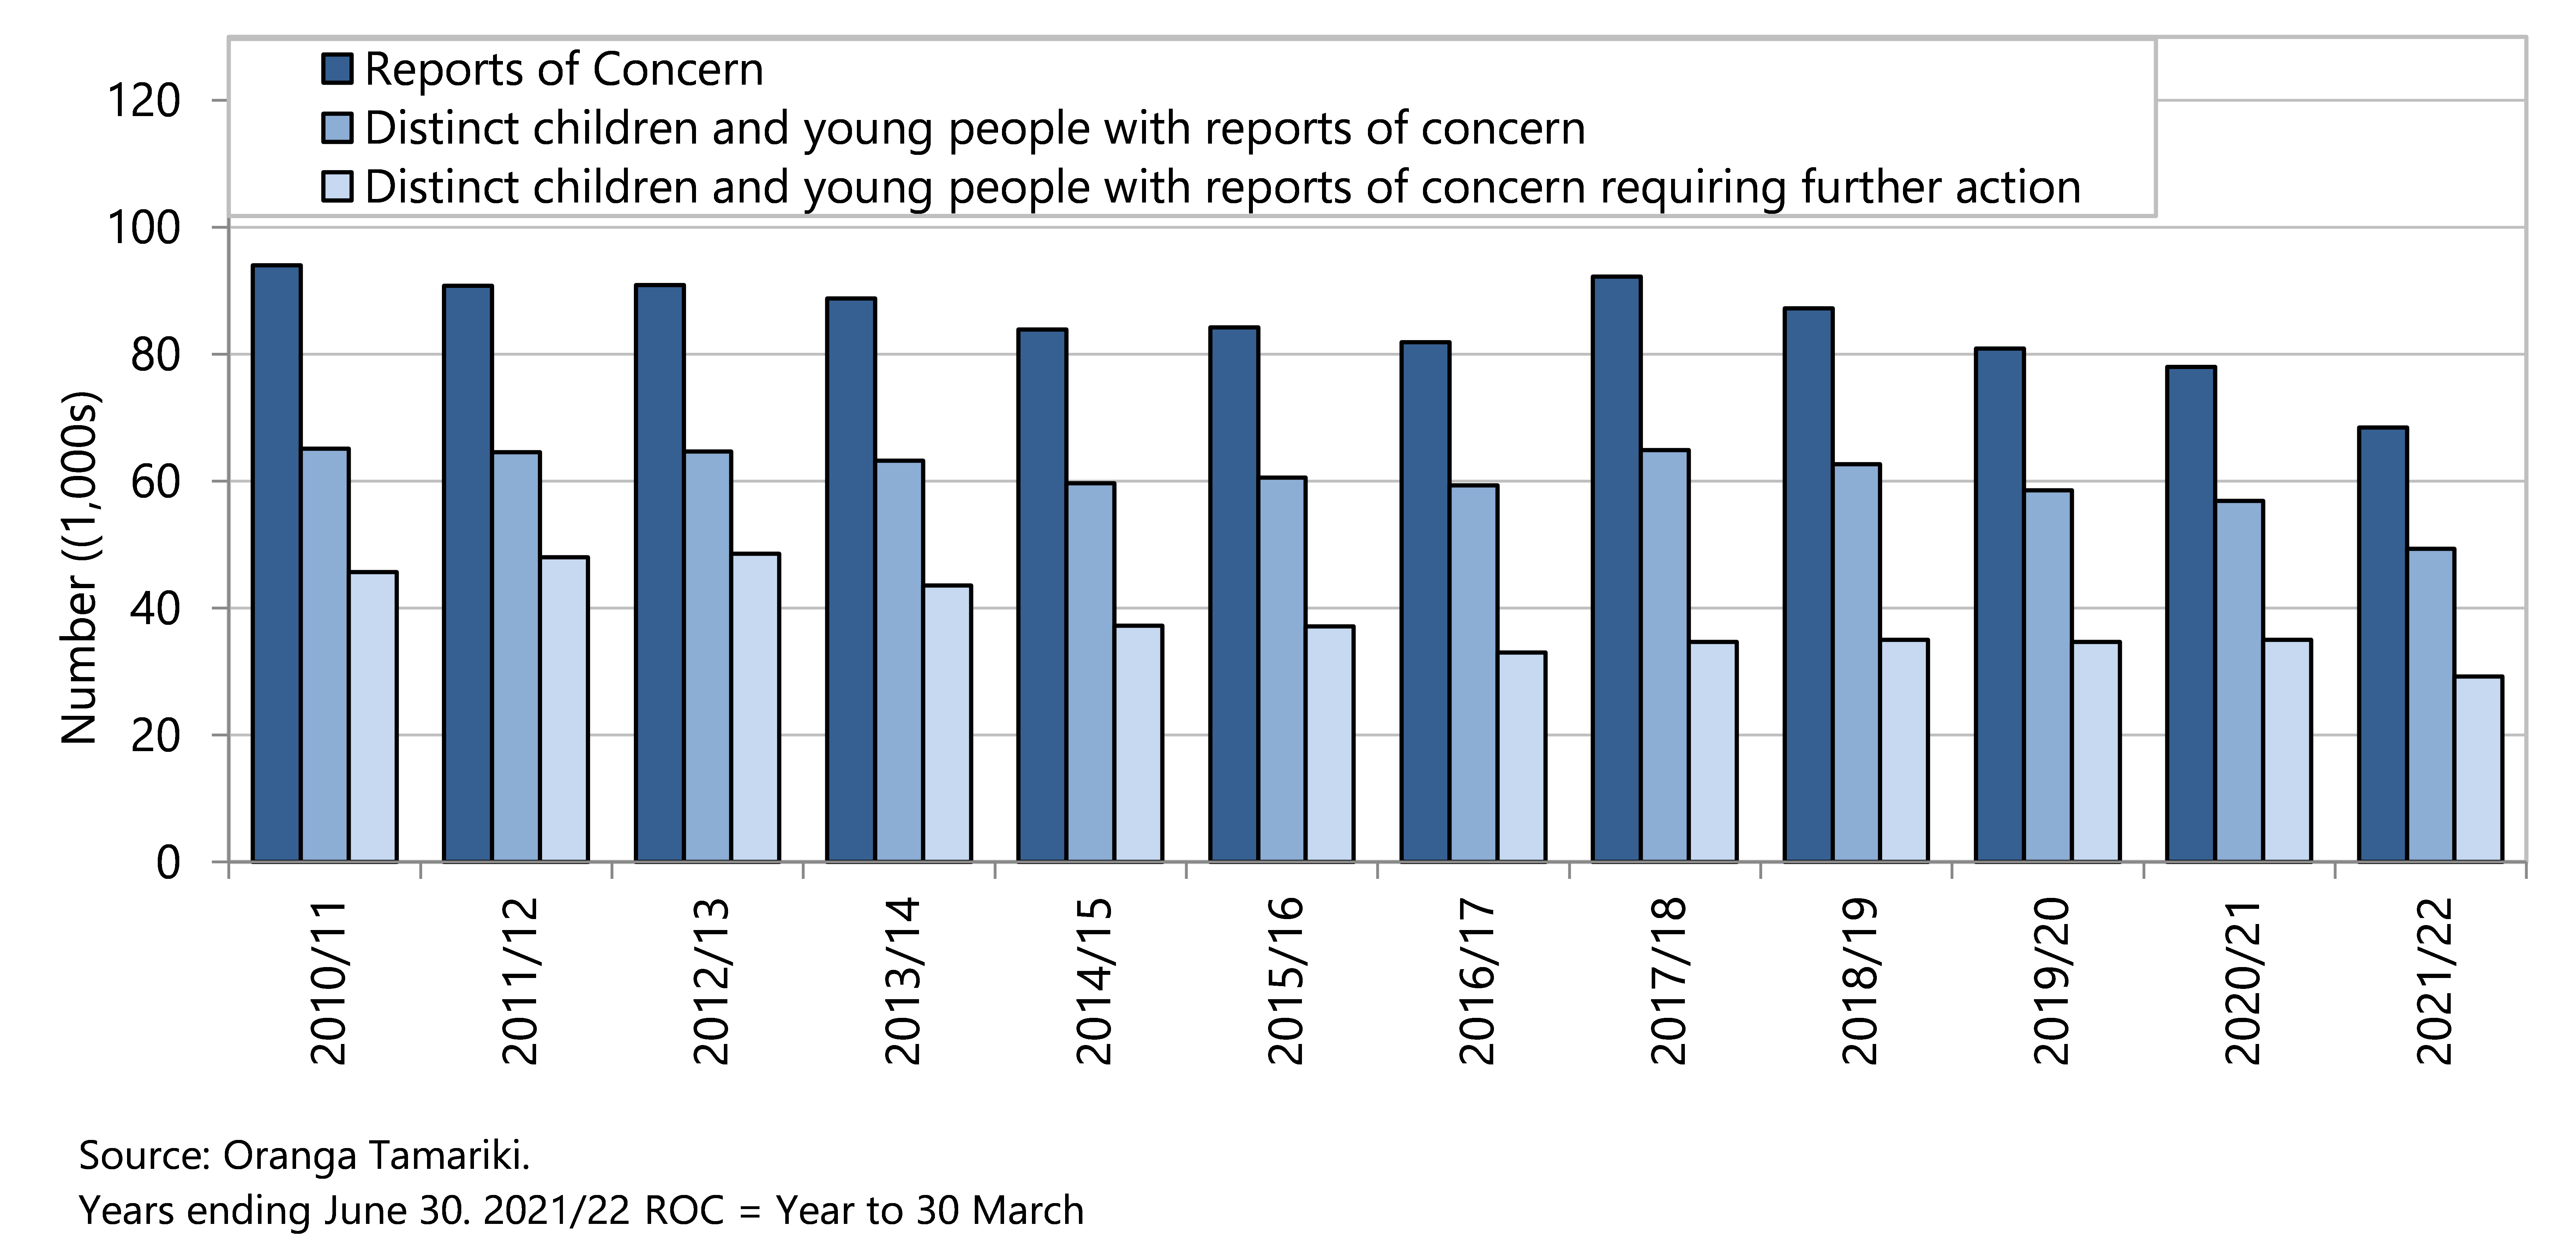
In 2021/22 abuse was found in 12,498 (37.2%) of investigations by Oranga Tamariki, other issues such as behavioural concerns, relationship problems or risk of self-harm were found in 2,585 investigations (7.7%), and abuse was not found in 18,491 investigations (55%). Oranga Tamariki note that some children may have two or more findings in one investigation or in one reporting period.
Since 2011/12 the most common type of substantiated abuse has been emotional abuse (Figure 76). In 2021/22, emotional abuse was found in 50.8% of substantiated abuse cases, physical abuse in 21.9%, neglect in 17.0% and sexual abuse in 10.2%.
Figure 76 . Type of substantiated abuse after investigation by Oranga Tamariki Aotearoa 2011/12–2021/22
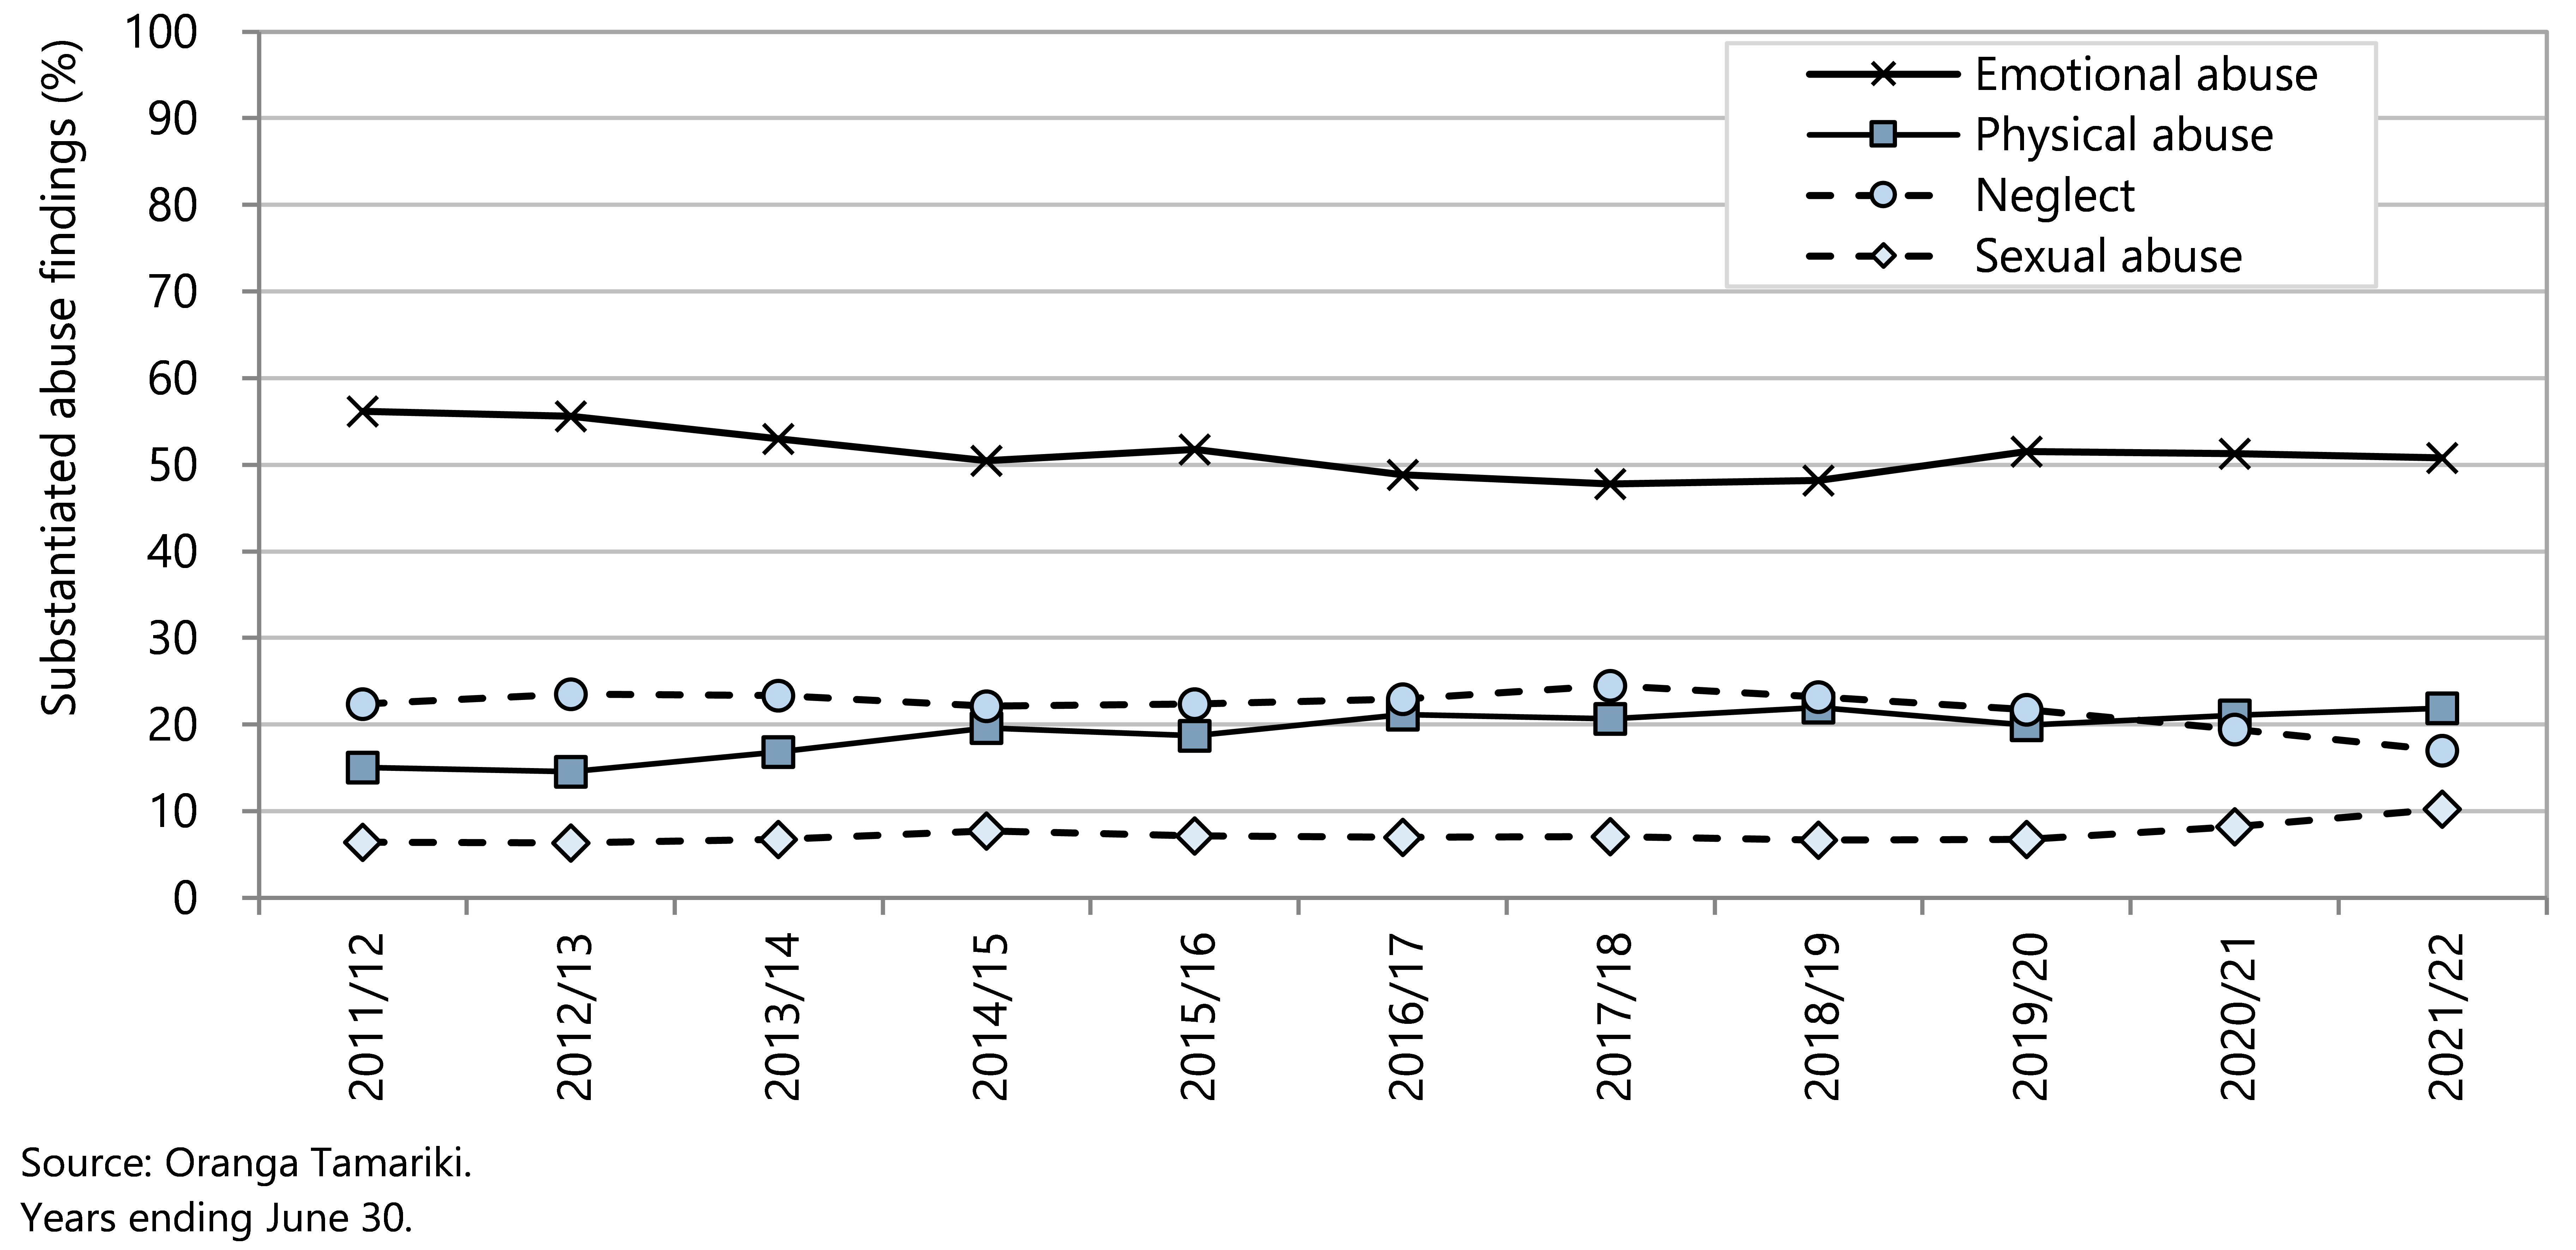
The Oranga Tamariki 2021/22 annual report95 showed that in the year to June 2022 there were 4,722 children and young people in care and protection custody of the Chief Executive (Figure 77). The number of children and young people in care and protection custody increased from 2016/17 to 2018/19 and has since declined. Since 2019/20 there have been more exits from care than entries into care each year.95
Figure 77. Children and young people in care and protection custody of the Oranga Tamariki Chief Executive, Aotearoa 2012/13–2020/21
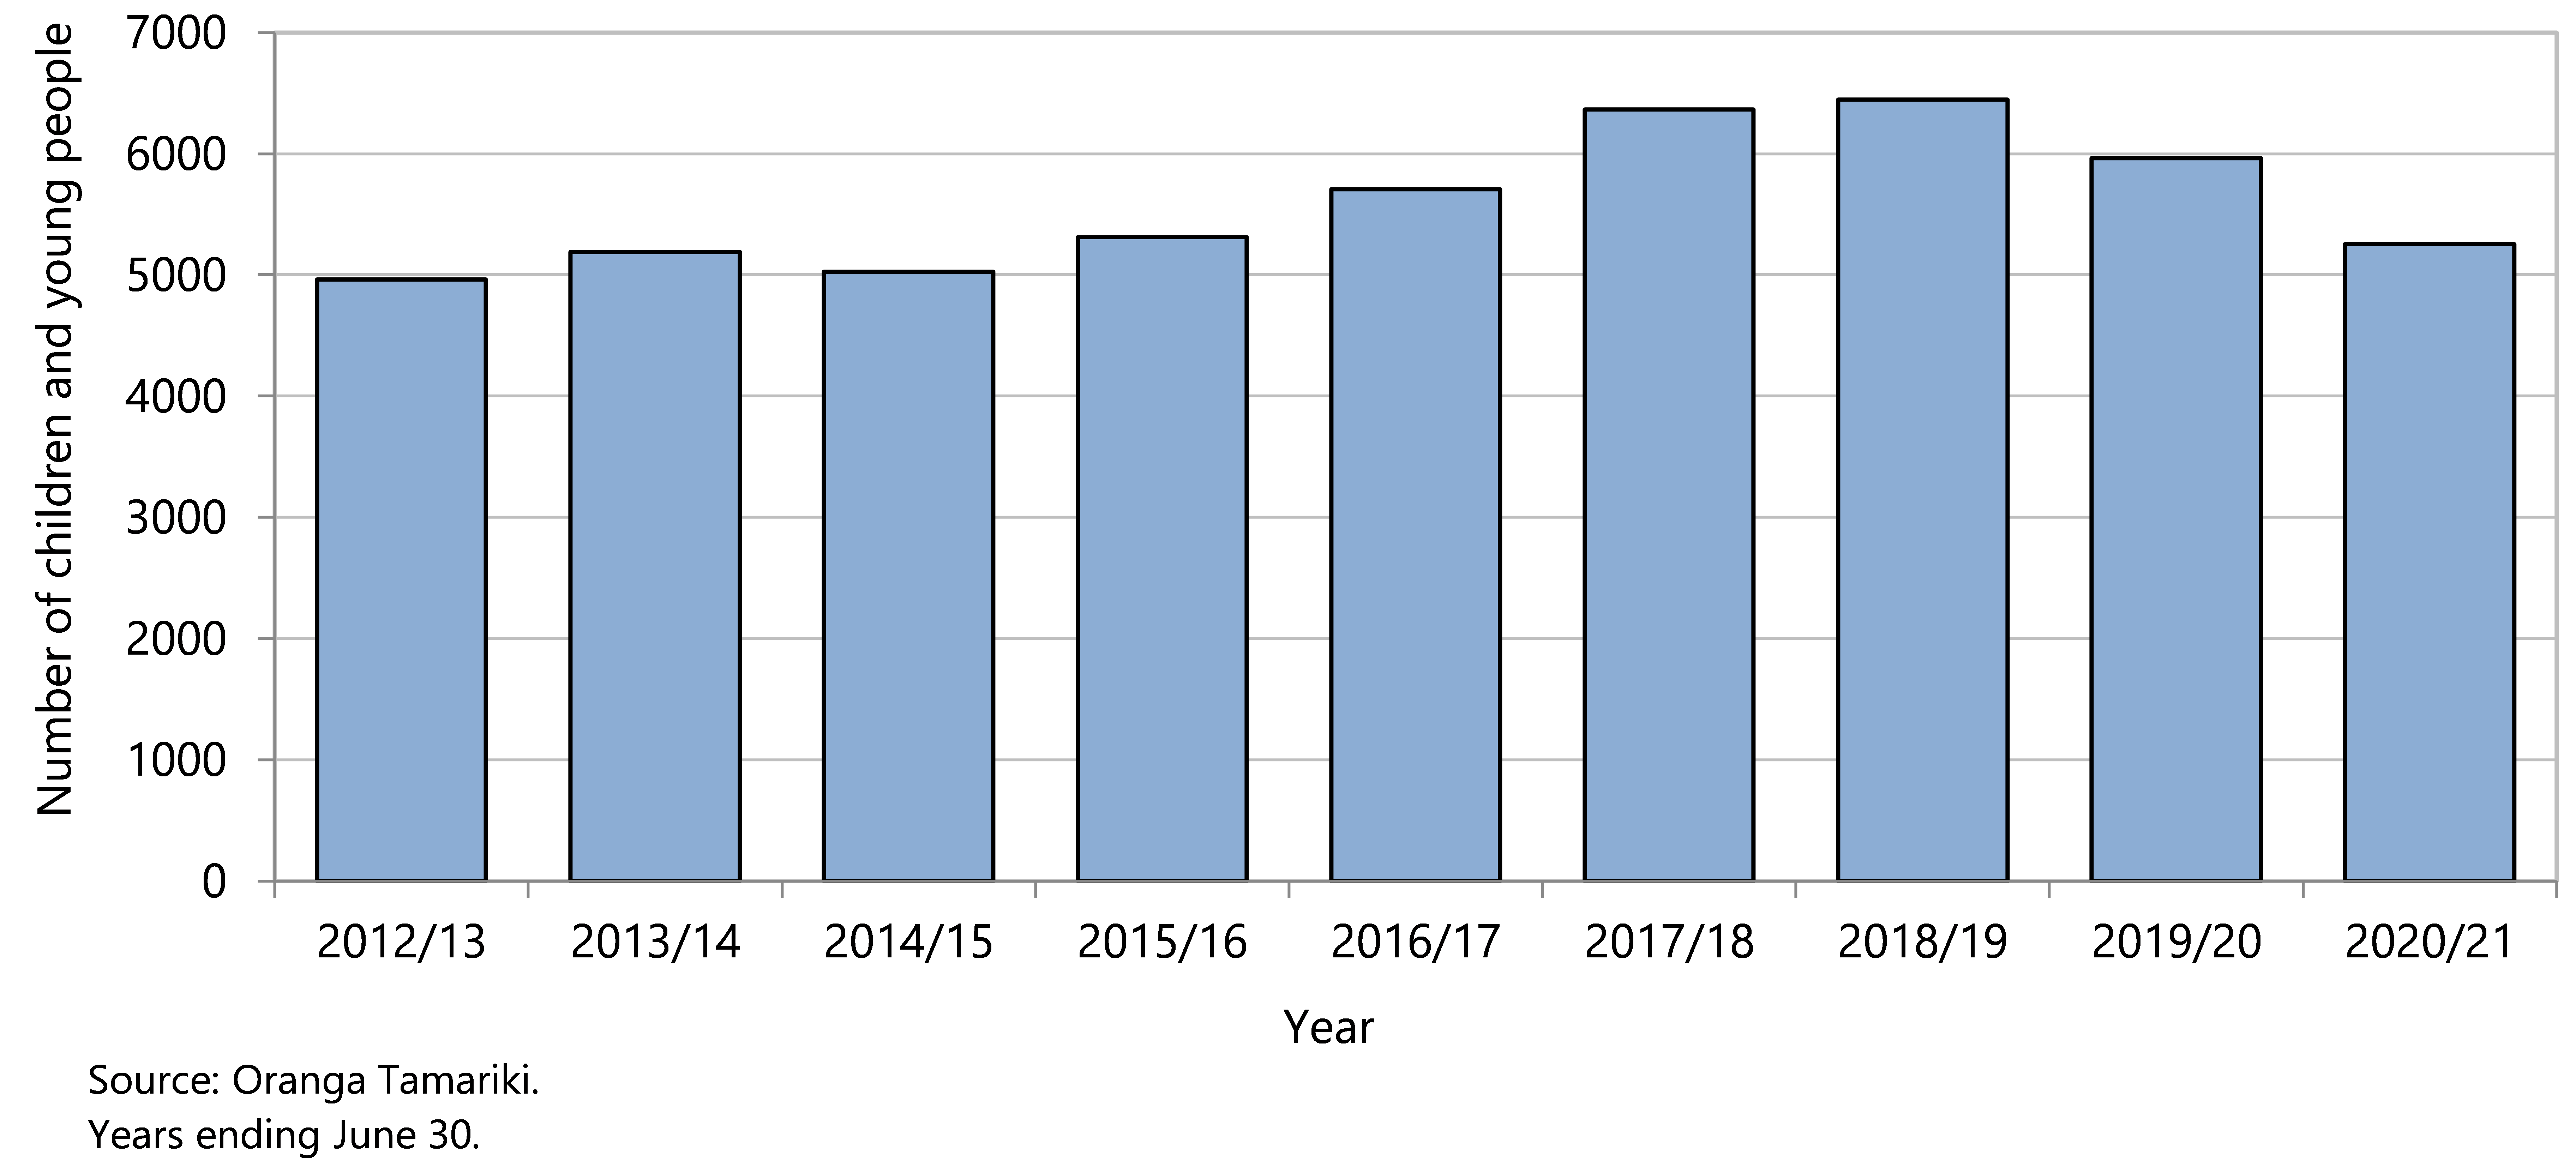
In 2021/22, almost 6 in 10 (57%) children and young people in care and protection custody of the Chief Executive identified as Māori, a further 11% identified and Māori and Pacific, and 6% identified as Pacific (Figure 78). Most children in care were aged over one year, and the proportion of male children was slightly higher than for female children (Figure 78).
Figure 78 . Children and young people in care and protection custody of the Oranga Tamariki Chief Executive, by demographic factor, Aotearoa 2021/22
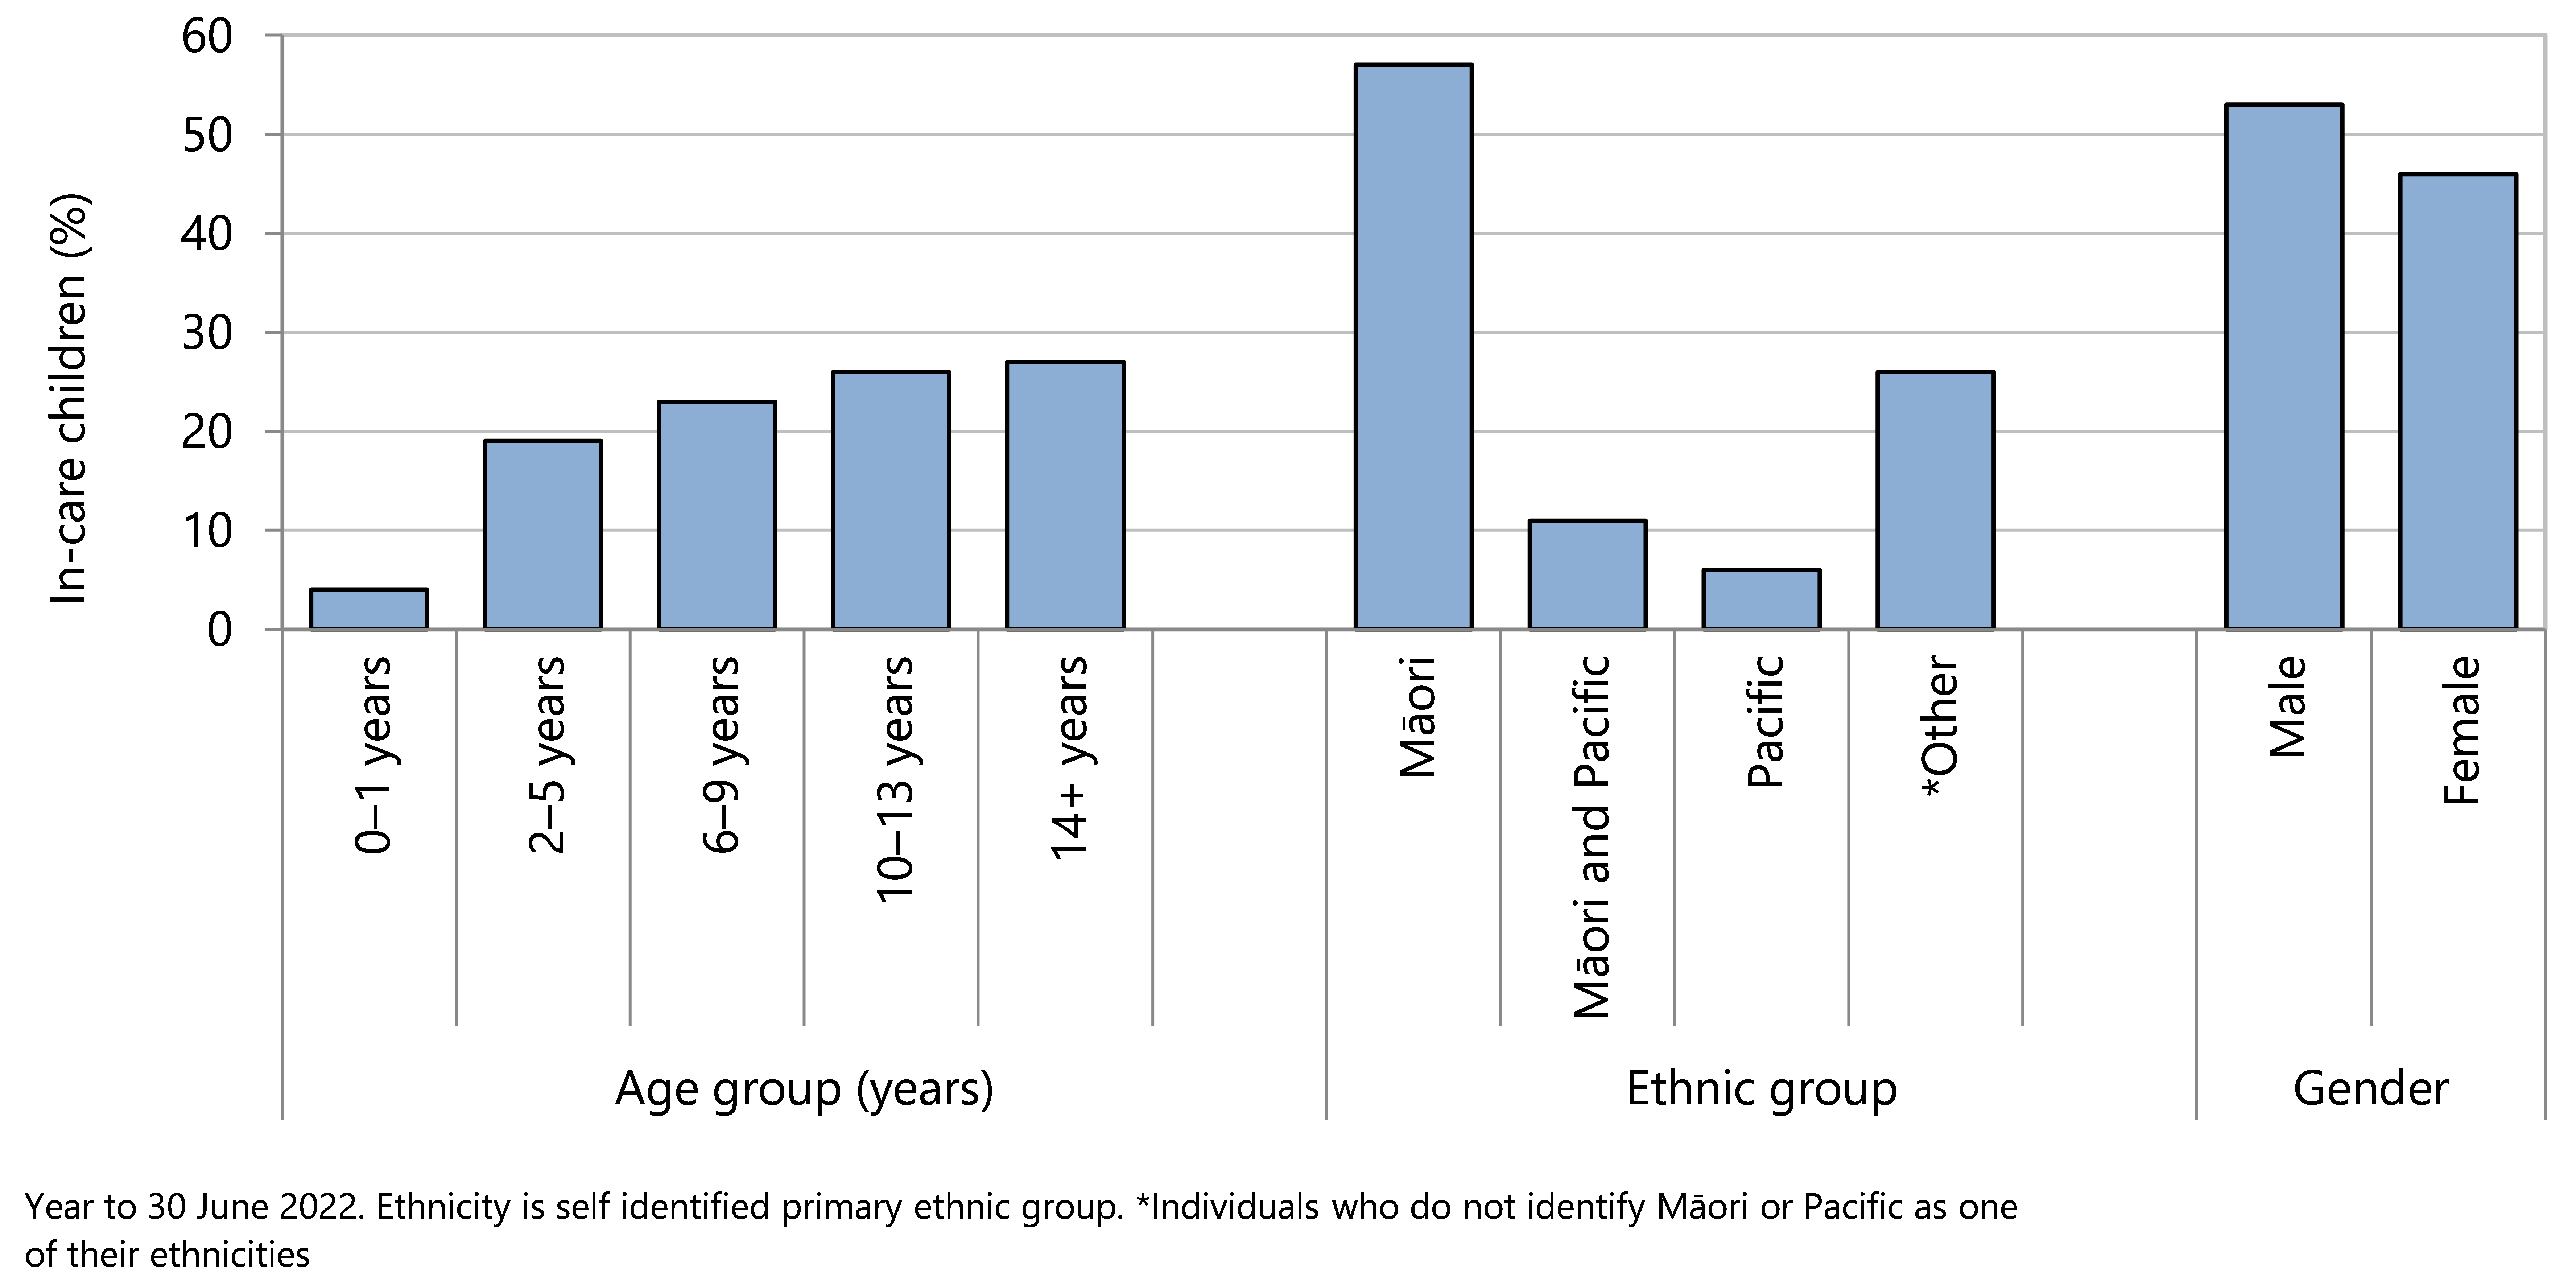
Assault, neglect and maltreatment
The United Nations Convention on the Rights of the Child includes the rights to “grow up in a family environment of happiness, love and understanding” and to be protected from “sexual exploitation, abuse and economic exploitation”.58 The healthy development of a child is the primary responsibility of families and communities, and is achieved by providing supportive relationships and positive learning experiences.96
Child maltreatment is a serious public health issue that is recognised internationally.89,97 The definition of child maltreatment includes any act, by a parent or other caregiver of a child, that results in harm, potential for harm, or threat of harm. Acts may be of commission (abuse) or of omission (neglect).98 One form of abuse or neglect rarely occurs in isolation from other forms of maltreatment, and often there is a lack of obvious signs and symptoms.99 Adverse consequences of child maltreatment can be wide ranging, persist into adulthood, and affect future generations.100
Surveillance of child safety can be achieved via de-identified data.101 Limitations to such surveillance include underestimation of prevalence of child maltreatment, and possible increased surveillance or differential standards resulting in bias across population groups. 97,101-104 Current child protection policies have failed to remediate ethnic disparities associated with maltreatment risk, which must be addressed to achieve equity in outcomes throughout the life course.104
The following section reviews deaths and hospitalisations of New Zealand 0–14 year olds that were due to injuries from assault, neglect or maltreatment, using data from the National Mortality Collection and the National Minimum Dataset. Hospitalisations for child maltreatment are the “tip of the iceberg” but they do provide some indication of the numbers of children who are severely maltreated.
Data sources and methods
Indicators
Deaths from injuries arising from the assault, neglect, or maltreatment of 0–14 year olds
Hospitalisations for injuries arising from the assault, neglect, or maltreatment of 0–14 year olds
Definitions
Deaths in 0–14 year olds are those where intentional injury is a cause of death.
Hospitalisations * of 0–14 year olds are those where there is a primary diagnosis of injury and an intentional injury (assault) external cause code in any of the first 10 external cause codes.†
Data sources
Numerator(s): Deaths: National Mortality Collection;
Hospitalisations: National Minimum Dataset.
Denominator : NZCYES Estimated Resident Population (with intercensal extrapolation)
Additional information
* As outlined in Appendix 3, in order to ensure comparability over time, all hospitalisations with an emergency department specialty code on discharge were excluded, as were hospitalisations with a non-injury primary diagnosis.
† Refer to Appendix 1 for the codes included in this section.
Deaths from assault, neglect or maltreatment
Delays in the coronial process mean that cause of death data were not available in time for the 2022 Child Poverty Monitor. From 1990–2018, an average of seven children per year (aged 0–14 years) died from injuries arising from assault, neglect, or maltreatment, corresponding to a rate of around one death per 100,000 children per year. Lower rates in 2002–03, 2012–13 and 2016–17 and 2018 were not statistically different from the rates in other year-pairs (Figure 79).
In the five years from 2014–2018 there were 33 deaths of 0–14 year olds children that resulted from assault, neglect or maltreatment. Fourteen of these deaths were of female children and nineteen were of male children. Infants aged under one year had the highest mortality rate from assault, neglect, or maltreatment (5 deaths per 100,000 age-specific population per year). Fourteen of the total 33 deaths (42%) occurred in the infants aged less than one year, fifteen deaths (45%) were of children aged 1–4 years, and four were children aged 5–10 years. In these five years there were no deaths from assault of children aged 11–14 years.
Figure 79 . Deaths due to injuries arising from assault, neglect, or maltreatment of 0–14 year olds, Aotearoa 1990–2018
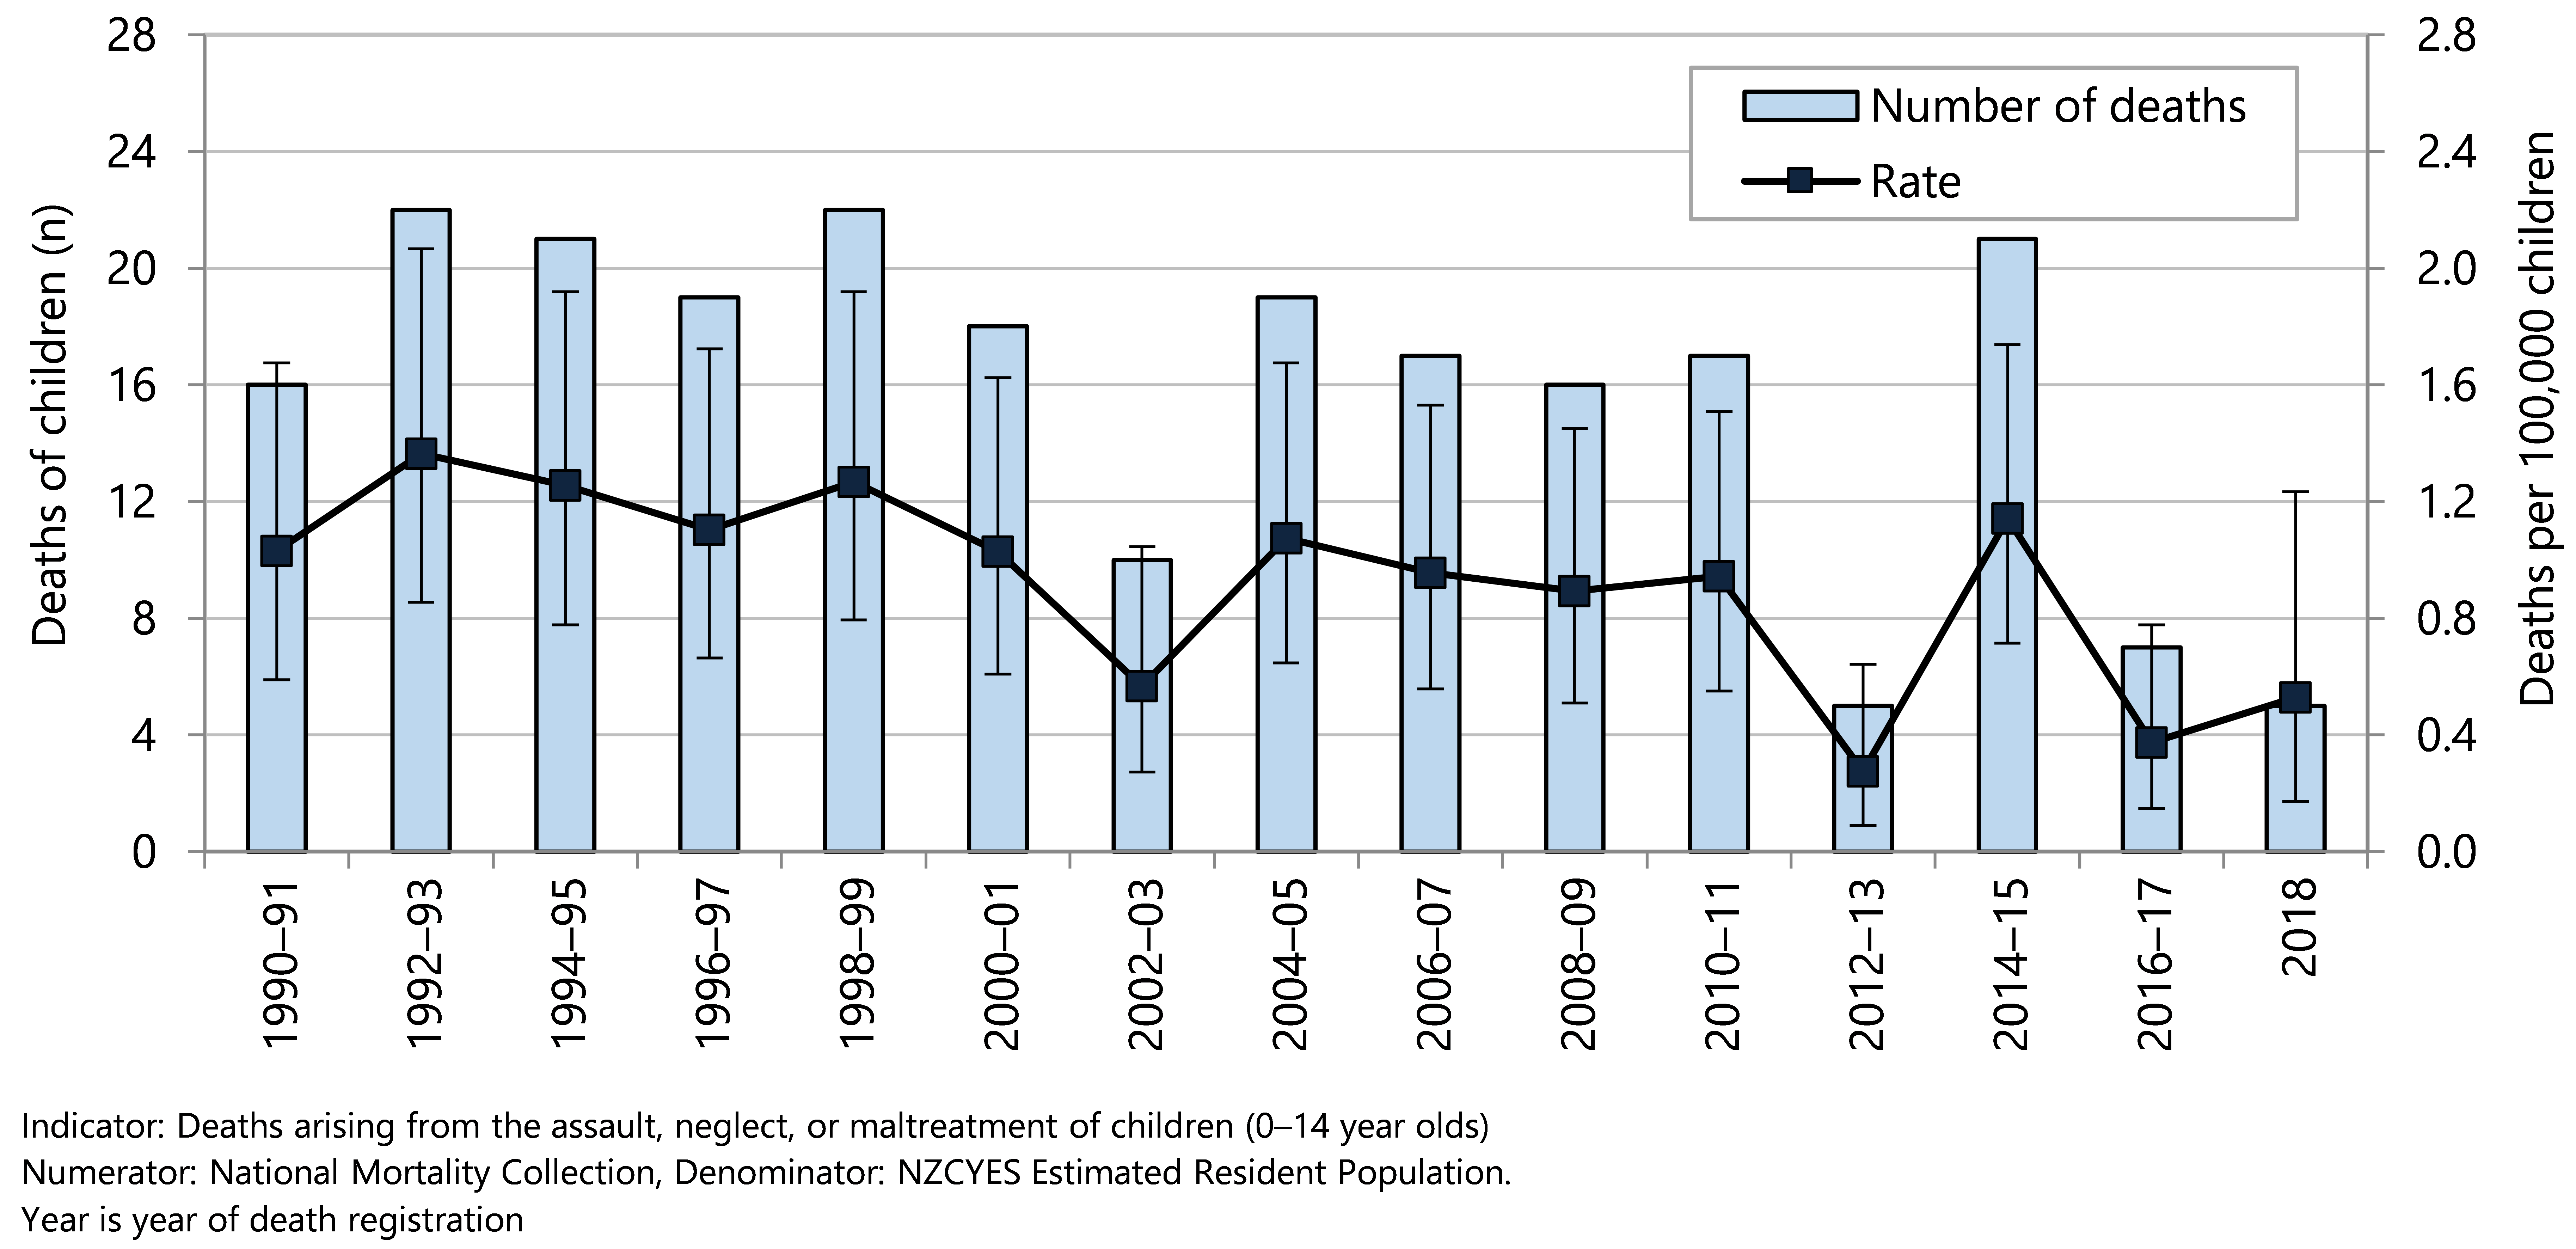
Hospitalisations due to assault, neglect or maltreatment
From 1993 to 2021, the numbers and rates of hospitalisations for injuries arising from assault, neglect or maltreatment of New Zealand children aged 0–14 years have varied from year to year around an average of 211 hospitalisations per year (23.5 per 100,000 age-specific population) (Figure 80).
In the five years from 2017–2021 there were 1058 hospitalisations of 0–14 year olds for injuries arising from assault, neglect or maltreatment, 410 of girls and 648 of boys. Age-specific hospitalisation rates for injuries arising from assault, neglect or maltreatment were highest for children in the first year of life or in their early teenage years, and considerably lower for children aged between 2 and 10 years of age (Figure 81). Male rates were higher than female rates at most ages, but the differences were not always statistically significant.
Figure 80 . Hospitalisations due to injuries arising from assault, neglect, or maltreatment in 0–14 year olds, Aotearoa 1990–2020
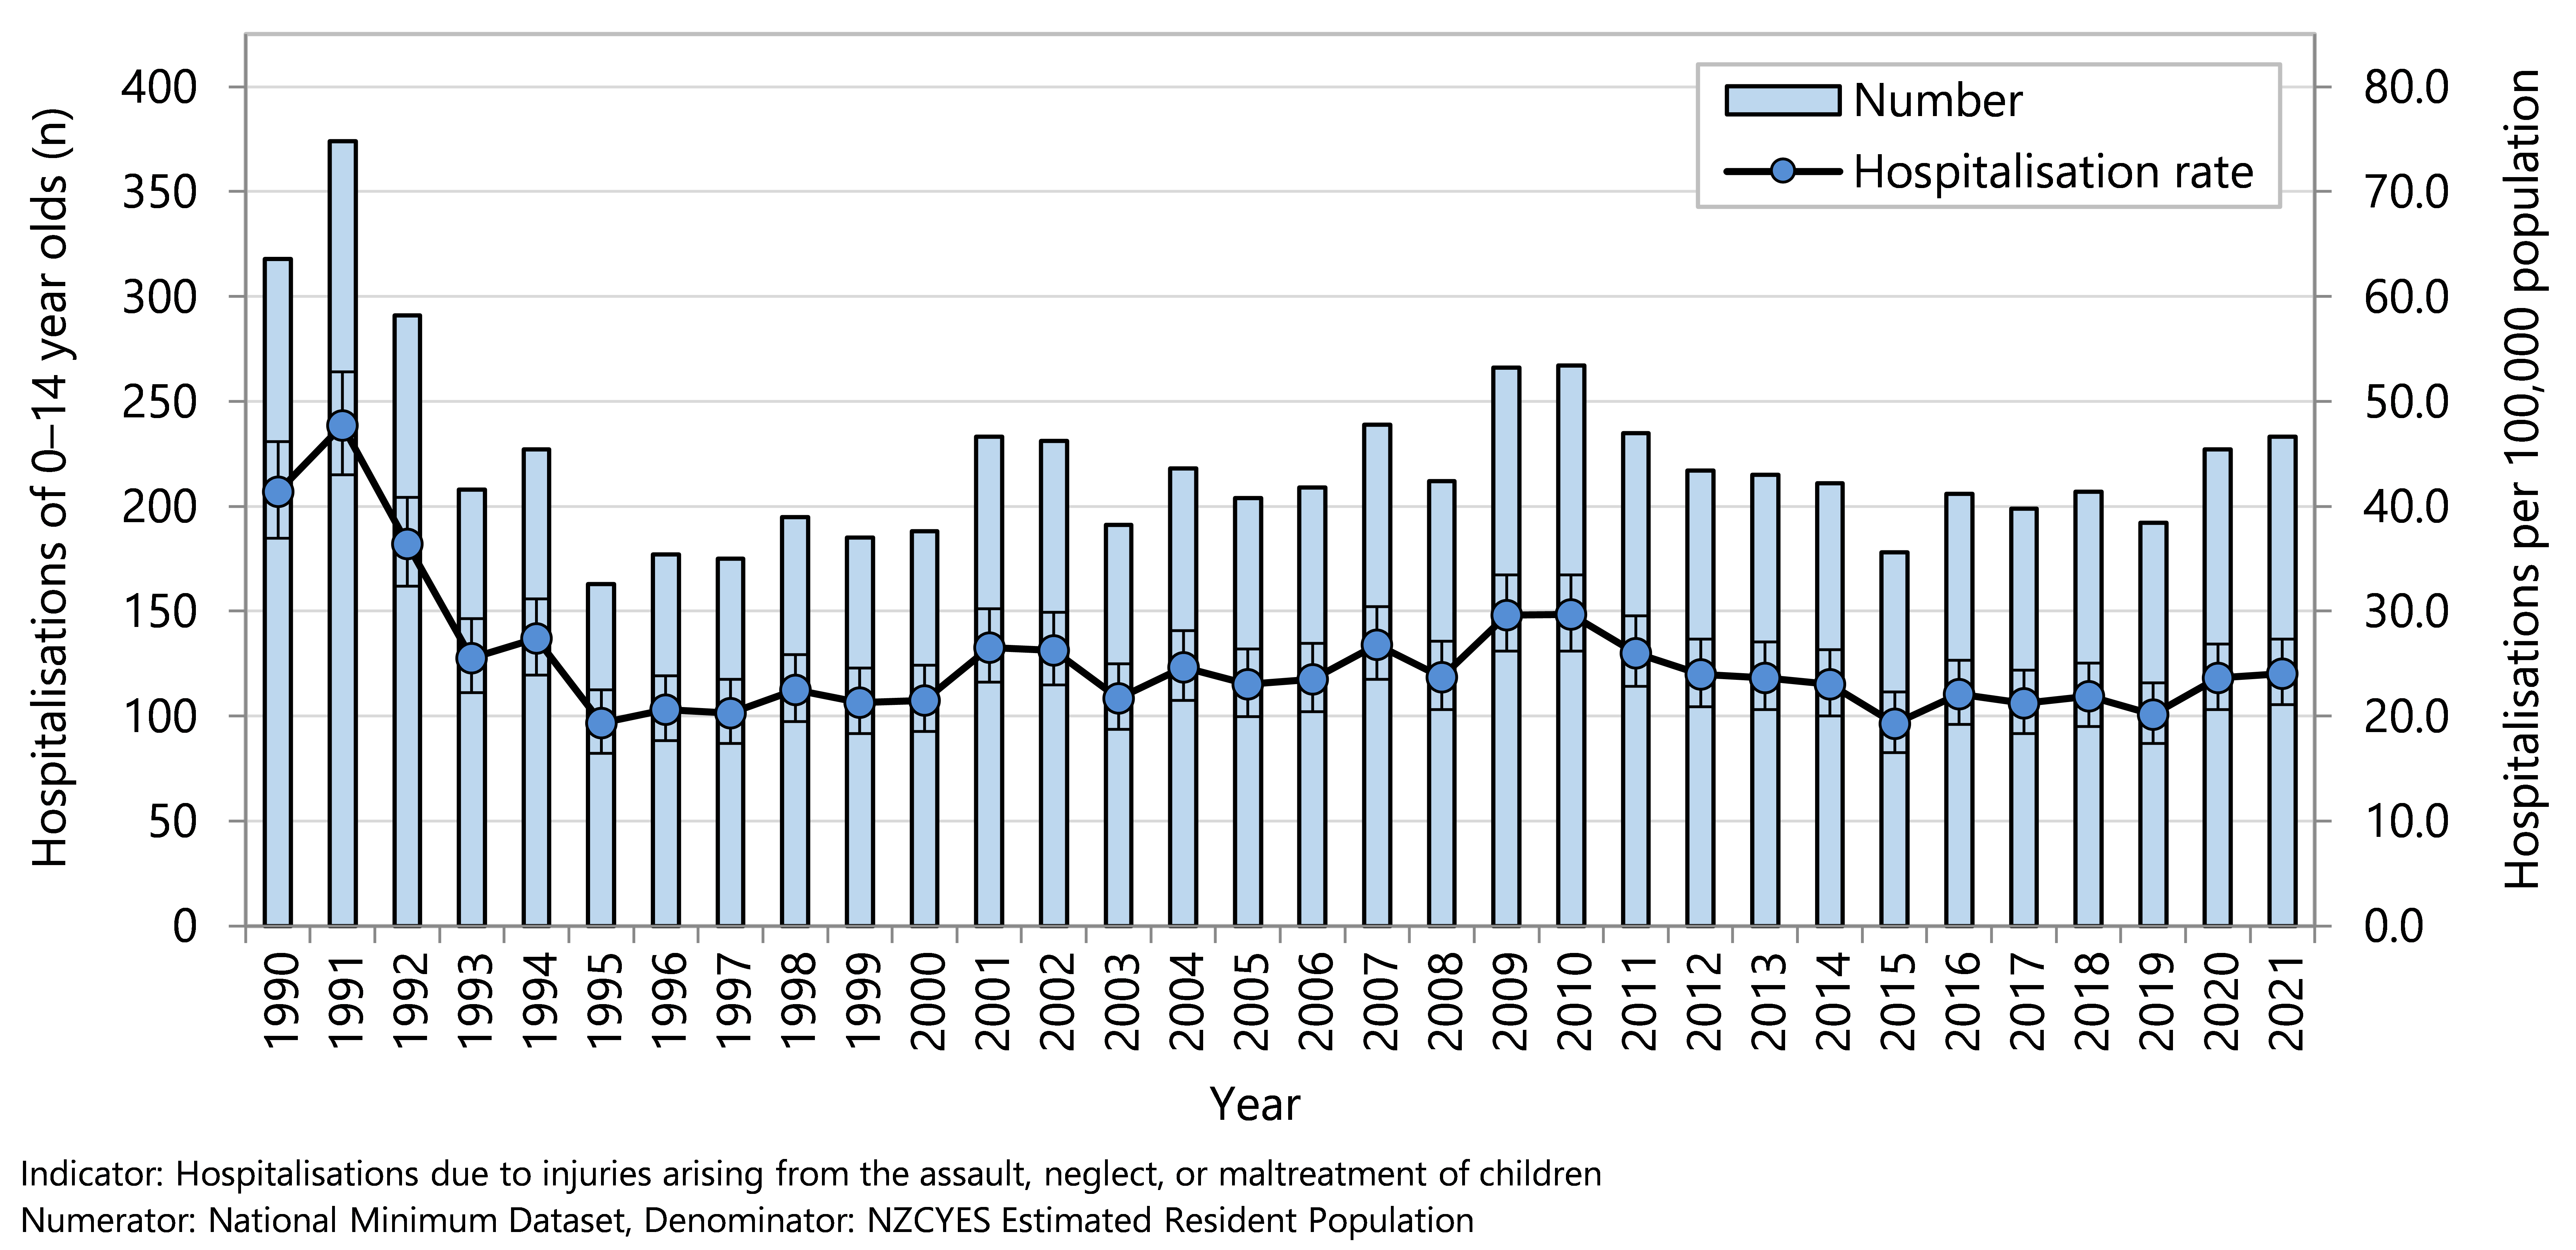
Figure 81 . Hospitalisations due to injuries arising from assault, neglect, or maltreatment in 0–14 year olds, by age and gender, Aotearoa 2017–2021
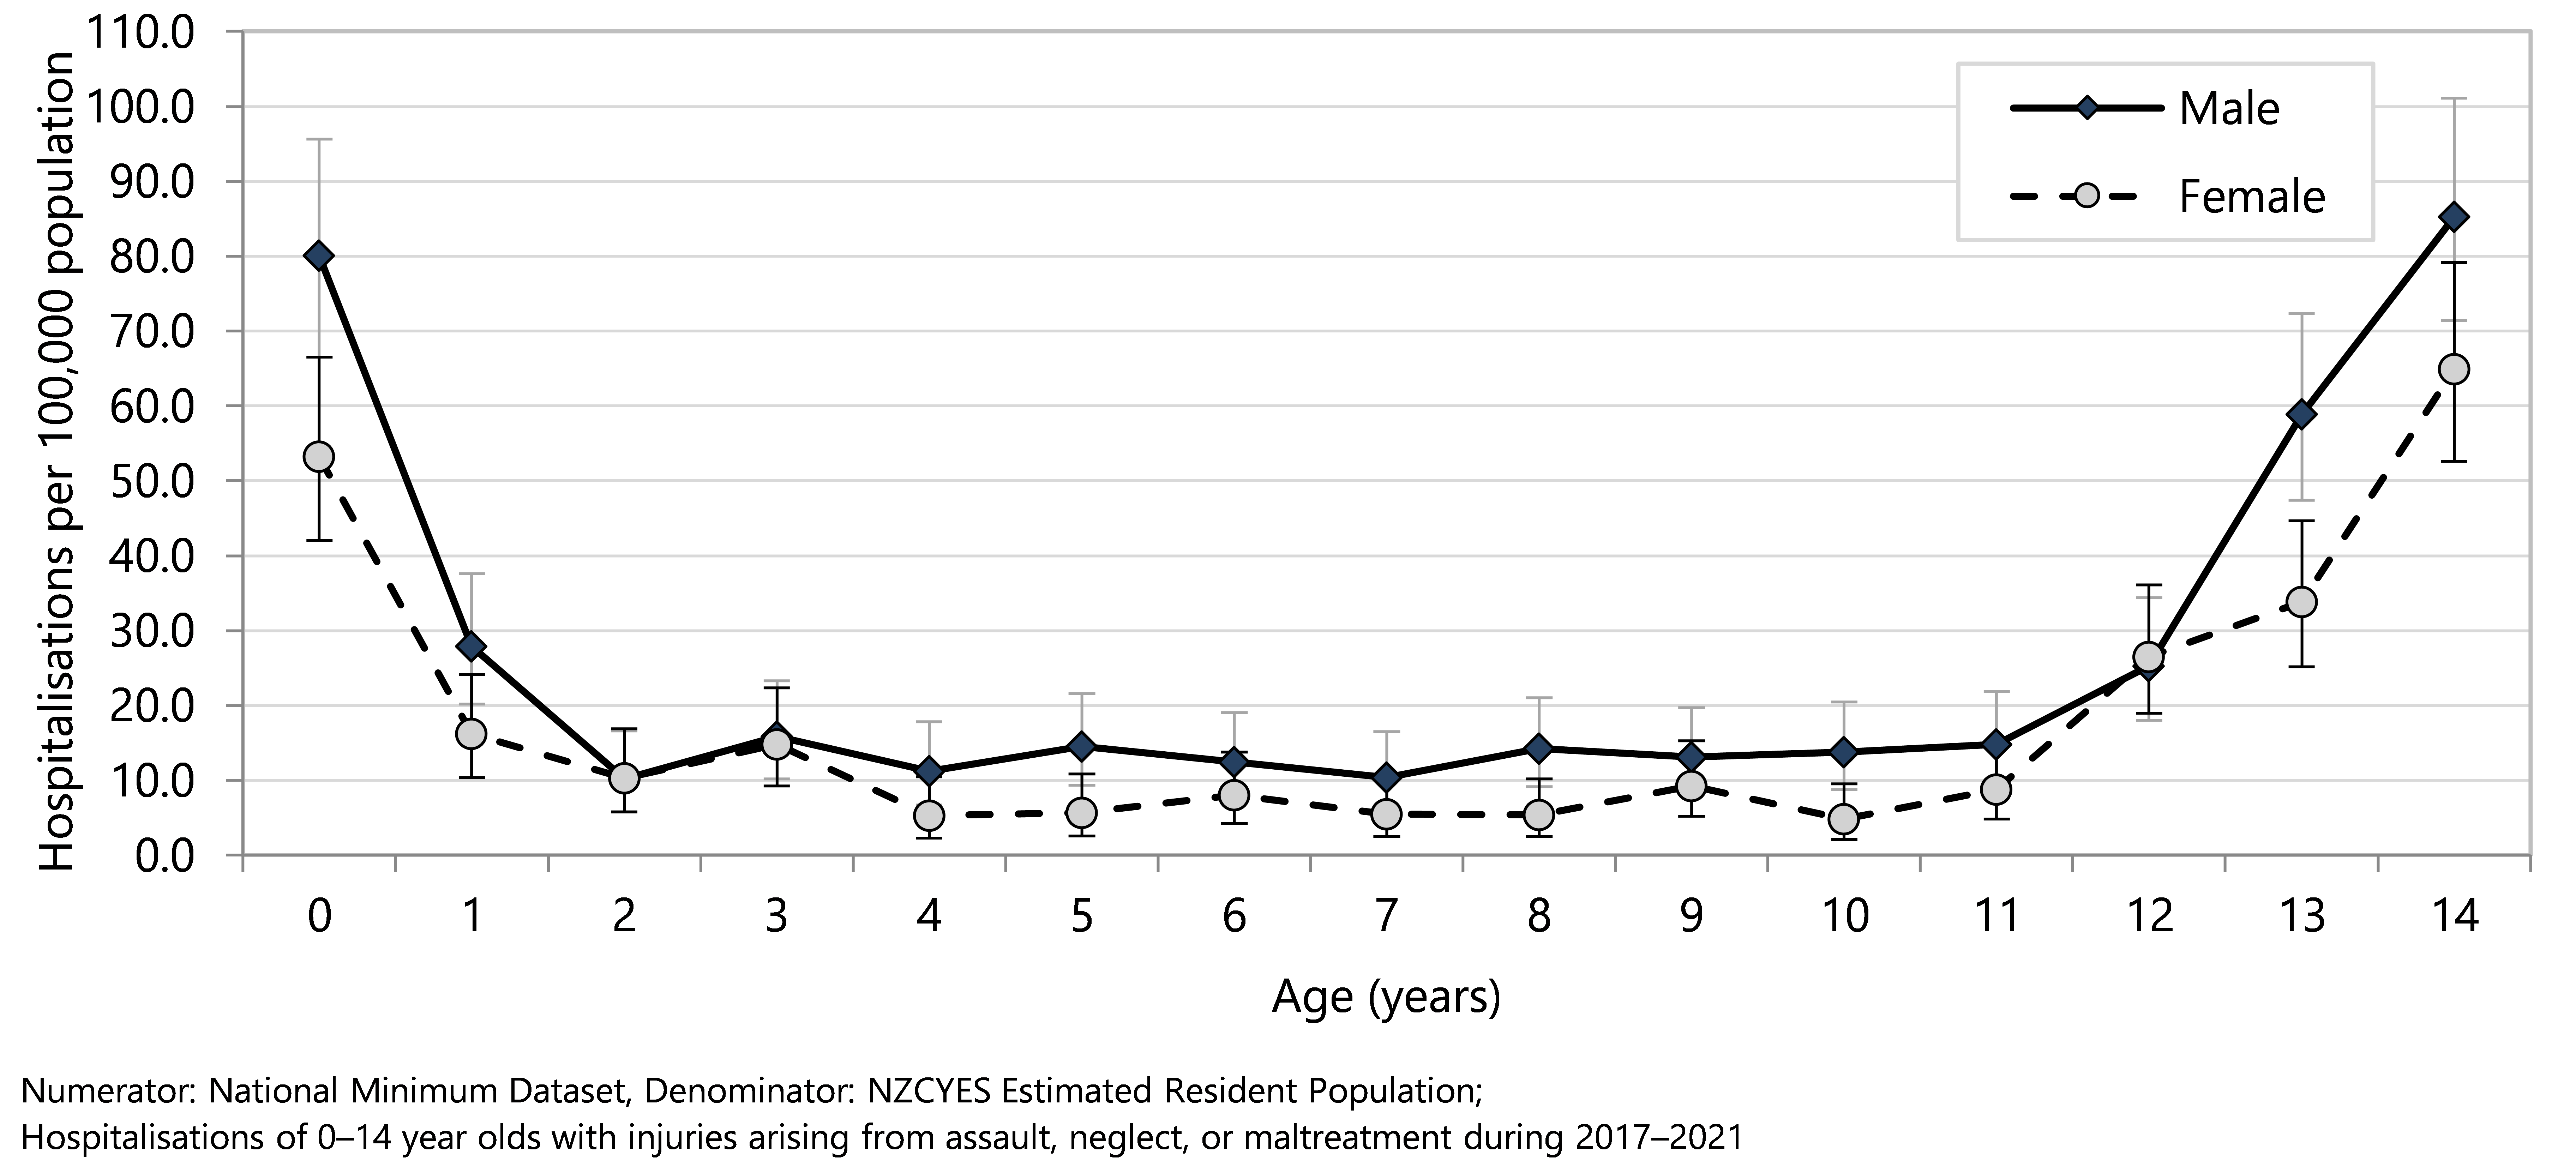
The most common injuries recorded in hospitalisations resulting from assault, neglect or maltreatment of 0–14 year olds in 2016–2021 were head injuries (552 out of the total 1,043 or 52.2%). These included 210 traumatic brain injuries (19.8%), 133 superficial head injuries (12.6%), 48 fractures of the skull or facial bones (4.5%) and 161 other head injuries (15.2%).
The nature of the injuries differed by age group. In the period 2017–2021, traumatic brain injuries, maltreatment and superficial head injuries were the most commonly recorded diagnoses in children aged under five years (Table 10). In the 5–9 year old age group other head injuries and maltreatment were the most common diagnoses (Table 10). In 10–14 year olds, traumatic brain injuries and other head injuries, and upper limb injuries were the most common diagnoses (Table 10).
Table 10. Hospitalisations due to injuries arising from assault, neglect, or maltreatment in 0–14 year olds, by age groups and nature of injury, Aotearoa 2017–2021
| Primary diagnosis | 2017–2021 (n) | Annual average | Rate per 100,000 population | % |
| Assault, neglect, or maltreatment hospitalisations of 0–14 year olds | ||||
| 0–4 year olds | ||||
| Traumatic brain injuries | 82 | 16 | 5.40 | 7.8 |
| Superficial head injury | 61 | 12 | 4.02 | 5.8 |
| Fracture skull or facial bones | 9 | 2 | 0.59 | 0.9 |
| Other head injuries | 28 | 6 | 1.84 | 2.6 |
| Injuries to the neck | 5 | 1 | 0.33 | 0.5 |
| Injuries to thorax (including rib fractures) | 13 | 3 | 0.86 | 1.2 |
| Injuries to abdomen, lower back, and pelvis | 16 | 3 | 1.05 | 1.5 |
| Injuries to upper limb | 33 | 7 | 2.17 | 3.1 |
| Fractured femur | 10 | 2 | 0.66 | 0.9 |
| Other injuries to lower limbs | 24 | 5 | 1.58 | 2.3 |
| Maltreatment | 72 | 14 | 4.74 | 6.8 |
| Other injuries | 17 | 3 | 1.12 | 1.6 |
| Total | 370 | 74 | 24.37 | 35.0 |
| 5–9 year olds | ||||
| Traumatic brain injuries | 13 | 3 | 0.78 | 1.2 |
| Superficial head injury | 22 | 4 | 1.32 | 2.1 |
| Fracture skull or facial bones | <5 | s | s | s |
| Other head injuries | 29 | 6 | 1.74 | 2.7 |
| Injuries to the neck | 7 | 1 | 0.42 | 0.7 |
| Injuries to thorax (including rib fractures) | 5 | 1 | 0.30 | 0.5 |
| Injuries to abdomen, lower back, and pelvis | 18 | 4 | 1.08 | 1.7 |
| Injuries to upper limb | 19 | 4 | 1.14 | 1.8 |
| Injuries to lower limbs (includes fractured femur) | 14 | 3 | 0.84 | 8.4 |
| Maltreatment | 27 | 5 | 1.62 | 2.6 |
| Other injuries | 9 | 2 | 0.54 | 0.9 |
| Total | 166 | 33 | 9.96 | 15.7 |
| 10–14 year olds | ||||
| Traumatic brain injuries | 115 | 23 | 7.26 | 10.9 |
| Superficial head injury | 50 | 10 | 3.16 | 4.7 |
| Fracture skull or facial bones | 36 | 7 | 2.27 | 3.4 |
| Other head injuries | 104 | 21 | 6.56 | 9.8 |
| Injuries to the neck | 27 | 5 | 1.70 | 2.6 |
| Injuries to thorax (including rib fractures) | 19 | 4 | 1.20 | 1.8 |
| Injuries to abdomen, lower back, and pelvis | 33 | 7 | 2.08 | 3.1 |
| Injuries to upper limb | 83 | 17 | 5.24 | 7.8 |
| Injuries to lower limbs (includes fractured femur) | 15 | 3 | 0.90 | 9.0 |
| Maltreatment | 17 | 3 | 1.07 | 1.6 |
| Other injuries | 23 | 5 | 1.45 | 2.2 |
| Total | 522 | 104 | 32.95 | 49.3 |
There was a clear social gradient in hospitalisation rates for assault, neglect, or maltreatment with rates increasing as scores increased on the NZDep index of deprivation. Hospitalisation rates for children who lived in areas with the highest NZDep scores were five times those for children living in areas with the lowest scores. There were also marked differences by ethnicity, with hospitalisation rates for Māori children nearly three times, and Pacific children over two times, those of European/Other children (Figure 82). These data are presented not to characterise any particular population groups, but rather to challenge a society that tolerates inequity in supporting parents and whānau to provide safe and nurturing environments.
Figure 82 . Hospitalisations due to injuries arising from assault, neglect, or maltreatment in 0–14 year olds, by demographic factor, Aotearoa 2017–2021
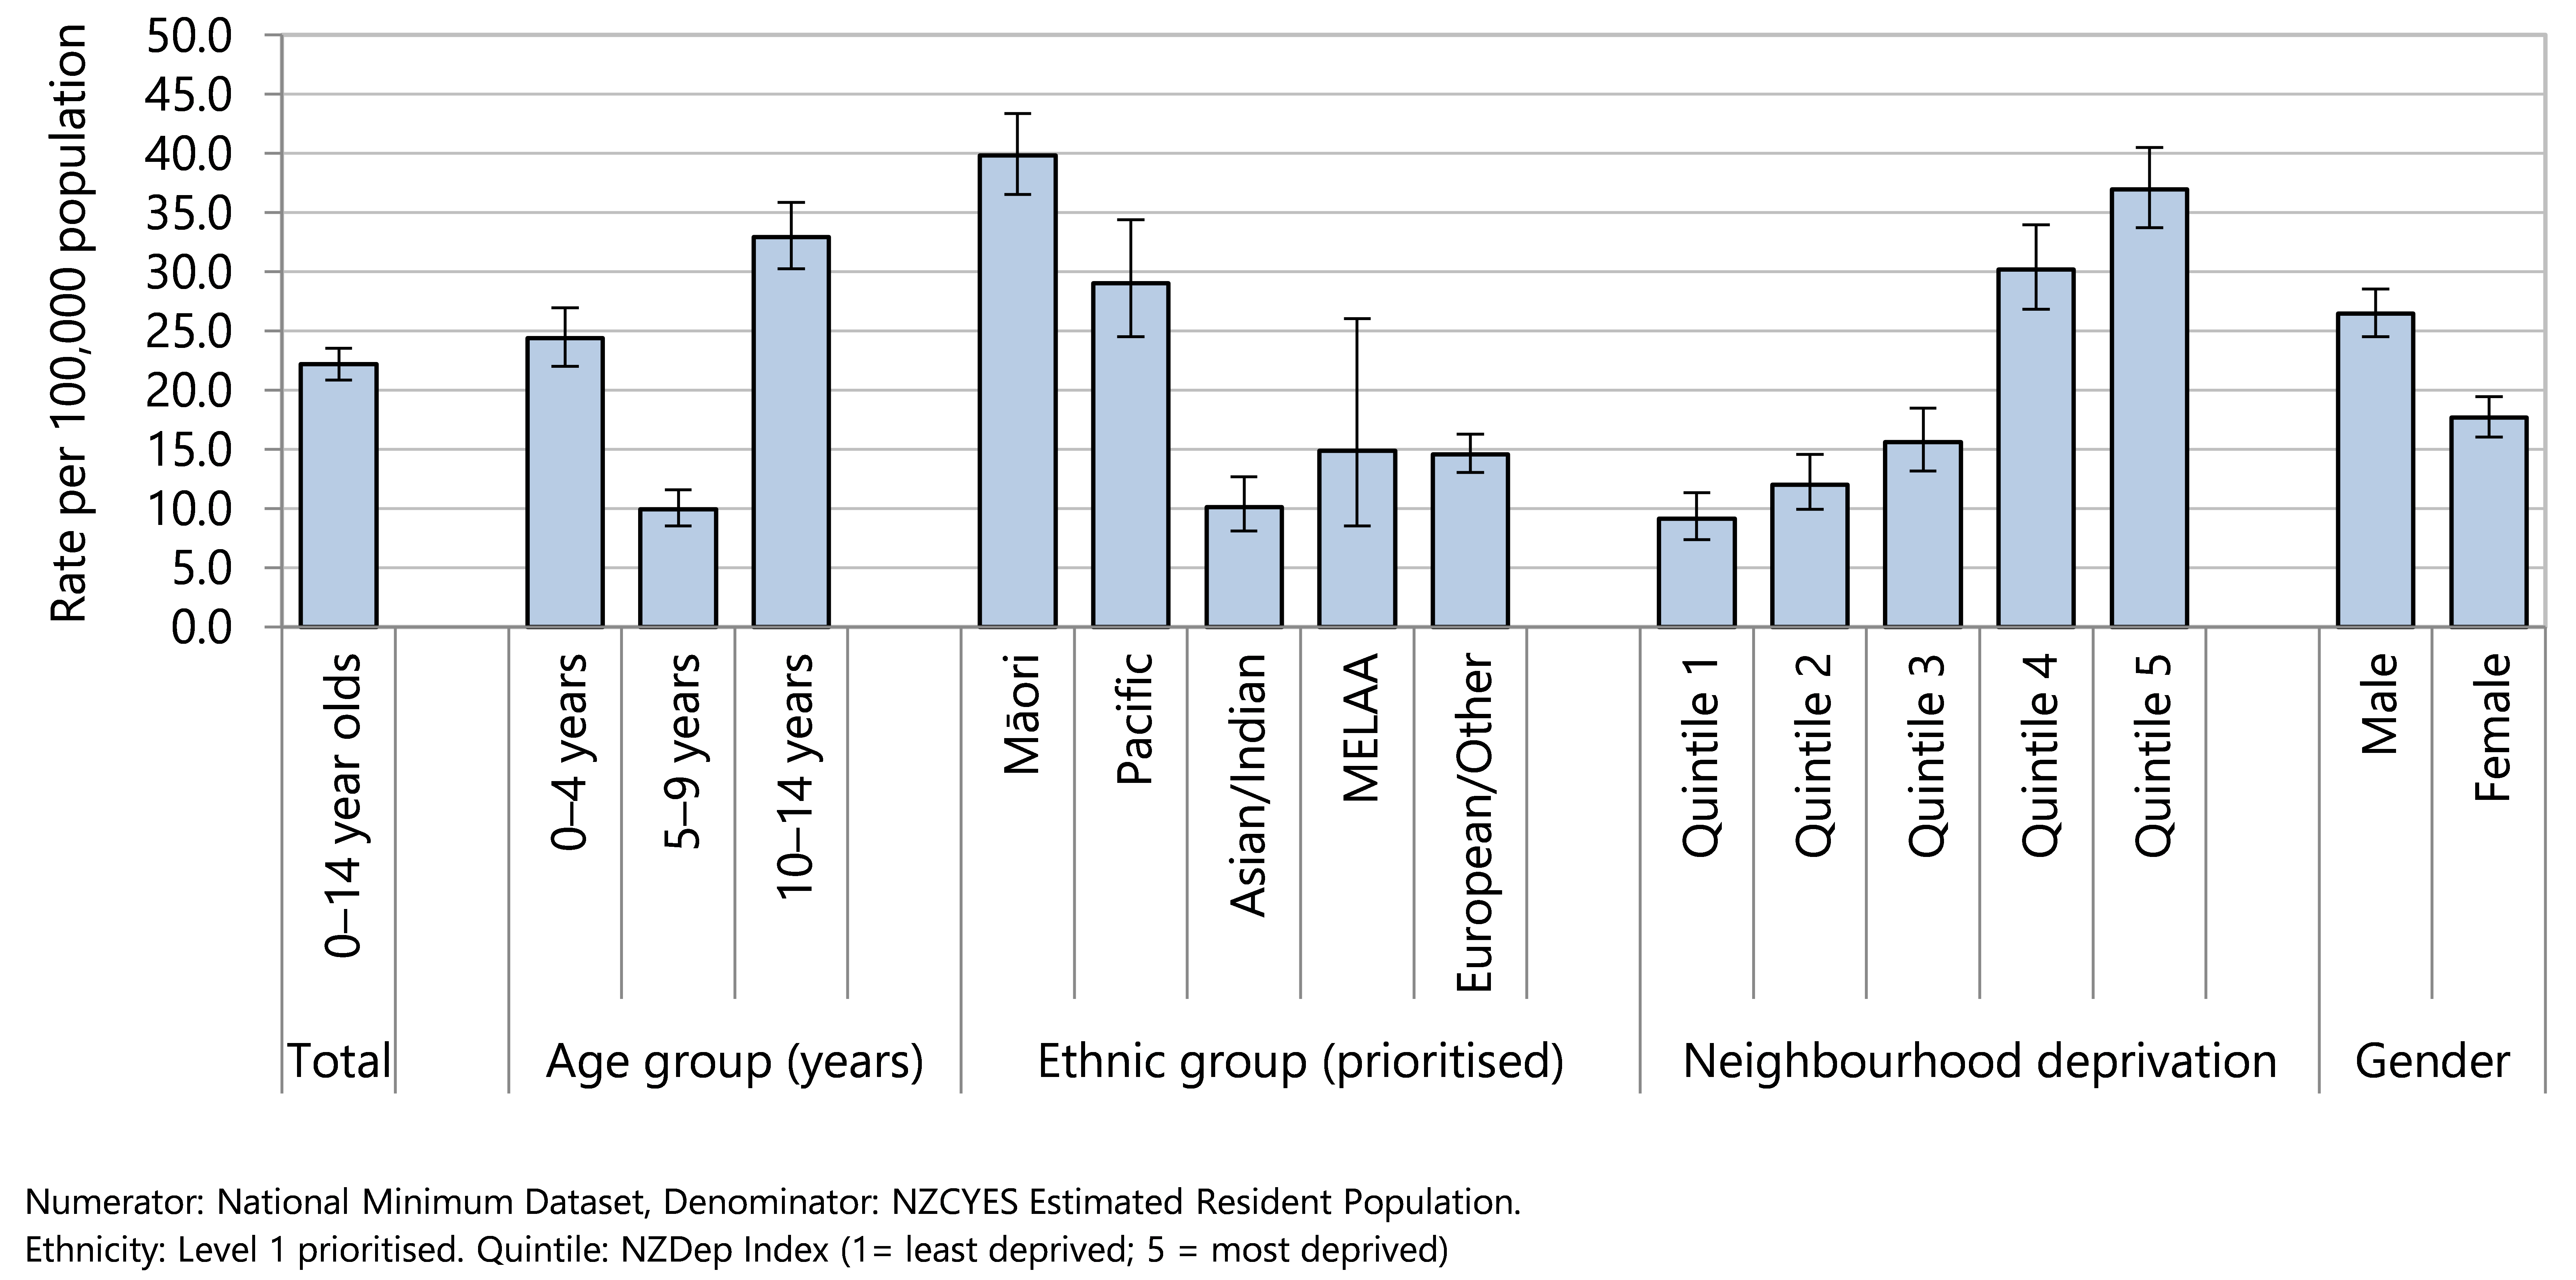
Education Attainment and Attendance
Attainment of a school qualification is directly linked to economic potential through labour force status and income, as those without a qualification earn 51% less than those who continue in school to National Certificate of Educational Achievement (NCEA) Levels 2 and 3.105 School attendance is a key driver of learning outcomes and attainment,106 and is included as a measure of wellbeing in the government’s Child and Youth Wellbeing Strategy.70
The interruptions to learning brought on by COVID-19, due to alert level restrictions, economic hardship, social exclusion and poor health outcomes, disproportionately affected those who were already disadvantaged.107 Lack of access to the internet during lockdown posed a barrier to schooling and whānau support,108 and for marginalised families ‘digital exclusion’ became an additional barrier to engaging with education and governmental agencies.109 The negative impact on student wellbeing, engagement and learning during such a key stage of life development has long-lasting consequences.110
The following section presents Ministry of Education information on school attendance and the attainment of school leavers from 2009–2021.
Data sources and methods
Indicators
School leavers with below level 1 qualifications
School leavers with NCEA Level 1 or above
School leavers with NCEA Level 2 or above
School leavers with a University Entrance Standard
Students attending school regularly
Data source attendance
Ministry of Education: Attendance survey. https://www.educationcounts.govt.nz/statistics/attendance
Numerator: The total number of students who have attended more than 90% of all school time in Term 2, where time is measured in half-days.
Denominator : The total number of students enrolled for 30 half-days or more during Term 2, in each year, except 2020, which the minimum enrolled half-day is 1 during Term 2
Data source attainment
Ministry of Education https://www.educationcounts.govt.nz/statistics/school-leavers
Numerator: Number of students leaving school with no qualifications, NCEA Level 1 or higher, NCEA Level 2 or higher, or a University Entrance Standard (or equivalent qualifications). NCEA data was provided to the Ministry by NZQA, data on other qualifications was provided by schools.
Denominator : Number of school leavers in a given year (from the Ministry of Educations’ national register of student enrolments, ENROL). Further information on exactly who is classed as a school leaver can be found on the weblink above.
Definitions
The National Certificate of Educational Achievement (NCEA) is part of the National Qualifications Framework (NZQF). NCEA can be achieved at three levels: 1,2 and 3, typically gained in years 11, 12 and 13.75 At each Level, students must achieve a certain number of credits to be awarded the qualification, and these may be gained over more than one year. University Entrance is the minimum requirement for attending a New Zealand University and it requires all of the following: NCEA level 3 with 14 credits in each of three approved level 3 subjects; 12 level 2 literacy credits (5 in writing and 5 in reading); and 10 level 1 numeracy credits.75 Not all students who attain level 3 will attain University Entrance. Listed qualification levels include qualifications on the NZQF as well as other equivalent qualifications that are non-NZQF such as Cambridge International Assessment and International Baccalaureate.
School socio-economic decile76: All schools are assigned a decile ranking based on the socio-economic status of the area they serve. These rankings are based on census data from families with school age children in the areas from which the school draws its students. Five census variables used in the ranking procedure: equivalent household income (i.e. income adjusted for the number of adults and children in the household and the ages of the children), parental occupation and educational qualifications, household crowding and receipt of income support payments. Schools are assigned a decile ranking, with decile 1 schools being the 10% of schools with the highest proportion of students from low socio-economic communities and decile 10 schools being the 10% of schools with the lowest proportion of these students. Decile ratings are used by the Ministry of Education to allocate targeted funding, as well as for analytical purposes. Ranking of deciles is in the opposite direction to that of the NZDep2013 index of deprivation used with health data in this report.
School socioeconomic quintiles are aggregates of the deciles, with quintile 1 = deciles 1 and 2 (highest disadvantage) and quintile 5 = deciles 9 and 10 (lowest disadvantage).
Ethnicity is total response so individual students may be counted in more than one ethnic group.
Additional information
These data follow a new definition of school leavers from the Ministry of Education ENROL system employed from 2009 onwards so comparison with previous years is not possible.
The proportion of school leavers who achieved an NCEA or equivalent qualification steadily increased from 2009 to 2017 when it reached a peak of 90% (Figure 83). The proportion in 2021 was 87%.
Figure 83 . Educational attainment of school leavers, by qualification, Aotearoa 2009–2021
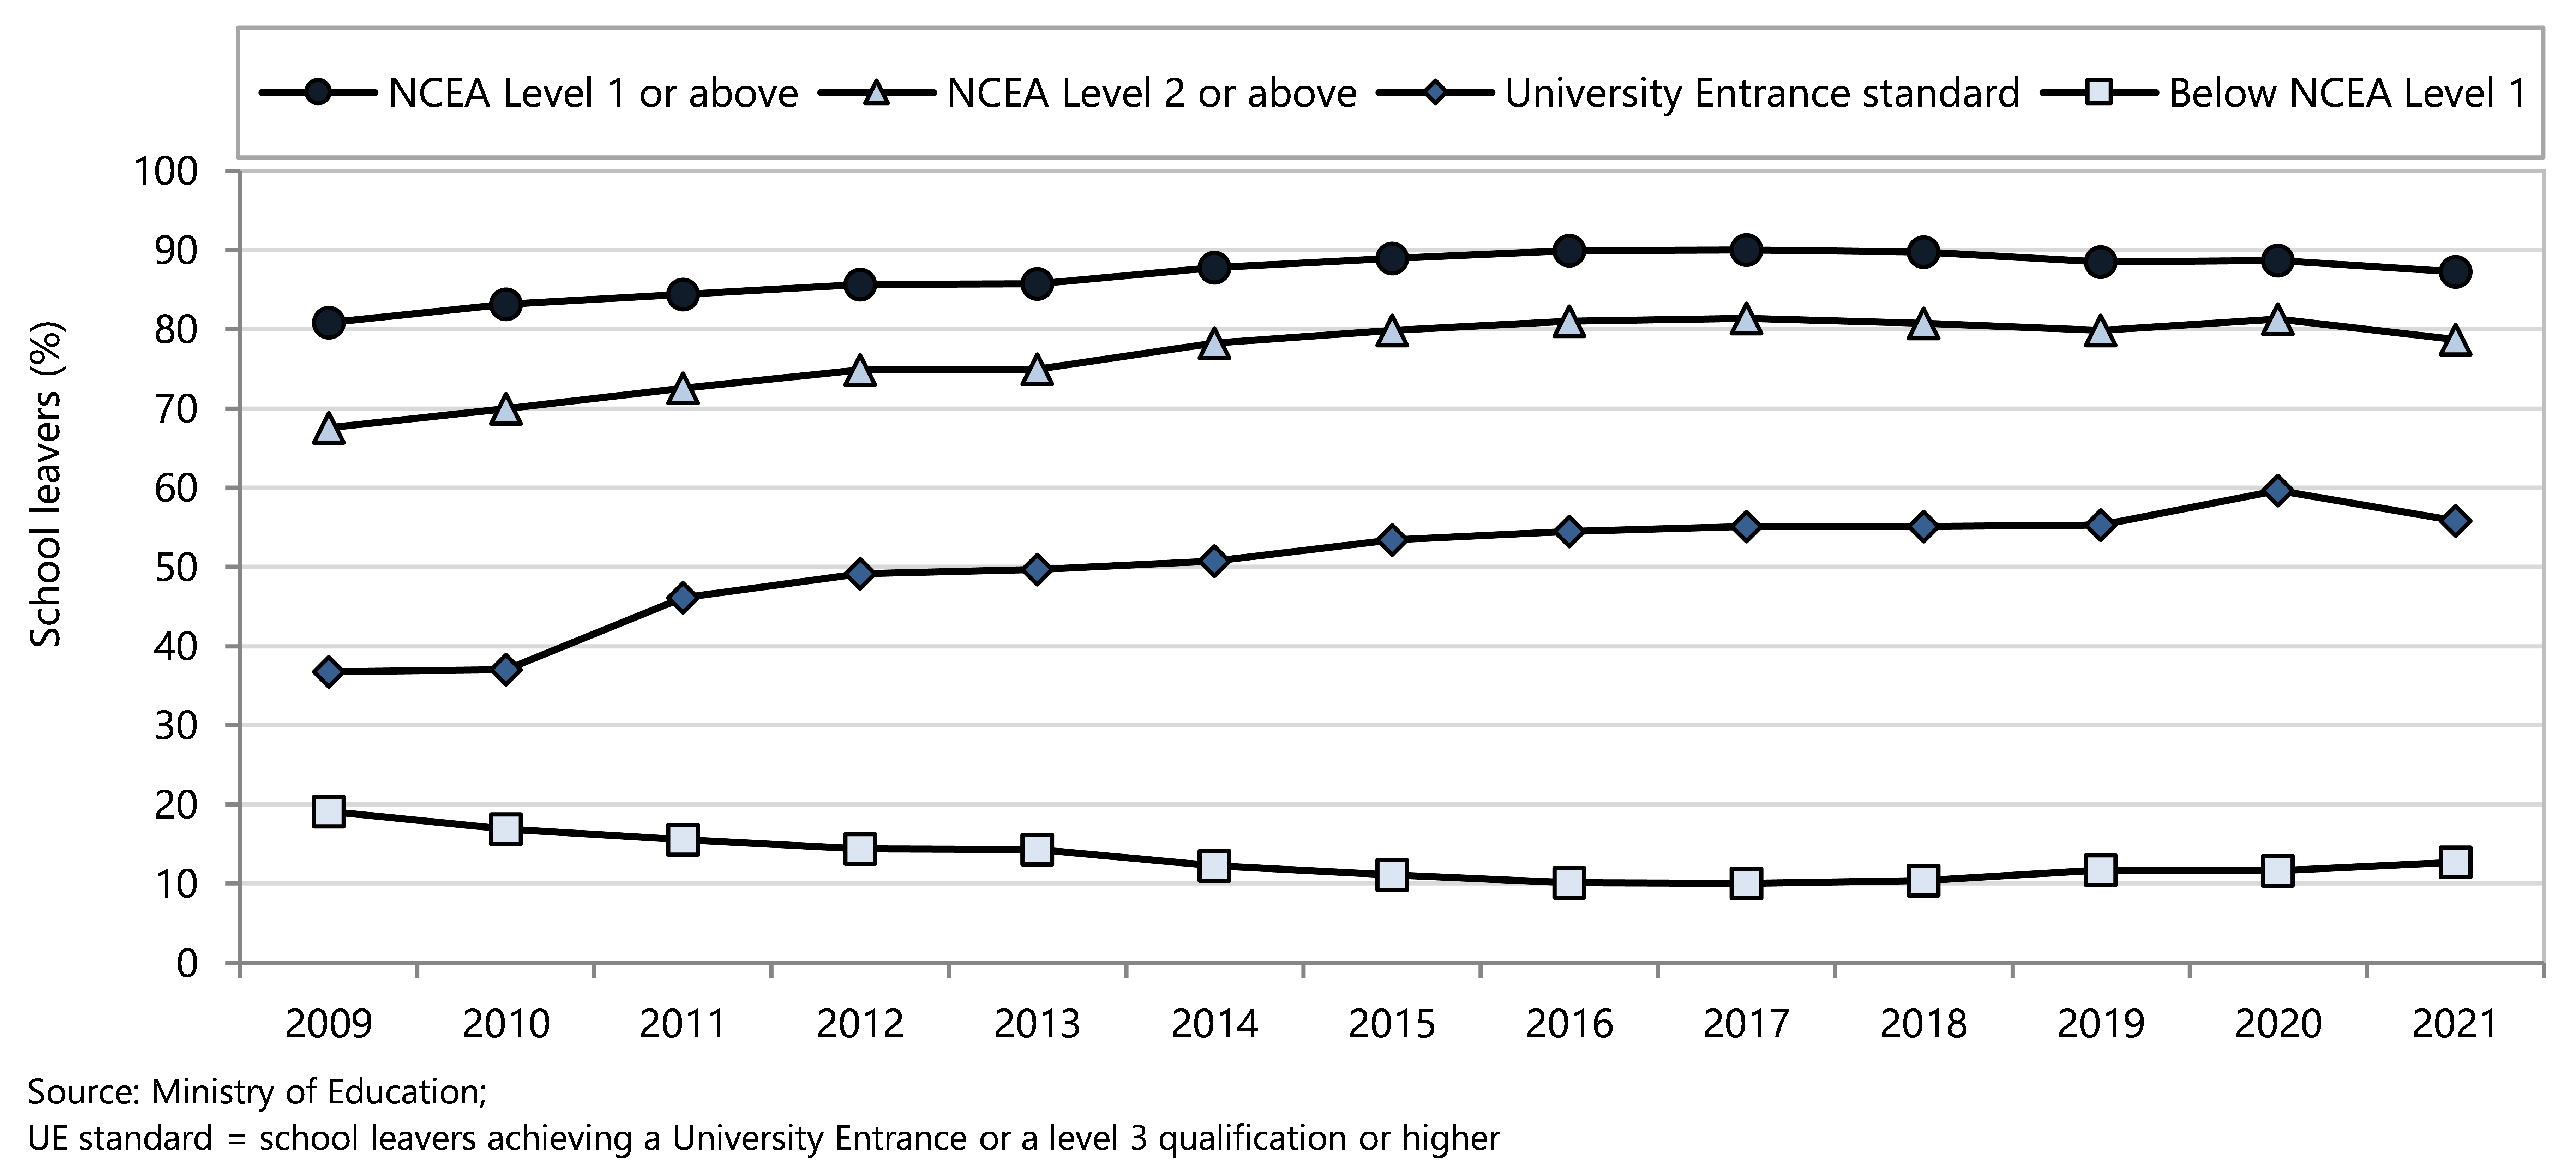
The proportion of school leavers achieving University Entrance (UE) standard steadily increased from 2000 to 2020 but dropped in 2021 (Figure 83) in all ethnic groups (Figure 84).
Inequities continue to be seen in educational attainment by ethnicity and by school socioeconomic quintile. In 2021 there was an increase in students leaving school without NCEA qualifications across all ethnic groups, with 24% of Māori school leavers in this group (Figure 84).
All ethnic groups reached a peak in UE standard in 2020 and have dropped by between two and five percent in 2021 (Figure 84).
Figure 84 . Educational attainment of school leavers, by qualification and by ethnicity, Aotearoa 2009–2021
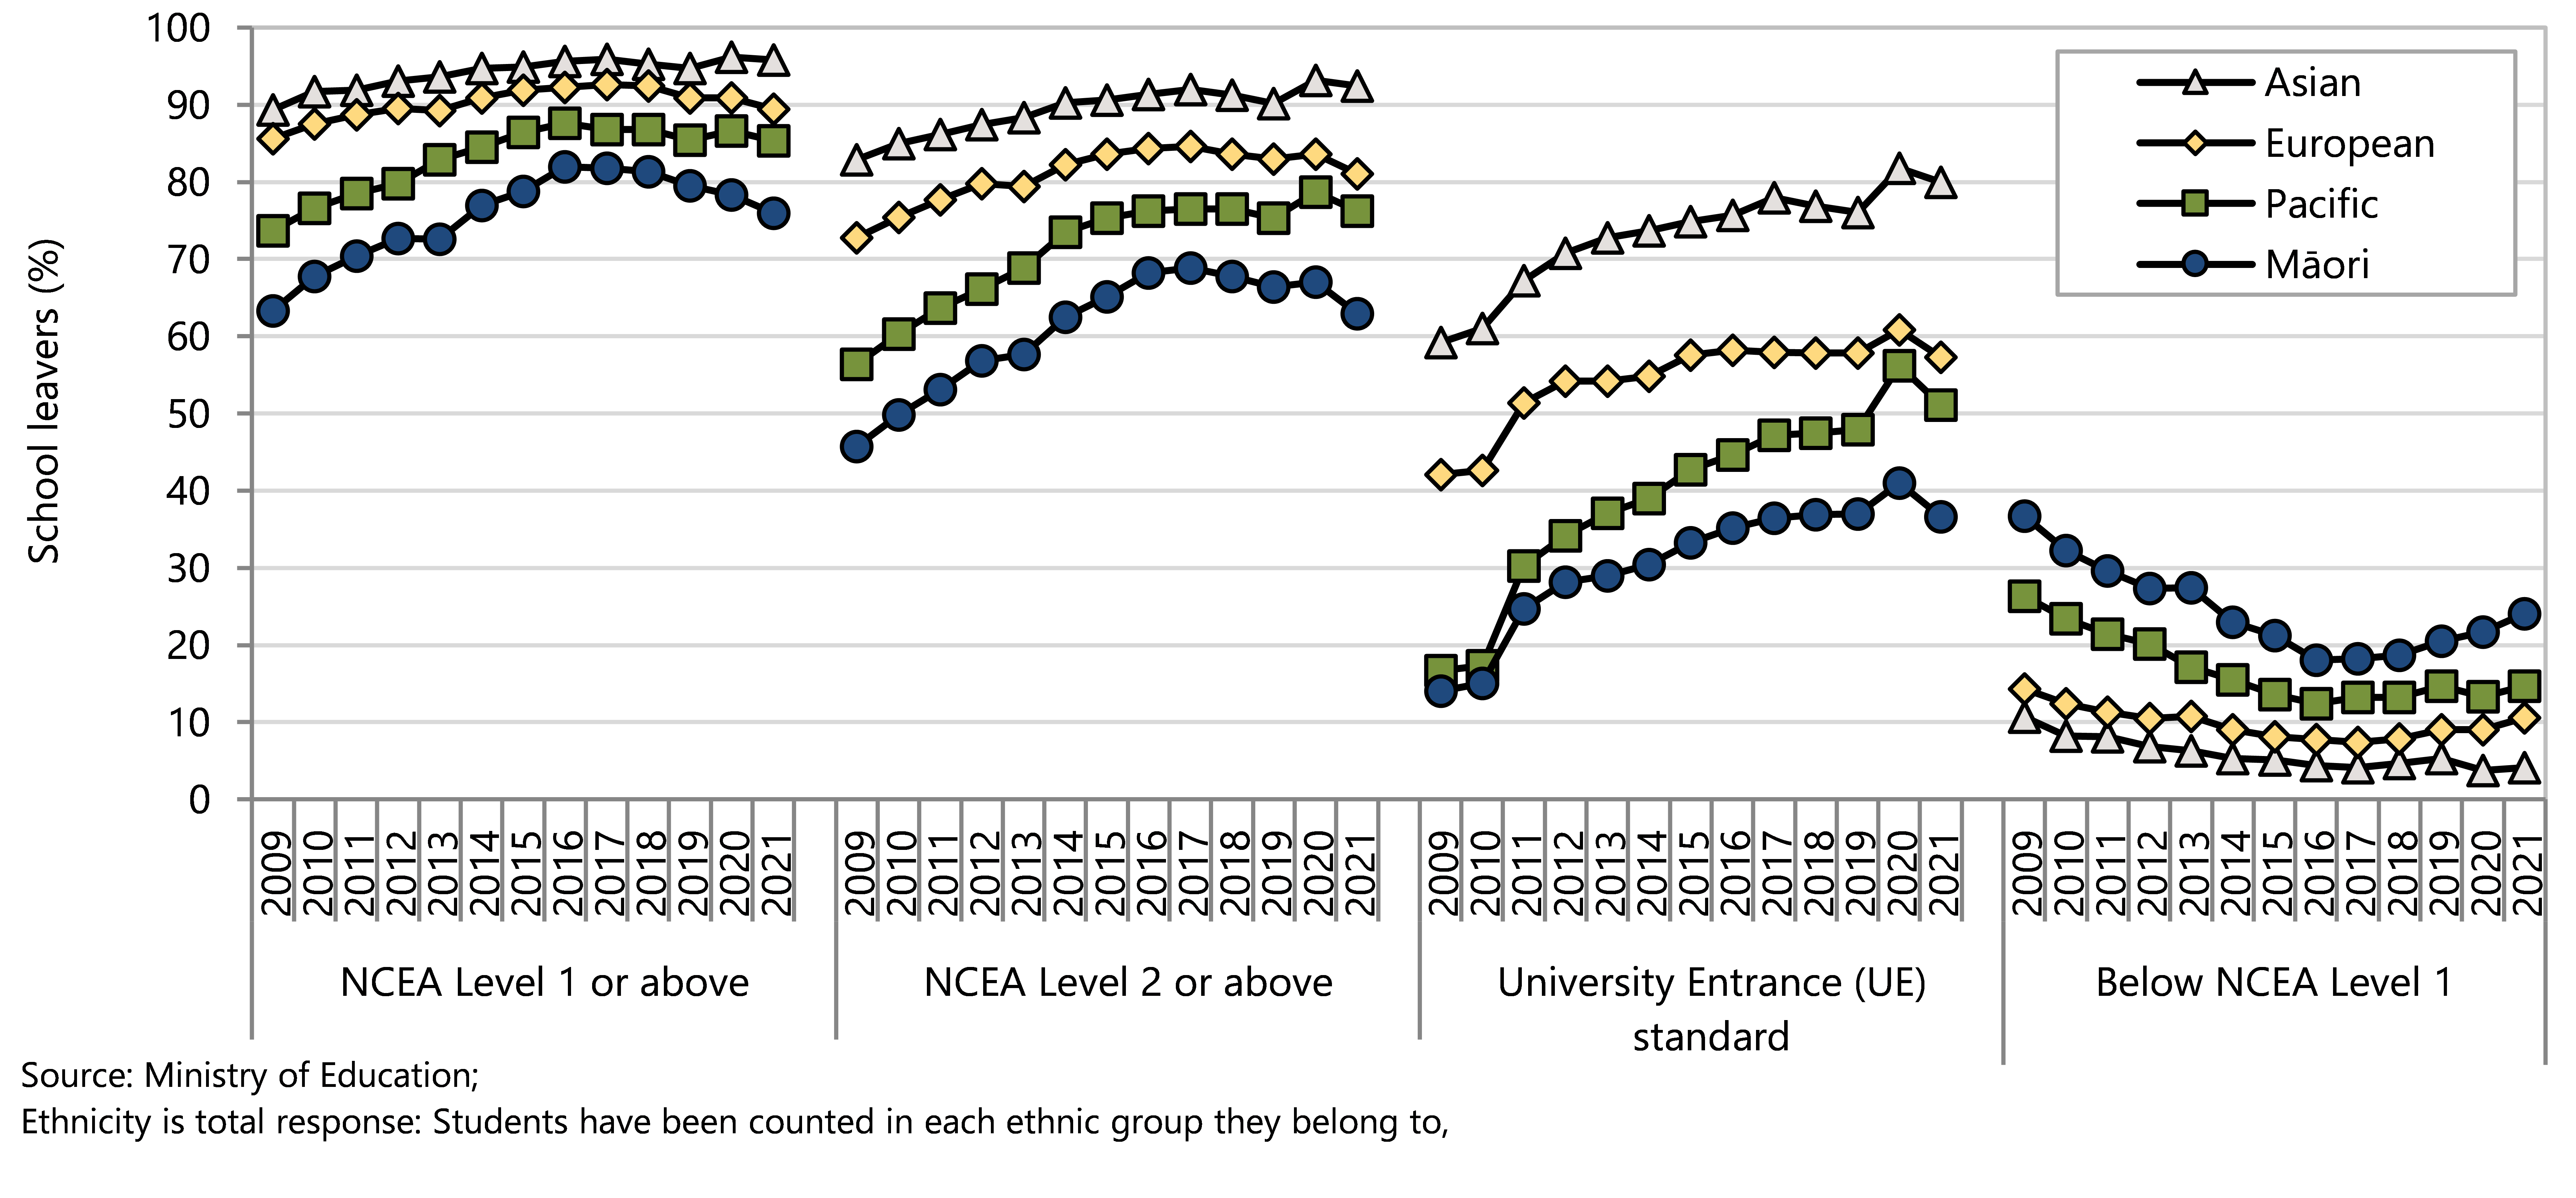
School quintile 1 includes the 20% of schools with the highest proportion of students from low socioeconomic communities; school quintile 5 comprises the 20% of schools with the lowest proportion of students from low socioeconomic communities.97 The ranking of school socioeconomic quintiles is in the opposite direction to that of the NZDep2013 index of deprivation used with health data in this report.
The proportion of young people leaving school without having achieved an NCEA qualification was 22.1% in Quintile 1 schools and 4.3% in Quintile 5 schools (Figure 85). In the lowest quintile schools 42% of young people left school achieving UE standard compared with 76% in the highest quintile schools (Figure 85).
Figure 85 . School leavers in school socioeconomic quintile, by qualification and by deprivation quintile, Aotearoa 2021
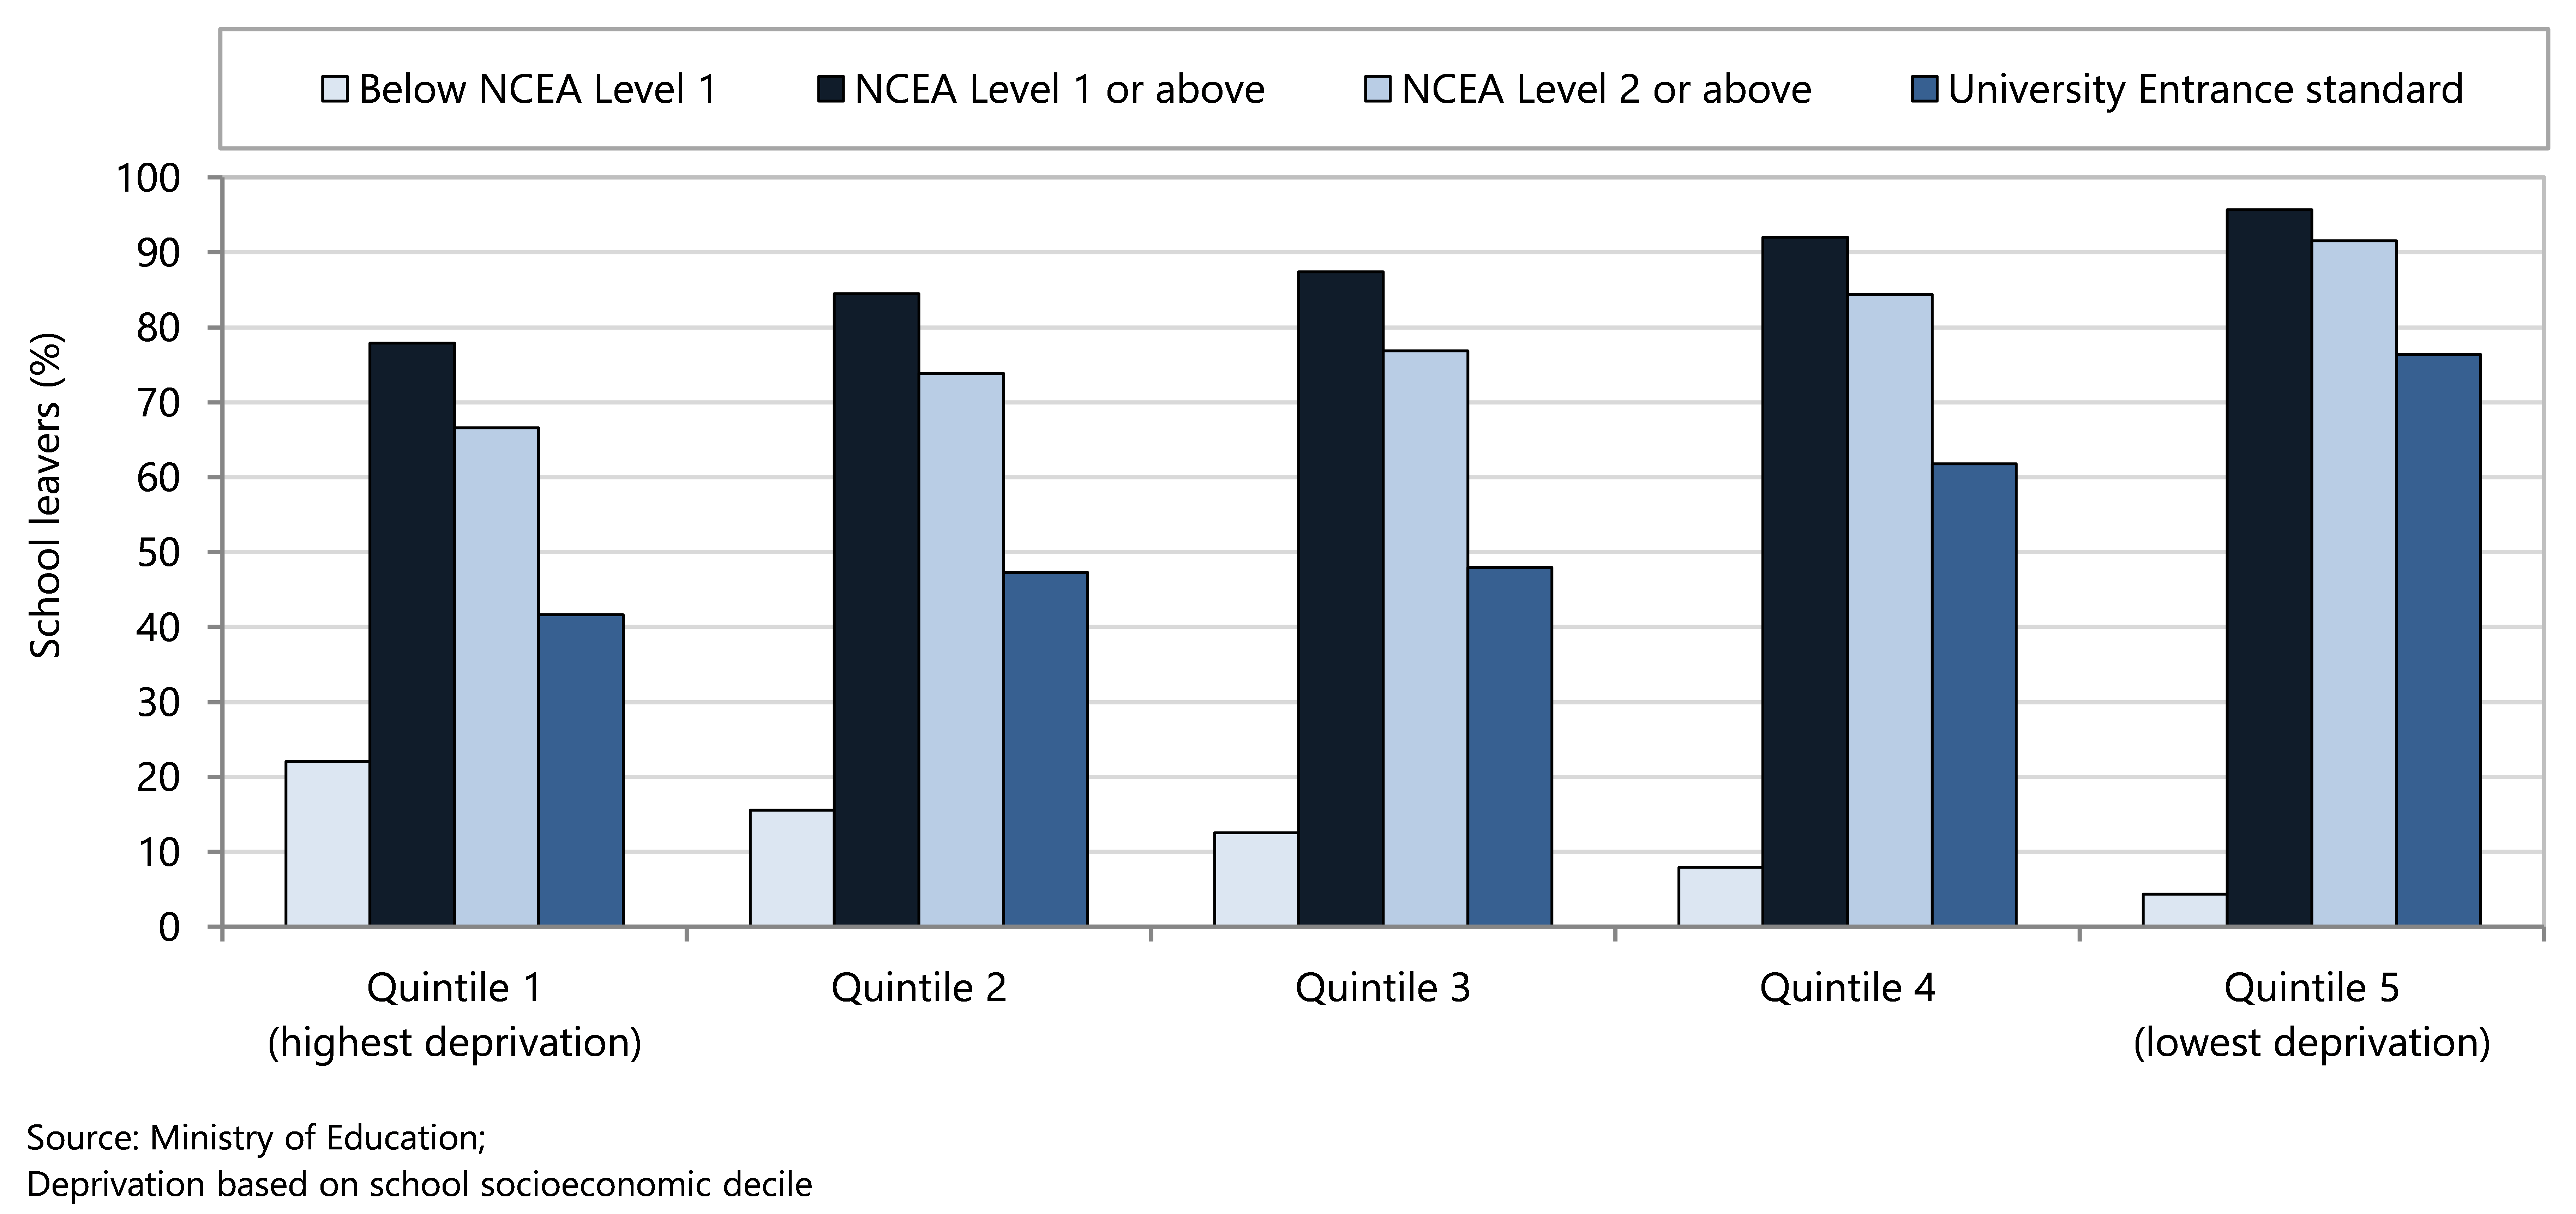
Regular attendance is achieved when a student attends more than 90% of the academic term. Being absent for five full days in any given term would result in falling below this threshold. Whilst the isolation period required for Covid-19 dropped from 10 days to 7 days in March 2022 it still resulted in an absence of 10% of the term or more. Forty percent of students did attend regularly in Term 2 (Figure 86). The highest proportion of students attending regularly was 69.5%, achieved in 2015.
Figure 86 . Students attending school regularly, by year, Aotearoa 2011–2022
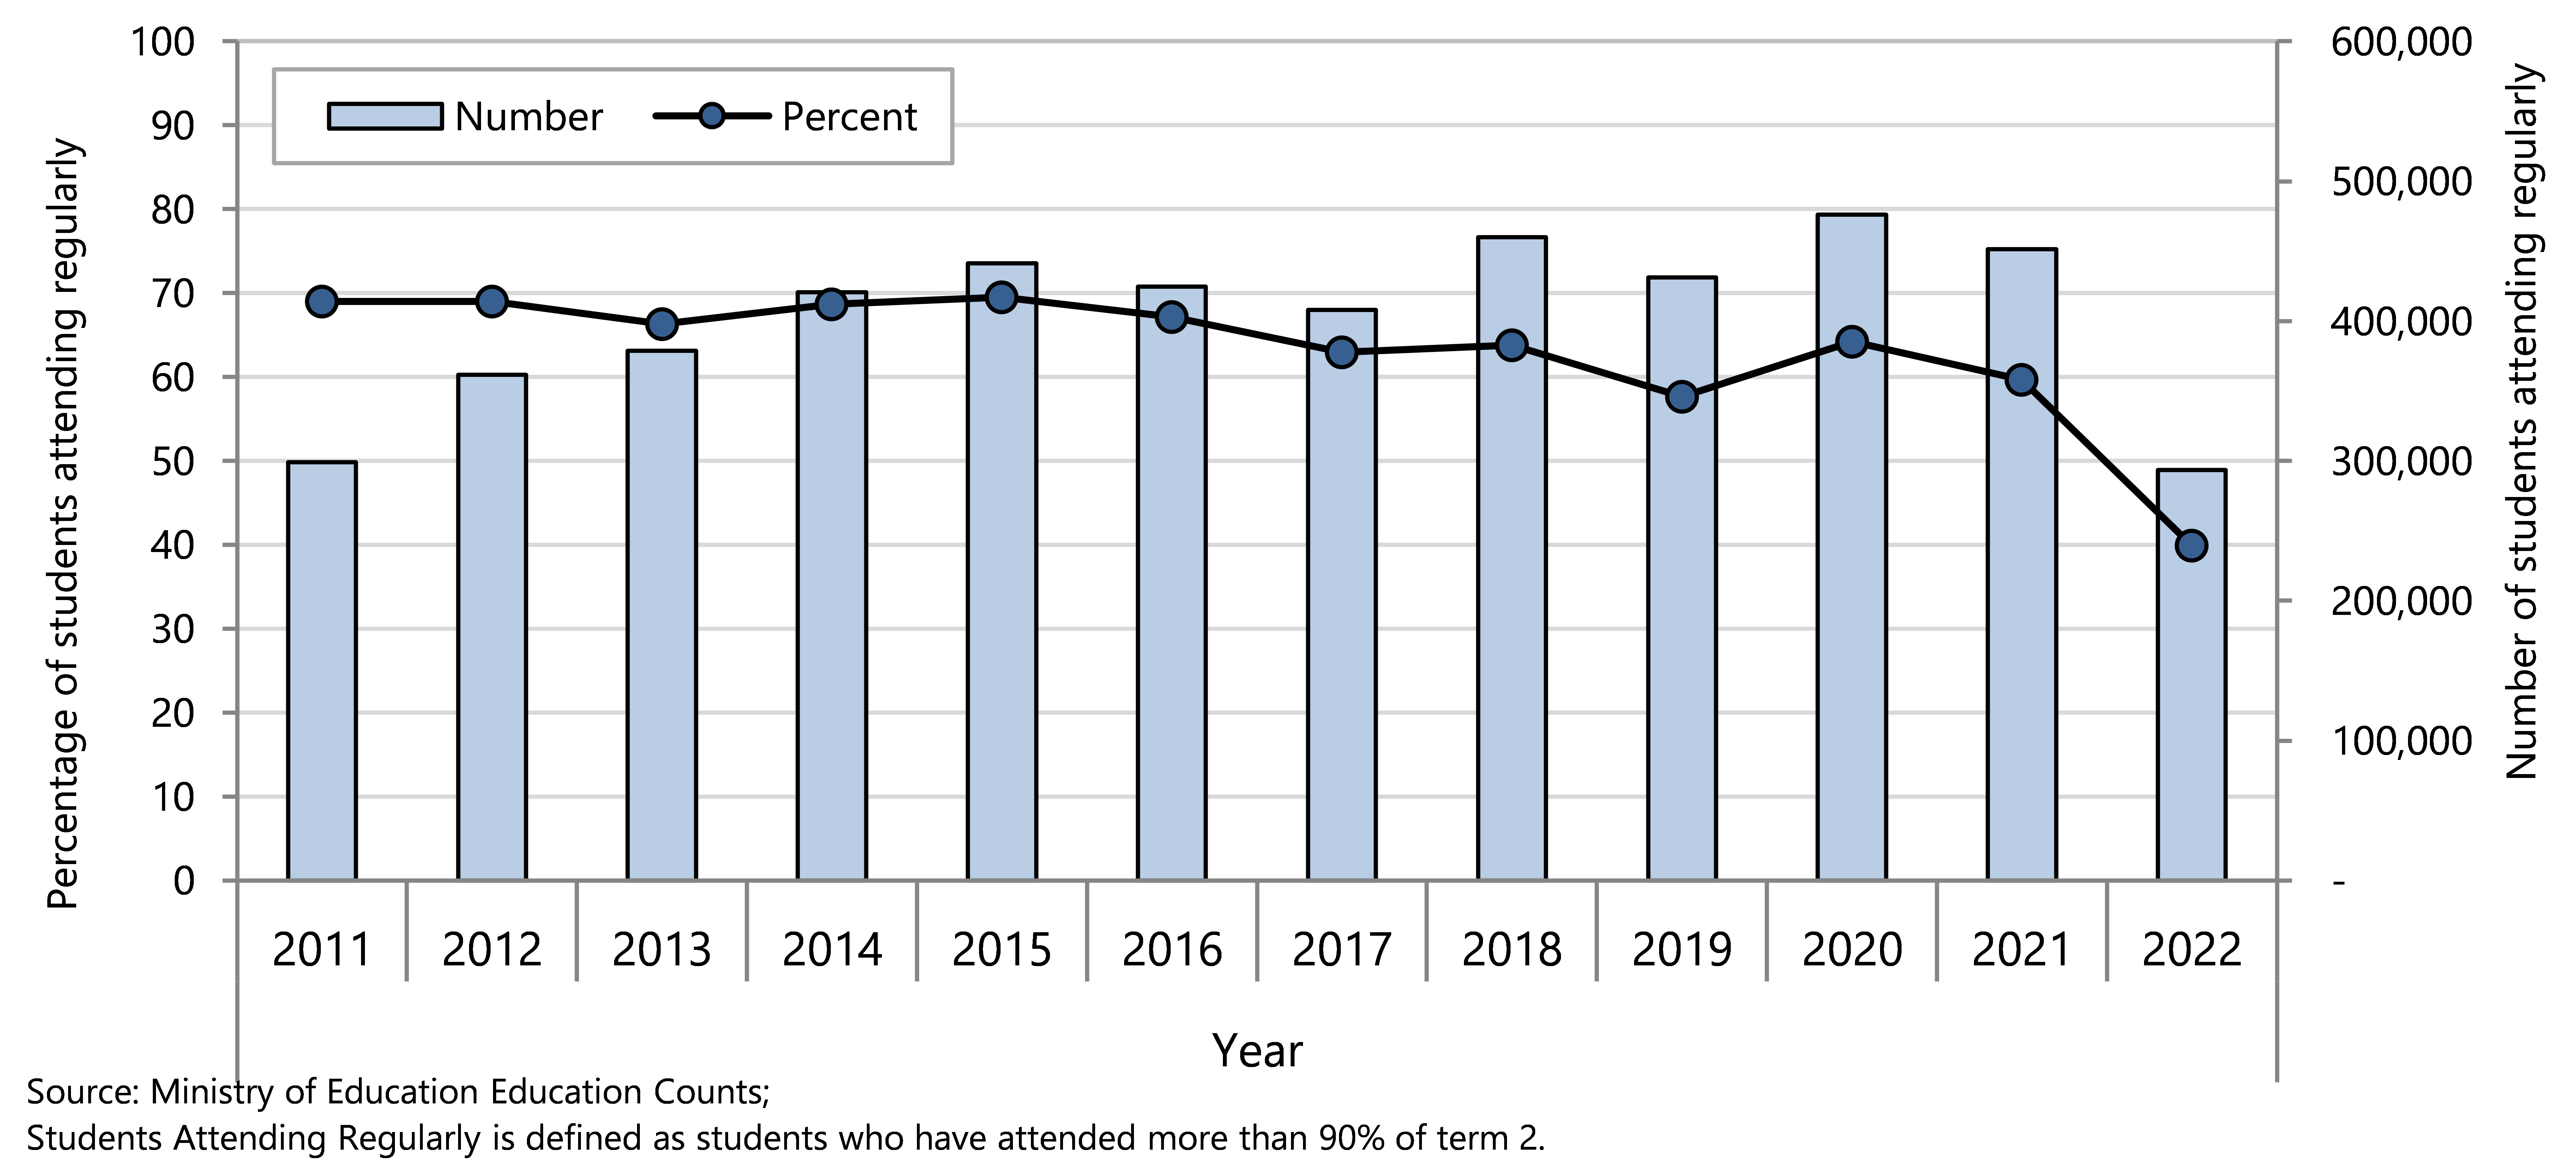
Between 38% and 45% of children in school years 1 to 9 attended regularly in 2022 (Figure 87). Regular school attendance was lower for students in school years 10–12 (34% to 40%) and lower again for students in Year 13 (29% of female students and 34% of male students).
Figure 87 . Students attending school regularly, by school year level and by gender, Aotearoa 2022
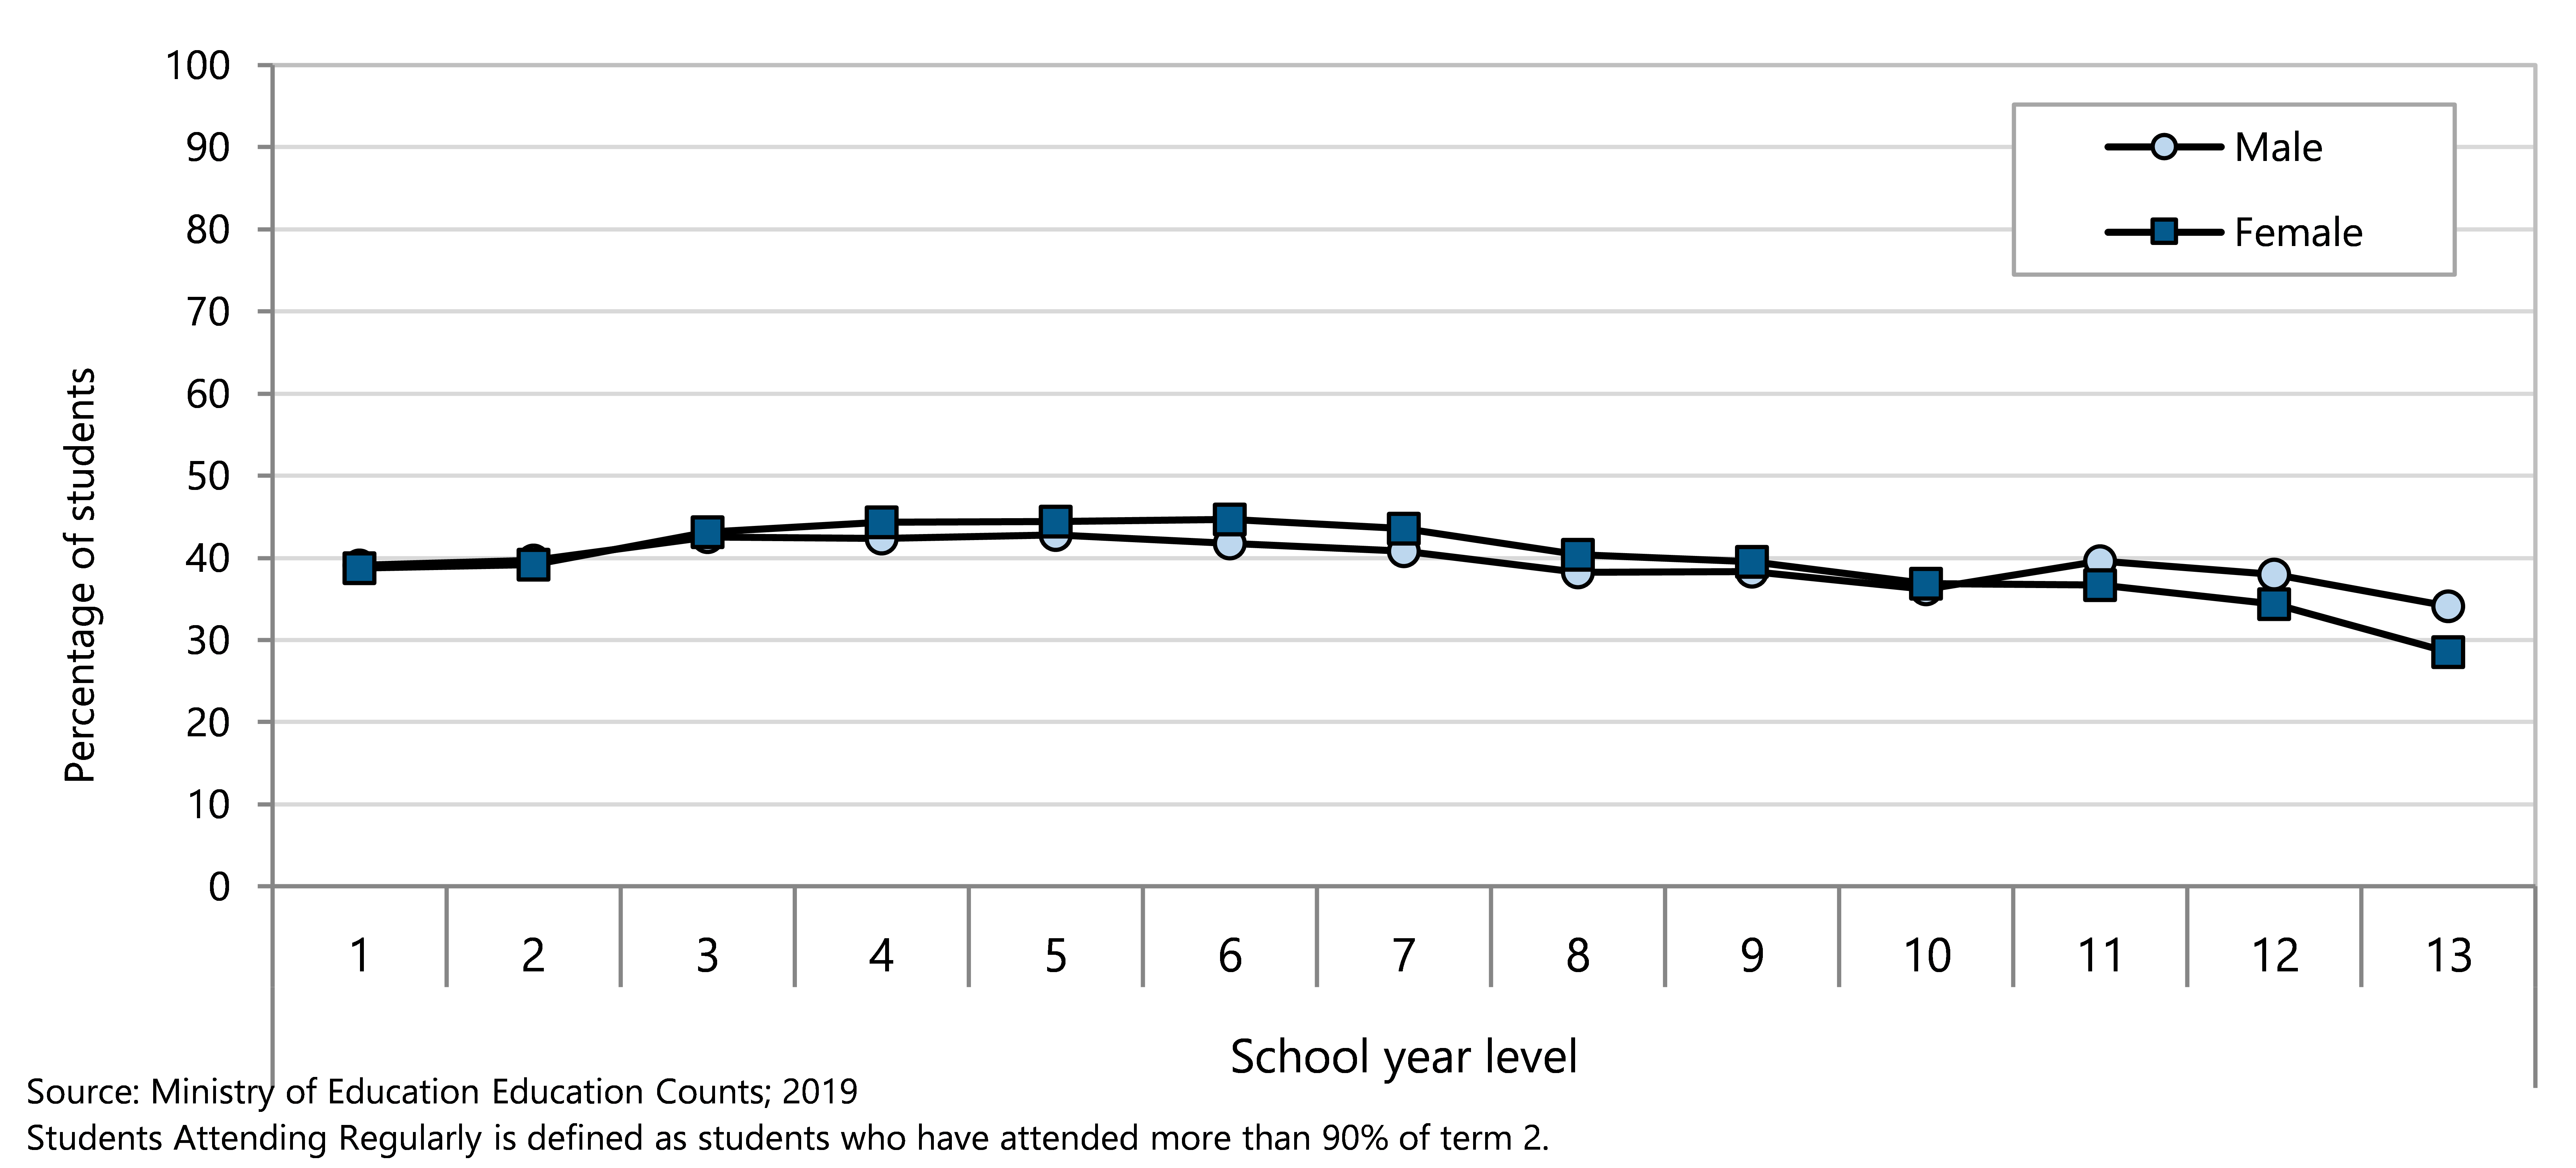
The proportion who attended school regularly from 2015–2022 shows a downward trend across all ethnic groups. The differences between ethnic groups remains relatively similar over time, with a drop of close to 30% for each ethnicity compared to 10 years earlier (Figure 88).
Figure 88 . Students attending school regularly, by year and by ethnicity, Aotearoa 2011–2022
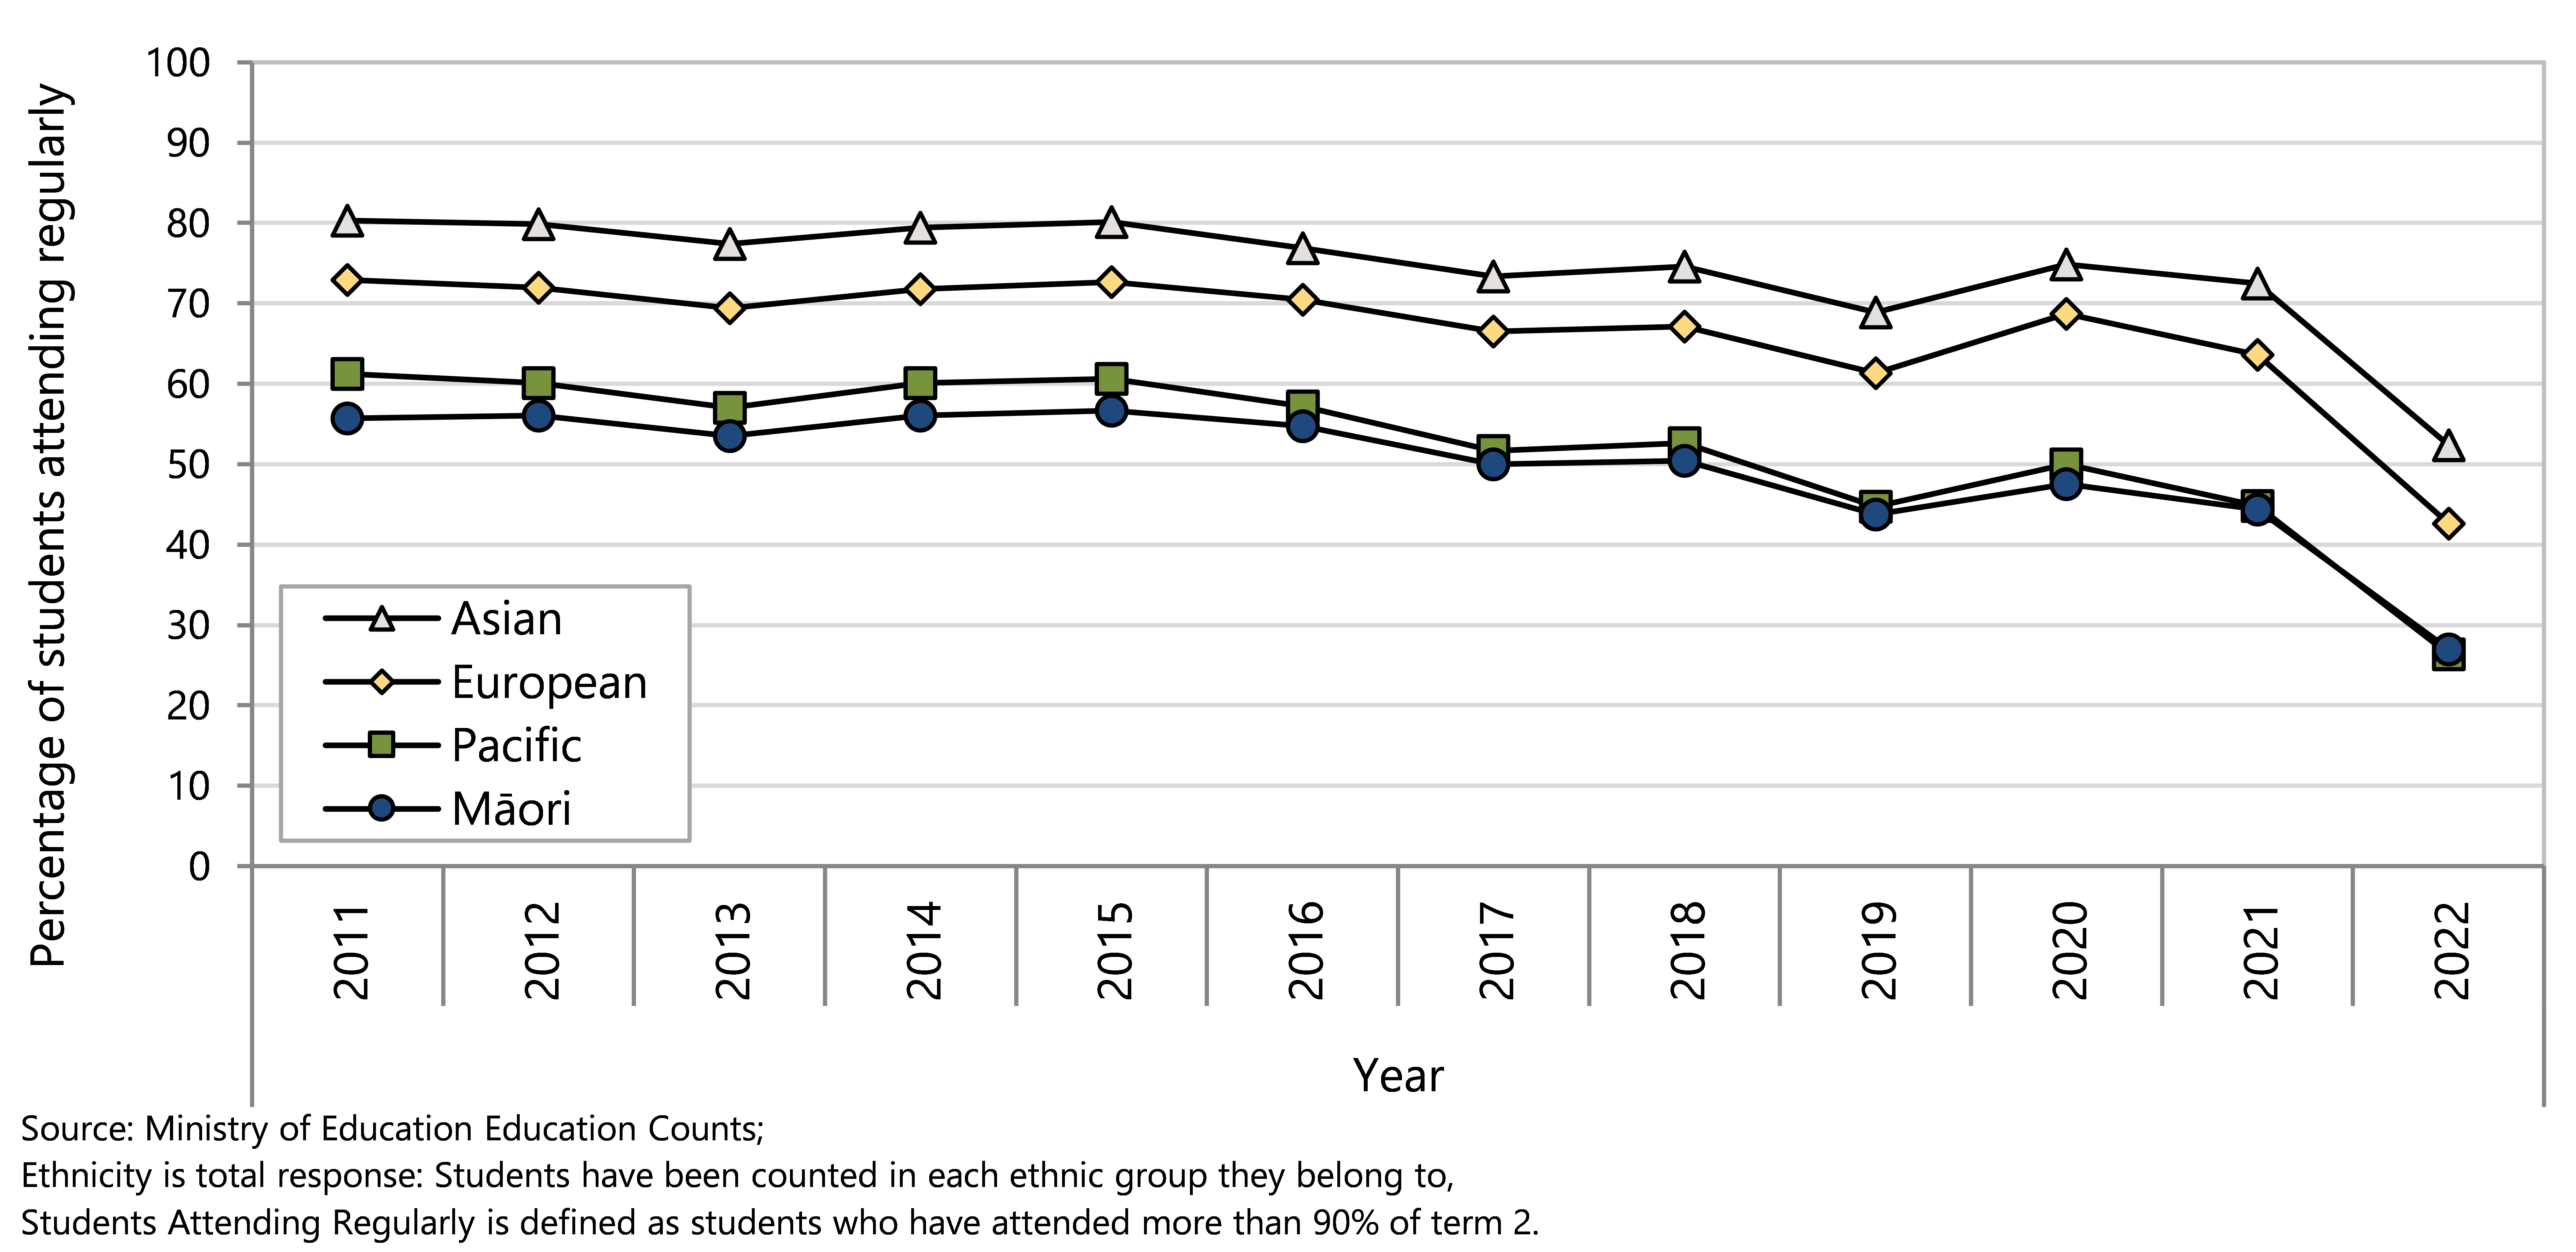
School decile 1 includes the 10% of schools with the very highest proportion of students from low socioeconomic communities; school decile 10 comprises the 10% of schools with the very lowest proportion of students from low socioeconomic communities. 97
Inequities in regular attendance by school socioeconomic classification have persisted over time, with the greatest difference between students in school decile 1 and students in school decile 10 noted in 2020 (41% vs. 75%) (Figure 89).
Figure 89 . Students attending school regularly, by year and by selected school deprivation decile, Aotearoa 2011–2022
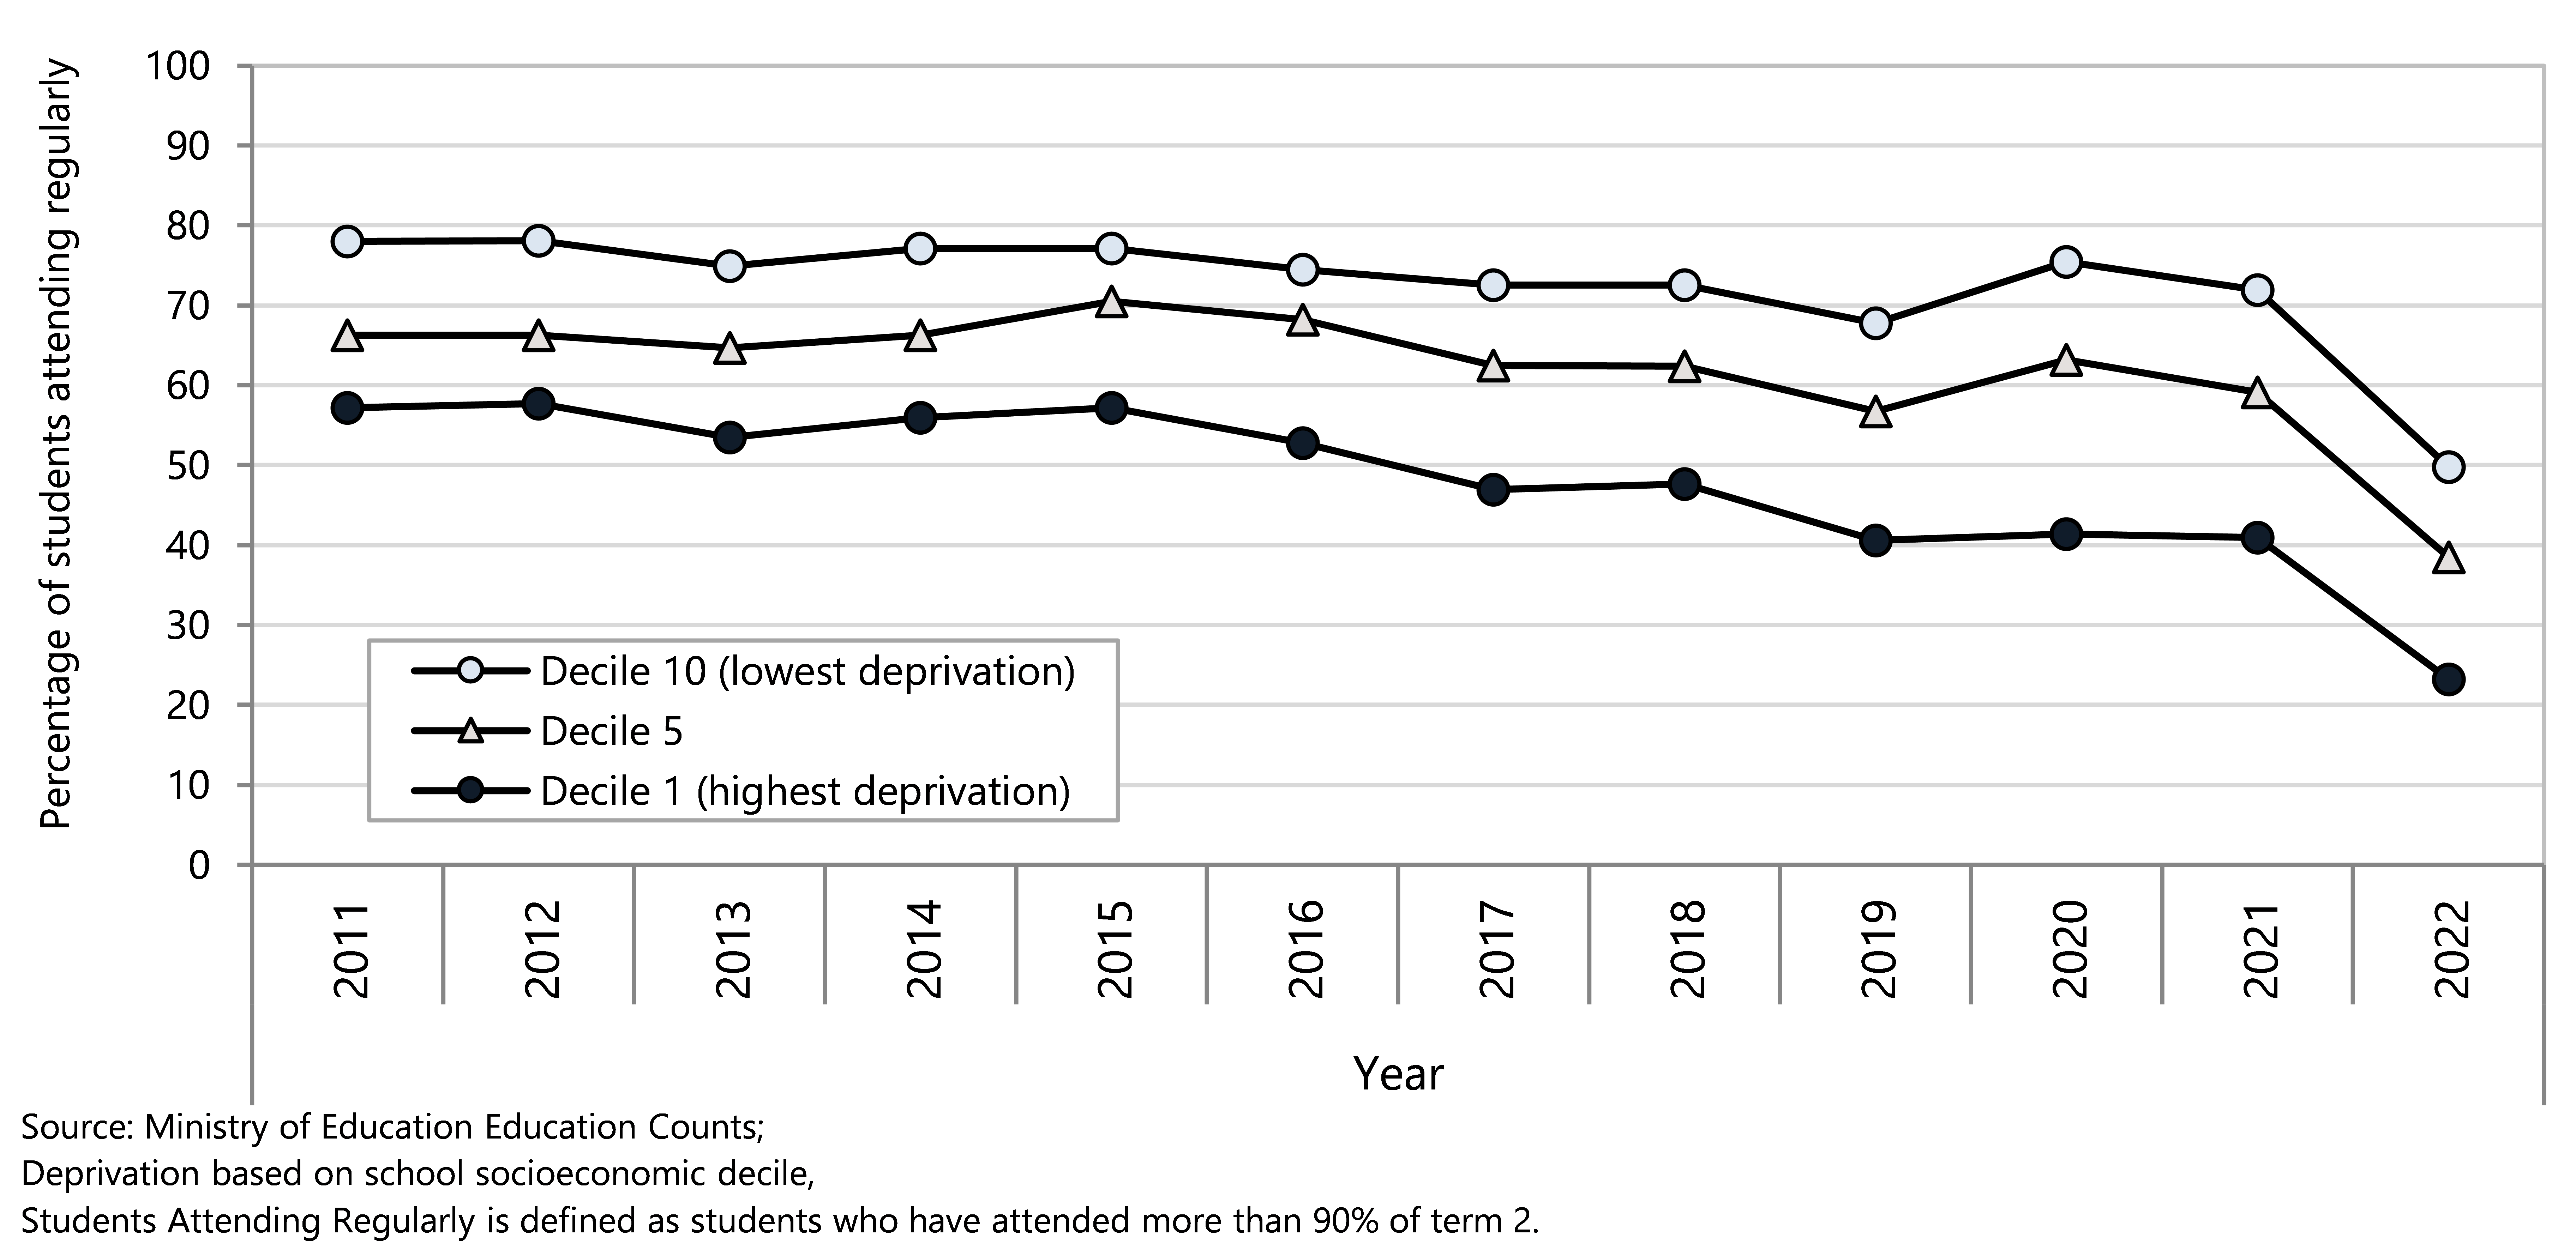
Appendix 1: ICD-10-AM codes for potentially avoidable hospitalisations
Medical conditions |
|
| Respiratory |
|
| Pneumonia | J12, J15, J16, J18, J69, J851 |
| Asthma and wheeze | J45–J46, R062* |
| Acute bronchitis | J20 |
| Acute bronchiolitis | J21 |
| Upper respiratory infections | J00–J04, J06, J050 |
| Lower respiratory tract infection (LRTI) | J22 |
| Bronchiectasis | J47 |
| Dental |
|
| Dental caries | K02 |
| Diseases of pulp and periapical tissues | K04 |
| Gastrointestinal |
|
| Constipation | K590 |
| Gastroenteritis/dehydration | A00–A09, R11, K529 |
| Gastro-oesophageal reflux disease | K21 |
| Nutrition deficiency and anaemia |
|
| Anaemia | D50–D53 |
| Nutritional deficiency | E40–E46, E50–E56, E58–E61, E63, E64 |
| Cardiovascular |
|
| Acute rheumatic fever | I00–I02 |
| Chronic rheumatic heart diseases | I05–I09 |
| Otitis media |
|
| Otitis media | H65–H67 |
| Dermatological |
|
| Skin infections | L00–L05, L08, H000, H010, J340, L980 |
| Dermatitis and eczema | L20–L30 (for L22, 0-14 only) |
| Diabetes |
|
| Diabetes and complications | E10, E11, E13, E14, E162 |
| Renal tract |
|
| Kidney, urinary tract infection | N10, N12, N136, N300, N309, N390 |
| Sexually transmitted infections (STIs) |
|
| Sexually transmitted infections (STIs) | A50–A60, A63, A64, M023, N341 |
| Vaccine-preventable diseases |
|
| Influenza and related pneumonia | J09–J11, J13, J14, |
| Haemophilus meningitis | G000 |
| Meningococcal infection | A390–A395, A398, A399 |
| Tetanus, Diphtheria, Whooping cough | A33–A35, A36, A370, A371, A378, A379 |
| Poliomyelitis | A80 |
| Varicella (chickenpox) | B010–B012, B018, B019 |
| Measles, Rubella, Mumps | B050–B054, B058, B059, B06, P350, M014, B260–B263, B268, B269 |
| Hepatitis A, Hepatitis B | B150, B159, B160–B162, B169 |
| Chronic viral hepatitis | B180–B182 |
| Tuberculosis | A15–A19 |
| Epilepsy |
|
| Epilepsy | G40, G41, O15, R568 |
| Other non-injury conditions |
|
| Other non-injury conditions | A403, M86, A87, G01–G03, B34, B171 |
Injury and poisoning (external cause codes) | |
| Unintentional injuries | V010–V899, V910-V919, V930–V978, V98, V99, Y850, Y859, W00–W19, X00–X19, W65–W74, V900–V909, V920–V929, X40–X49, W20–W49, W53–W598, W610–W619, X20–X278, X29, X50, V00, W50–W52, W60, W64, W75–W79, W80–W84, W85–W99, X28, X30–X39, X51–X57 |
| Intentional injuries | X60–X84, Y870, X85–X99, Y0000–Y0909, Y871, Y3501–Y369, Y890, Y891 |
Medical hospitalisations acute and arranged admissions (arranged = within 7 days of referral); Injury hospitalisations exclude ED admissions and waiting list admissions; Injury range does not include diagnostic codes of late effects of injuries, poisonings, toxic effects, and other external causes
Appendix 2: New Zealand Index of deprivation
The NZ index of deprivation (NZDep) was first created using information from the 1991 census, updated following each census. It is a small area index of deprivation used as a proxy for socio-economic status. The main concept underpinning small area indices of deprivation is that the socio-economic environment in which a person lives can confer risks or benefits which may be independent of their own social position within a community.114 They are aggregate measures, providing information about the wider socio-economic environment in which a person lives, rather than information about their individual socio-economic status.
The latest index, NZDep2018, combines nine variables from the 2018 census to reflect eight dimensions of material and social deprivation (Table 11). Each variable represents a standardised proportion of people living in an area who lack a defined material or social resource. These are combined to give a score representing the average degree of deprivation experienced by people in that area. Individual area scores are ranked and placed on an ordinal scale from 1 to 10, with decile 1 reflecting the least deprived 10% of small areas and decile 10 reflecting the most deprived 10% of small areas.115
The advantage of the NZDep is its ability to assign measures of socio-economic status to the older population, the people who are not in employment, and to children, to whom income and occupational measures often don’t apply, as well as to provide proxy measures of socio-economic status for large datasets when other demographic information is lacking. Small area indices have limitations, however, as not all individuals in a particular area are accurately represented by their area’s aggregate score. While this may be less of a problem for very affluent or very deprived neighbourhoods, in average areas, aggregate measures may be much less predictive of individual socio-economic status.114 Despite these limitations, the NZDep has been shown to be predictive of mortality and morbidity from a number of diseases in New Zealand.
Table 11. Variables used in the NZ index of deprivation 2018 (NZDep2018)
| Dimension | Variable in order of decreasing weight in the index |
| Communication | People with no access to the Internet at home |
| Income | People aged 18–64 receiving a means tested benefit |
| Income | People living in equivalised* households with income below an income threshold |
| Employment | People aged 18–64 who are unemployed |
| Qualifications | People aged 18–64 without any qualifications |
| Owned home | People not living in own home |
| Support | People aged <65 living in a single parent family |
| Living space | People living in equivalised* households below a bedroom occupancy threshold |
| Physical environment | People living in dwellings that are always damp and/or always have mould greater than A4 size |
Appendix 3: Data sources
The Child Poverty Monitor presents information derived from several national administrative datasets. These are described briefly below, and limitations and issues to be aware of when interpreting results drawn from these sources are outlined.
National Mortality Collection
The National Mortality Collection is a dataset managed by Manatū Hauora which contains information on the underlying cause, or causes, of death along with basic demographic data for all deaths registered in New Zealand since 1988. Fetal and infant death data are a subset of the Mortality Collection, and cases in this subset have additional information on factors such as birth weight and gestational age.116 Each of the approximately 28,000 deaths occurring in New Zealand each year is coded manually by Manatū Hauora staff. For most deaths the Medical Certificate of Cause of Death provides the information required, although coders also have access to information from other sources such as Coronial Services, Police, NZ Transport Agency, the NZ Cancer Registry, the Institute of Environmental Science and Research, and Water Safety NZ.117
National Minimum Dataset
The National Minimum Dataset (NMDS) is the national hospital discharge dataset and is maintained by Manatū Hauora. It is used for policy formation, performance monitoring, and research purposes, providing key information about the delivery of hospital inpatient and day patient health services both nationally and on a provider basis. It is also used for funding purposes.118
Information in the NMDS includes principal and additional diagnoses, procedures, external causes of injury, length of stay and sub-specialty codes; and demographic information such as age, ethnicity, and usual area of residence. Data have been submitted by public hospitals electronically since the original NMDS was implemented in 1993, with additional data dating back to 1988 also included. The private hospital discharge information for publicly funded events has been collected since 1997. The current NMDS was introduced in 1999.118
Birth Registration Dataset
Since 1995 all NZ hospitals and delivering midwives have been required to notify the Department of Internal Affairs within five working days of the birth of a live or stillborn baby. This applies to stillborn babies born at or more than 20 weeks gestation, or those weighing 400g or more; prior to 1995, only stillborn babies reaching more than 28 weeks of gestation required birth notification. Information on the hospital’s notification form includes maternal age, ethnicity, multiple birth status, and the baby’s sex, birth weight, and gestational age. In addition, parents must jointly complete a birth registration form as soon as reasonably practicable after the birth, and within two years of delivery, which duplicates the above information with the exception of birth weight and gestational age. Once both forms are received by Internal Affairs the information is merged into a single entry. This two-stage process is thought to capture 99.9% of births occurring in New Zealand and cross-checking at the receipting stage allows for the verification of birth detail.119
Dataset limitations
There are limitations when using any of these datasets. The following are of particular relevance to this report. The quality of data submitted to the administrative national datasets may vary. While the data for the National Mortality Collection and the Birth Registration Dataset are coded by single agencies, the clinical information held in the NMDS is entered by health providers before being collated by Manatū Hauora. In a 2001 review of the quality of coding in the data submitted to the NMDS, 2,708 events were audited over ten sites during a three month period. Overall the audit found that 22% of events required a change in coding, although this also included changes at a detailed level. Changes to the principal diagnosis involved 11% of events, to additional diagnoses 23%, and to procedure coding, 11%. There were 1,625 external causes of injury codes, of which 15% were re-coded differently.120 These findings were similar to an audit undertaken a year previously. While the potential for such coding errors must be taken into consideration when interpreting the findings of this report, the average 16% error rate indicated by the 2001 review may be an overestimate as, in the majority of the analyses undertaken in this report, only the principal diagnosis is used to describe the reason for admission.
Changes in the coding systems used over time may result in irregularities in time series analyses.117 New Zealand hospitals use the clinical coding classification developed by the World Health Organization and modified by the National Centre for Classification in Health, Australia. The current classification is called The International Statistical Classification of Diseases and Related Health Problems, Tenth Revision, Australian Modification (ICD-10-AM), the Australian Classification of Health Interventions (ACHI) and Australian Coding Standards (ACS). The introduction of ICD-10-AM represented the most significant change in classification in over 50 years, expanding the number of codes from ~5,000 to ~8,000, to provide for recently recognised conditions and allow greater specificity about common diseases.
From 1988 until 1999, clinical information in the NMDS was coded using versions of the ICD-9 classification system. From July 1999 onwards, the ICD-10-AM classification system has been used. Back and forward mapping between the two systems is possible using predefined algorithms,118 and for most conditions there is a good correspondence between ICD-9 and ICD-10-AM codes. Care should still be taken when interpreting time series analyses which include data from both time periods as some conditions may not be directly comparable between the two coding systems.
Stats NZ Child poverty statistics
The Stats NZ’s Child Poverty Statistics are produced for the 2021/22 year and previous years using the Household Economic Surveys (HES) and administrative (admin) data via the Integrated Data Infrastructure (IDI).12 The NZ HES is a survey of around 20,000 households, randomly sampled, including households with children. For more information, please refer to the Child Poverty Statistics Technical Appendix 2022.12 The sample size increased from 2018/19 to obtain good measures of child poverty. The methodology also changed to make greater use of administrative data . Survey completion was negatively affected by COVID-19 pandemic-related factors and so the sample size was lower than intended in 2019/20 and 2020/21.
Table 12. Number of survey participants and coverage, New Zealand Household Economic Surveys
| Survey year (1 July–30 June) | Achieved sample size | Coverage (%) |
| New Zealand Household Economic Surveys | ||
| 2011/12 | 3,565 | 83 |
| 2012/13 | 3,003 | 67 |
| 2013/14 | 3,391 | 81 |
| 2014/15 | 5,561 | 78 |
| 2015/16 | 3,499 | 78 |
| 2016/17 | 3,703 | 83 |
| 2017/18 | 5,482 | 76 |
| 2018/19 | 21,279 | 75 |
| 2019/20 | 16,151 | 82 |
| 2020/21 | 16,196 | 82 |
New Zealand Health Survey
The New Zealand Health Survey (NZHS) became an annual survey in 2011. The survey is conducted by interviewing a sample of adults and children’s parents or caregivers. The NZHS consists of a core set of questions that cover a range of health-specific indicator areas, including health behaviours, conditions, and use of health services. The survey also includes a flexible programme of rotating topic modules, which change every 12 months.121 Table 13 presents the number of participants selected for each NZHS conducted and the corresponding coverage rate (an indicator of the extent to which the population has been involved in the survey).
The NZHS reports present adjusted rate ratios to account for the potential influence of other demographic factors on comparisons between groups. Gender comparisons are adjusted for age, ethnic comparisons are adjusted for age and gender, and deprivation comparisons are adjusted for age, gender and ethnicity.122
Table 13. Number of survey participants and coverage, New Zealand Health Survey
| Survey year (1 July–30 June) | Adults (15 years and over) | Children (0–14 year olds) | ||
| n | Coverage (%) | n | Coverage rate (%) | |
| New Zealand Health Survey | ||||
| 2006/2007 | 12,488 | 59 | 4,921 | 67 |
| 2011/2012 | 12,370 | 54 | 4,478 | 68 |
| 2012/2013 | 13,009 | 59 | 4,485 | 69 |
| 2013/2014 | 13,309 | 54 | 4,699 | 63 |
| 2014/2015 | 13,497 | 59 | 4,754 | 69 |
| 2015/2016 | 13,781 | 67 | 4,721 | 76 |
| 2016/2017 | 13,598 | 63 | 4,668 | 73 |
| 2017/2018 | 13,869 | 61 | 4,723 | 74 |
| 2018/2019 | 13,572 | 62 | 4,503 | 72 |
| 2019/2020 | 9,699 | 62 | 3,290 | 72 |
| 2020/2021 | 9,709 | 62 | 2,954 | 68 |
| 2021/2022 | 4,434 | 44 | 1,323 | 48 |
Estimated prevalence
The NZHS presents the demographic factors for each surveyed condition using unadjusted prevalence rates and adjusted rate ratios. The survey uses the calibrated weighting method to construct survey weights that rate up the responding sample to represent the target population. This method takes into account the probability of selection of each respondent, and uses external population benchmarks (typically based on the most recent population census) to correct for any discrepancies between the sample and population benchmarks (by age, sex, ethnicity and the New Zealand Index of Deprivation).122
The prevalence of a condition, or the proportion of the population with the condition was estimated by calculating the sum of the weights for the survey respondents with the condition divided by the sum of the weights of all survey respondents. For example, the sum of the weights for survey respondents with self-reported diabetes is divided by sum of the weights for all survey respondents.122
Further information on the NZHS results, content, methodology, and interpretation of the estimates is available on the NZHS website http://www.health.govt.nz/nz-health-statistics/national-collections-and-surveys/surveys/current-recent-surveys/new-zealand-health-survey
Ethnicity in National Datasets
There were inconsistencies in the manner in which ethnicity information in New Zealand was collected prior to 1996. This report presents ethnic-specific analyses for 1996 onwards and, unless otherwise specified, prioritised ethnic group has been used to ensure that each health event is only counted once.
Despite significant improvements in the quality of ethnicity data in New Zealand’s national health collections since 1996, care must still be taken when interpreting the ethnic-specific rates as the potential still remains for Māori and Pacific children and young people to be undercounted in our national data collections. The data presented in this report may undercount Māori and Pacific children to a variable extent depending on the dataset used; in the case of the hospitalisations for Māori, this undercount may be as high as 5–6%.
Appendix 4: Statistical methods
Counts of events
Some of the data presented in this report are counts of events, such as hospitalisations and deaths, and rates which represent the number of these events per head of population in a certain time period. The rates are crude age-specific rates, calculated by dividing the number of events, such as hospitalisations or deaths, in a particular age group by the corresponding “at-risk” population in the same age group and then multiplying the result by a constant (such as 100,000) to derive the rate. Age-specific rates are commonly expressed per 1,000 or per 100,000 population.
Some of the graphs of rates of events in this report include 95% confidence intervals. Confidence intervals are a statistical tool used to indicate the range of variation that occurs in the number of randomly occurring discrete events that occur per unit of measurement (such as per year).123 It is usual to use 95% confidence intervals, which indicate that there is a 95% probability that the number of random events that occur with a particular probability in a given time period will be within the range of the confidence limits.
To compare rates between different demographic groups in New Zealand, some tables and graphs in this report include rate ratios. The rate ratio is the rate for one particular category divided by the rate for a category chosen as the reference category, for example the rate for Māori divided by the rate for European/Other. Rate ratios calculated this way are properly known as crude or unadjusted rate ratios, because their calculation does not take into account differences in population demographic structure between the two categories being compared.
Rate ratios can be interpreted as follows124:
· A value of 1 indicates that there is no difference between the group of interest (for example Māori) and the reference group (for example European/Other).
· A value higher than 1 shows that the rate is higher for the group of interest than for the reference group.
· A value lower than 1 shows that the rate is lower for the group of interest than for the reference group.
Proportions
Some of the data in presented these reports are proportions. It is common practice to use data from a subset of the population (such as survey participants) to estimate the proportion of the whole population who have the characteristic of interest.
Proportions are commonly expressed as percentages, for example:
% of babies fully breastfed at 6 weeks
=
 ×
100
×
100
For the purposes of estimating 95% confidence intervals, the subset of the population used to estimate the proportion in the total population is regarded as a random sample of people from the total population, who can either have, or not have, the characteristic of interest.
In this situation the 95% confidence interval is the range of values that has a 95% probability of including the value of the proportion for the whole population. It quantifies the uncertainty resulting from random variation in the estimation of the population proportion. The width of the 95% confidence interval depends on the sample size (larger samples yield more precise estimates) and the degree of variability in the phenomenon being measured.
Proportions can be compared between two population groups using the rate ratio: the ratio of the estimated proportion having the characteristic of interest in the comparison group to the estimated proportion having the characteristic of interest in the reference group.
The rate ratios for proportions presented in this report that are derived from the New Zealand Health Survey have been adjusted for differences in demographic factors between the groups being compared that might influence (confound) the comparison.124: The adjustments are as follows124:
· The gender comparison has been adjusted for age.
· The ethnic comparisons have been adjusted for age and gender.
· The deprivation comparisons have been adjusted for age, gender and ethnic group.
Adjusting for potential confounding factors makes comparisons more accurate and meaningful because it removes the effect of these confounding factors.124
Appendix 5: Measures of material hardship
DEP-17 is a 17-item deprivation index that includes a range of items considered essential and enjoyed by the majority of New Zealand households. This is working on a spectrum from lower to higher levels of hardship. A score of 6+ is considered to indicate households experiencing material hardship and 9+ indicates households experiencing severe material hardship.23
Table 14. Items used in the New Zealand Household Economic Survey and scoring details for the material deprivation index (DEP-17)
| Item description | |
| Enforced lack of essentials (for respondent or household as a whole) | |
| 1. | Meal with meat, fish or chicken (or vegetarian equivalent) at least each 2nd day |
| 2. | Two pairs of shoes in good repair and suitable for everyday use |
| 3. | Suitable clothes for important or special occasions |
| 4. | Presents for family and friends on special occasions |
| 5. | Home contents insurance |
| Economised, cut back or delayed purchases ‘a lot’ because money was needed for other essentials (not just to be thrifty or to save for a trip or other non-essential) | |
| 6. | Went without or cut back on fresh fruit and vegetables |
| 7. | Bought cheaper cuts of meat or bought less than wanted |
| 8. | Put up with feeling cold to save on heating costs |
| 9. | Postponed visits to the doctor |
| 10. | Postponed visits to the dentist |
| 11. | Did without or cut back on trips to the shops or other local places |
| 12. | Delayed repairing or replacing broken or damaged appliances |
| In arrears more than once in last 12 months (because of shortage of cash at the time, not through forgetting) | |
| 13. | Rates, electricity, water |
| 14. | Vehicle registration, insurance or warrant of fitness |
| Financial stress and vulnerability | |
| 15. | Borrowed money from family or friends more than once in the last 12 months to cover everyday living costs |
| 16. | Feel ‘very limited’ by the money available when thinking about purchase of clothes or shoes for self (options were: not at all, a little, quite limited, and very limited) |
| 17. | Could not pay an unexpected and unavoidable bill of $500 within a month without borrowing |
1. General Assembly of the United Nations. Resolution 70/1 Transforming our world: the 2030 Agenda for Sustainable Development New York: United Nations, 2015. http://undocs.org/A/RES/70/1
2. UNICEF Office of Research. Building the Future: Children and the Sustainable Development Goals in rich countries. Florence: UNICEF 2017.
3. Department of the Prime Minister and Cabinet. Reducing child poverty Wellington: DPMC; 2019. Available from: https://dpmc.govt.nz/our-programmes/reducing-child-poverty accessed September 2020.
4. Office of the Children’s Commissioner, Oranga Tamariki. What Makes a Good Life? Wellington, 2019. https://www.occ.org.nz/assets/Uploads/What-makes-a-good-life-report-OCC-OT-2019-WEB2.pdf
5. New Zealand Government. Wellbeing budget 2020 Rebuilding together. Wellington: New Zealand Government, 2020. https://www.treasury.govt.nz/publications/wellbeing-budget/wellbeing-budget-2020
6. Colmar Brunton. Impact of COVID-19 on Pacific peoples living in South Auckland. Wellington: Ministry of Health,, 2021. https://www.health.govt.nz/about-ministry/information-releases/general-information-releases/impact-covid-19-pacific-peoples-living-south-auckland
7. Child Poverty Reduction Act. New Zealand 2018.
8. Oranga Tamariki Act 1989. No 24. New Zealand.
9. Britto PR, Lye SJ, Proulx K, et al. Nurturing care: promoting early childhood development. The Lancet 2017;389(10064):91-102. https://doi.org/10.1016/S0140-6736(16)31390-3
10. Center on the Developing Child at Harvard University. The Foundations of Lifelong Health Are Built in Early Childhood: Center on the Developing Child at Harvard University, 2010.
11. Expert Advisory Group on solutions to child poverty. Solutions to child poverty in New Zealand: Evidence for action. Wellington: Office of the Children's Comissioner, 2012. http://www.occ.org.nz/publications/child_poverty
12. Stats NZ. Child poverty statistics: Year ended June 2021 - technical appendix 2022. Available from: https://www.stats.govt.nz/methods/child-poverty-statistics-year-ended-june-2021-technical-appendix#hes accessed November 2022.
13. Perry B. Household incomes in New Zealand: Trends in indicators of inequality and hardship 1982 to 2018. Wellington: Ministry of Social Development, 2019. https://www.msd.govt.nz/about-msd-and-our-work/publications-resources/monitoring/household-incomes/
14. Stats NZ. Measuring child poverty: Fixed-line measure: StatsNZ; 2019. Available from: https://www.stats.govt.nz/assets/Uploads/Methods/measuring-child-poverty-fixed-line/measuring-child-poverty-fixed-line-measure.pdf accessed September 2019.
15. Department of the Prime Minister and Cabinet. Child poverty reduction and wellbeing legislation Wellington, New Zealand: New Zealand Government; 2022. Available from: https://www.childyouthwellbeing.govt.nz/our-aspirations/context/child-poverty-reduction-and-wellbeing-legislation accessed July 2022.
16. Department of Prime Minister and Cabinet. Notification of setting of targets under the Child Poverty Reduction Act 2018 Wellington: New Zealand Government 2021. Available from: https://gazette.govt.nz/notice/id/2021-go2605 accessed May 2022.
17. Department of Prime Minister and Cabinet. Notification of setting of targets under the Child Poverty Reduction Act 2018 Wellington: New Zealand Government 2019. Available from: https://gazette.govt.nz/notice/id/2019-ps2326 accessed May 2022.
18. United Nations. No poverty 2019. Available from: https://www.un.org/sustainabledevelopment/poverty/ accessed September 2019.
19. Stats NZ. Child poverty statistics: Year ended June 2021 2022. Available from: https://www.stats.govt.nz/information-releases/child-poverty-statistics-year-ended-june-2021 accessed May 2022.
20. Perry B. Child Poverty in New Zealand. Wellington: Ministry of Social Development, 2022. https://www.msd.govt.nz/about-msd-and-our-work/publications-resources/research/child-poverty-in-nz/index.html
21. Stats NZ. Child poverty statistics: Year ended June 2020 – corrected 2021. Available from: https://www.stats.govt.nz/information-releases/child-poverty-statistics-year-ended-june-2020 accessed August 2021.
22. Commission on Social Determinants of Health. Closing the gap in a generation: Health equity through action on the social determinants of health. Geneva, 2008. https://www.who.int/social_determinants/thecommission/finalreport/en/
23. Stats NZ. Measuring child poverty: Material hardship Wellington: StatsNZ; 2019. Available from: https://www.stats.govt.nz/methods/measuring-child-poverty-material-hardship accessed September 2019.
24. Perry B. The material wellbeing of New Zealand households: Trends and relativities using non-income measures, with international comparisons. Wellington: Ministry of Social Development, 2019. https://www.msd.govt.nz/about-msd-and-our-work/publications-resources/monitoring/household-incomes/index.html
25. Stats NZ. Measuring child poverty: Material hardship. Appendix 2: DEP-17 questions and scoring 2019. Available from: https://www.stats.govt.nz/methods/measuring-child-poverty-material-hardship#appendix1 accessed September 2021.
26. Stats NZ. Wellbeing statistics: 2021. Available from: https://www.stats.govt.nz/information-releases/wellbeing-statistics-2021/2022 .
27. Thomas A, Sawhill I. For love and money? The impact of family structure on family income. Future of Children 2005;15(2):57-74. http://dx.doi.org/10.1353/foc.2005.0020
28. Social Security Act 2018. No 32. New Zealand.
29. Kia Piki Ake, Welfare Expert Advisory Group. Whakamana tangata: Restoring dignity to social security in New Zealand. Wellington: New Zealand Government 2019.
30. Ministry of Social Development. Statistical Report for the year ending June 2010. Wellington: The Ministry of Social Development, 2011. https://www.msd.govt.nz/documents/about-msd-and-our-work/publications-resources/statistics/msd3056-statistical-report-2010-v7.pdf
31. Ministry of Social Development. Orphan's Benefit 2020. Available from: https://workandincome.govt.nz/products/a-z-benefits/orphans-benefit.html#null accessed September 2020.
32. Ministry of Social Development. Unsupported Child's Benefit 2020. Available from: https://workandincome.govt.nz/products/a-z-benefits/unsupported-childs-benefit.html accessed September 2020.
33. Australasian Faculty of Occupational and Environmental Medicine. What is good work? Position statement. Sydney: The Royal Australasian College of Physicians; 2013. https://www.racp.edu.au/advocacy/division-faculty-and-chapter-priorities/faculty-of-occupational-environmental-medicine/health-benefits-of-good-work
34. Taylor M, Marsh G, Nicol D, et al. Good work. The Taylor review of modern working practice. London: Department for Business, Energy & Industrial Strategy, UK Government, 2017. https://www.gov.uk/government/publications/good-work-the-taylor-review-of-modern-working-practices
35. Ministry for Primary Industries. The social value of a job. Wellington, 2014. https://www.mpi.govt.nz/dmsdocument/5266/send
36. Stats NZ. Labour market statistics: June 2020 quarter 2020. Available from: https://www.stats.govt.nz/information-releases/labour-market-statistics-june-2020-quarter .
37. Stats NZ. Unemployment rate Wellington: Stats NZ; 2019. Available from: https://www.stats.govt.nz/indicators/unemployment-rate accessed September 2019.
38. Gassman-Pines A, Gibson-Davis CM, Ananat EO. How Economic Downturns Affect Children's Development: An Interdisciplinary Perspective on Pathways of Influence. Child Development Perspectives 2015:n/a-n/a. http://dx.doi.org/10.1111/cdep.12137
39. OECD. How's Life? 2020 : Measuring Well-being. 2020. https://www.oecd-ilibrary.org/sites/bd51f603-en/index.html?itemId=/content/component/bd51f603-en
40. Ministry of Business, Innovation and Employment. Underutilisation and skills matching 2019. Available from: https://www.mbie.govt.nz/business-and-employment/employment-and-skills/labour-market-reports-data-and-analysis/other-labour-market-reports/underutilisation-and-skills-matching/ accessed September 2020.
41. Heyes J, Tomlinson M, Whitworth A. Underemployment and well-being in the UK before and after the Great Recession. Work, employment and society 2017;31(1)
42. Erwin C, Dasgupta K, Pacheco G. Characterising New Zealand’s underutilised workforce: Evidence from the Household Labour Force Survey. Auckland: New Zealand Work Research Institute, 2019. https://www.mbie.govt.nz/dmsdocument/6976-characterising-new-zealands-underutilised-workforce-evidence-from-the-household-labour-force-survey-pdf
43. NHS. Can damp and mould affect my health? 2018. Available from: https://www.nhs.uk/common-health-questions/lifestyle/can-damp-and-mould-affect-my-health/#:~:text=Causes%20of%20damp%20and%20mould,roof%20or%20around%20window%20frames accessed July 2020.
44. Rolfe S, Garnham L, Godwin J, et al. Housing as a social determinant of health and wellbeing: developing an empirically-informed realist theoretical framework. BMC Public Health 2020;20(1):1138. http://dx.doi.org/10.1186/s12889-020-09224-0
45. World Health Organization. WHO Housing and health guidelines. Geneva: World Health Organization, 2018. https://www.who.int/publications/i/item/who-housing-and-health-guidelines
46. Mood EW. Fundamentals of healthful housing: Their application in the 21st century. In: Burridge R, Ormandy D, eds. Unhealthy housing. London: Chapman & Hall 1993:303-37.
47. Department of the Prime Minister and Cabinet. Child Poverty Related Indicators Report for the year ending 30 June 2021. 2022. https://dpmc.govt.nz/sites/default/files/2022-04/cyws-poverty-related-indicators-year-ending-june-2021.pdf
48. Stats NZ. Changes to the household economic survery 2018/19 2020. Available from: https://www.stats.govt.nz/methods/changes-to-the-household-economic-survey-201819 .
49. Ingham T, Keall M, Jones B, et al. Damp mouldy housing and early childhood hospital admissions for acute respiratory infection: a case control study. Thorax 2019;74(9):849-57.
50. Miller M, Marty M, Arcus A, et al. Differences between children and adults: implications for risk assessment at California EPA. International Journal of Toxicology 2002;21(5):403-18.
51. Stats NZ. Households undated. Available from: https://www.stats.govt.nz/topics/households accessed November 2020.
52. Stats NZ. Data quality ratings for 2018 Census variables 2020. Available from: https://www.stats.govt.nz/methods/data-quality-ratings-for-2018-census-variables accessed September 2020.
53. Goodyear R, Fabian A, Hay J. Finding the crowding index that works best for New Zealand. Wellington: Stats NZ, 2011.
54. Smith C, Parnell WR, Brown RC, et al. Balancing the diet and the budget: Food purchasing practices of food-insecure families in New Zealand. Nutrition and Dietetics 2013;70(4):278-85. http://dx.doi.org/10.1111/1747-0080.12043
55. Carter KN, Lanumata T, Kruse K, et al. What are the determinants of food insecurity in New Zealand and does this differ for males and females? Australian and New Zealand journal of public health 2010;34(6):602-08. http://dx.doi.org/10.1111/j.1753-6405.2010.00615.x
56. Ministry of Health. Household food insecurity among children in New Zealand. Wellington: Ministry of Health, 2019. https://www.health.govt.nz/publication/household-food-insecurity-among-children-new-zealand-health-survey
57. Macaulay GC, Simpson J, Parnell W, et al. Food insecurity as experienced by New Zealand women and their children. Journal of the Royal Society of New Zealand 2022:1-17. http://dx.doi.org/10.1080/03036758.2022.2088574
58. United Nations General Assembly. Convention on the Rights of the Child. In: UN General Assembly, ed. Resolution 44/25. Geneva: United Nations, 1989.
59. Kids Can. Zero fees for under-13s 2015. Available from: https://www.kidscan.org.nz/news/zero-fees-for-under-13s accessed September 2020.
60. Ministry of Health. Annual Update of Key Results 2018/19: New Zealand Health Survey 2019. Available from: https://www.health.govt.nz/publication/annual-update-key-results-2018-19-new-zealand-health-survey accessed September 2020.
61. Ministry of Health. Lower cost general practice visits 2020. Available from: https://www.health.govt.nz/our-work/primary-health-care/primary-health-care-subsidies-and-services/lower-cost-general-practice-visits accessed September 2020.
62. New Zealand Government. Free health checks for children under 14 2020. Available from: https://www.govt.nz/browse/health/free-health-services-for-children/free-health-checks-for-children-under-14/ accessed September 2020.
63. Garstang J. Challenges of research using data from child death overview panels. Archives of Disease in Childhood 2018;103(11):1008-09. http://dx.doi.org/10.1136/archdischild-2018-314821
64. Wolfe I, Macfarlane A, Donkin A, et al. Why children die: Death in infants, children, and young people in the UK - Part A. London: Royal College of Paediatrics and Child Health, National Children's Bureau, British Association for Child and Adolescent Public Health, 2014. https://www.rcpch.ac.uk/sites/default/files/2017-06/Why%20children%20die%20-%20Death%20in%20infants%2C%20children%20and%20young%20people%20in%20the%20UK%20-%20Part%20A%202014-05.pdf
65. UNICEF Office of Research. Child well-being in rich countries: A comparative overview. Florence, Italy: UNICEF Office of Research, 2013. https://www.unicef-irc.org/publications/683-child-well-being-in-rich-countries-a-comparative-overview.html
66. OECD. Infant mortality rates (indicator). Available from: https://doi.org/10.1787/83dea506-en accessed September 2021.
67. Sands New Zealand. New Zealand definitions/terminology. Available from: https://www.sands.org.nz/help-terminology.html accessed November 2022.
68. Child and Youth Mortality Review Committee Te Ropu Arotake Auau Mate o te Hunga Tamariki Taiohi. Sudden unexpected death in infancy (SUDI): Special report. Wellington, 2017. https://www.hqsc.govt.nz/assets/CYMRC/Publications/CYMRC_SUDI_Report.pdf
69. Ministry of Health. Indicator of potentially avoidable hospitalisations for the Child and Youth Wellbeing Strategy: A brief report on methodology. Wellington, NZ: Ministry of Health, 2020. https://www.health.govt.nz/system/files/documents/publications/indicator-of-potentially-avoidable-hospitalisations-child-and-youth-wellbeing-strategy-apr21.pdf
70. Department of the Prime Minister and Cabinet. Child and Youth Wellbeing strategy. Wellington, NZ: Department of the Prime Minister and Cabinet, 2019. https://childyouthwellbeing.govt.nz/resources/child-and-youth-wellbeing-strategy
71. Turner N. A measles epidemic in New Zealand: Why did this occur and how can we prevent it occurring again? New Zealand medical journal 2019;132(1504)
72. Ministry of Health. New Zealand Immunisation Schedule 2020. Available from: https://www.health.govt.nz/our-work/preventative-health-wellness/immunisation/new-zealand-immunisation-schedule accessed October 2021.
73. Nowlan M. Influences and policies that affect immunisation coverage – a review of literature. Auckland, New Zealand: The Immunisation Advisory Centre, 2018. https://www.immune.org.nz/sites/default/files/publications/LitRev_Influences%20and%20policies%20that%20affect%20immunisation%20coverage_final.pdf
74. World Health Organization. Immunization. 2019. Available from: https://www.who.int/news-room/facts-in-pictures/detail/immunization accessed October 2021.
75. Ministry of Health. Immunisation Handbook 2020. Wellington, NZ: Ministry of Health, 2020. https://www.health.govt.nz/publication/immunisation-handbook-2020
76. Quadri-Sheriff M, Hendrix KS, Downs SM, et al. The role of herd immunity in parents' decision to vaccinate children: A systematic review. Pediatrics (Evanston) 2012;130(3):522-30. http://dx.doi.org/10.1542/peds.2012-0140
77. Grant CC, Turner NM, York DG, et al. Factors associated with immunisation coverage and timeliness in New Zealand. British Journal of General Practice 2010;60(572):e113-e20. http://dx.doi.org/10.3399/bjgp10X483535
78. Riggs L, Keall M, Howden-Chapman P, et al. Environmental burden of disease from unsafe and substandard housing, New Zealand, 2010–2017. Bulletin of the World Health Organization 2021;99(4):259-70. http://dx.doi.org/10.2471/BLT.20.263285
79. Boyce T, Gudorf A, de Kat C, et al. Towards equity in immunisation. Euro surveillance : bulletin européen sur les maladies transmissibles 2019;24(2):1. http://dx.doi.org/10.2807/1560-7917.ES.2019.24.2.1800204
80. Ministry of Health. Health Systems Indicators framework. 2021
81. New Zealand Government. SKIP Strategies with kids: Information for parents undated. Available from: https://www.skip.org.nz/ accessed September 2018.
82. Becker J. Corporal punishment: Legal reform as a route to changing norms. Social Research 2018;85(1):255-71.
83. MacMillan HL, Mikton CR. Moving research beyond the spanking debate. Child Abuse & Neglect 2017;71:5-8. https://doi.org/10.1016/j.chiabu.2017.02.012
84. Miller-Perrin C, Perrin R. Physical punishment of children by US parents: moving beyond debate to promote children’s health and well-being. Psicologia: Reflexao e Critica 2018;31(1) http://dx.doi.org/10.1186/s41155-018-0096-x
85. Ferguson CJ. Spanking, corporal punishment and negative long-term outcomes: a meta-analytic review of longitudinal studies. Clin Psychol Rev 2013;33(1):196-208. http://dx.doi.org/10.1016/j.cpr.2012.11.002
86. Grogan-Kaylor A, Ma J, Graham-Bermann SA. The case against physical punishment. Current Opinion in Psychology 2018;19:22-27. http://dx.doi.org/10.1016/j.copsyc.2017.03.022
87. Smith AB. The state of research on the effects of physical punishment. Social Policy Journal of New Zealand 2006(27):114–27.
88. Crimes (Substituted Section 59) Amendment Act 2007.
89. Kelly P. Corporal punishment and child maltreatment in New Zealand. Acta paediatrica 2011;100(1):14-20. http://dx.doi.org/10.1111/j.1651-2227.2010.02000.x
90. D'Souza AJ, Russell M, Wood B, et al. Attitudes to physical punishment of children are changing. Archives of Disease in Childhood 2016;101(8):690-93. http://dx.doi.org/10.1136/archdischild-2015-310119
91. Lansford JE, Cappa C, Putnick DL, et al. Change over time in parents’ beliefs about and reported use of corporal punishment in eight countries with and without legal bans. Child Abuse and Neglect 2017;71:44-55. https://doi.org/10.1016/j.chiabu.2016.10.016
92. Ministry of Health. Content guide 2020/21: New Zealand Health Survey. Wellington: Ministry of Health, 2021. https://www.health.govt.nz/publication/questionnaires-and-content-guide-2020-21-new-zealand-health-survey
93. Oranga Tamariki. Outcomes framework 2018. Available from: https://www.orangatamariki.govt.nz/about-us/how-we-work/outcomes-framework/ accessed October 2021.
94. Keddell E, Davie G, Barson D. Child protection inequalities in Aotearoa New Zealand: Social gradient and the ‘inverse intervention law’. Children and Youth Services Review 2019;104:104383. https://doi.org/10.1016/j.childyouth.2019.06.018
95. Oranga Tamariki, Ministry for Children. Pūrongo ā tau Annual report 2021/22. Wellington: Oranga Tamariki, 2022.
96. Kvalsvig A, D’Souza A, Duncanson M, et al. Pathways to child health, development and wellbeing: Optimal environments for orchids and dandelions. An overview of the evidence. Wellington: Ministry of Health, 2016. https://www.health.govt.nz/publication/pathways-child-health-development-and-wellbeing-optimal-environments-orchids-and-dandelions-overview
97. Gilbert R, Widom CS, Browne K, et al. Burden and consequences of child maltreatment in high-income countries. The Lancet 2009; 373(9657).
98. Leeb R, Paulozzi L, Melanson C, et al. Child maltreatment surveillance: Uniform definitions for public health and recommended data elements. Atlanta: Centers for Disease Control and Prevention, National Center for Injury Prevention and Control, 2008. https://www.cdc.gov/violenceprevention/pdf/cm_surveillance-a.pdf
99. Fanslow J, Kelly P, Ministry of Health. Family violence assessment and intervention guideline: Child abuse and intimate partner violence (2nd edn). . Wellington: Ministry of Health, 2016. https://www.health.govt.nz/publication/family-violence-assessment-and-intervention-guideline-child-abuse-and-intimate-partner-violence
100. Gilbert R, Lacey R. Intergenerational transmission of child maltreatment. The Lancet Public Health 2021;6(7):e435-e36. https://doi.org/10.1016/S2468-2667(21)00076-1
101. O’Donnell M, Nassar N, Leonard H, et al. Monitoring child abuse and neglect at a population level: Patterns of hospital admissions for maltreatment and assault. Child Abuse and Neglect 2010; 34(11). http://www.sciencedirect.com/science/article/pii/S0145213410002231
102. Hooft AM, Asnes AG, Livingston N, et al. The Accuracy of ICD Codes: Identifying Physical Abuse in 4 Children's Hospitals. Academic pediatrics 2015; 15(4). http://www.sciencedirect.com/science/article/pii/S1876285915000091
103. Ards SD, Myers Jr SL, Malkis A, et al. Racial disproportionality in reported and substantiated child abuse and neglect: An examination of systematic bias. Children and Youth Services Review 2003; 25(5-6). https://www.scopus.com/inward/record.uri?eid=2-s2.0-0038066768&partnerID=40&md5=269948040e3ea043c75159005ce6de31 .
104. Rouland B, Vaithianathan R, Wilson D, et al. Ethnic disparities in childhood prevalence of maltreatment: Evidence from a New Zealand birth cohort. American Journal of Public Health 2019;109(9):1255-57. http://dx.doi.org/10.2105/ajph.2019.305163
106. Webber Andrew. He Whakaaro: What is the relationship between
attendance and attainment? Wellington: Ministry of Education, 2020. https://www.educationcounts.govt.nz/publications/schooling/he-whakaaro-what-is-the-relationship-between-attendance-and-attainment
110. Office ER. Learning in a Covid-19 World: The Impact of Covid-19 on Schools. Wellington, 2021.
111. New Zealand Qualifications Authority. A Guide to NCEA - for secondary school students and parents. 2018. https://www.nzqa.govt.nz/assets/About-us/Publications/Brochures/A-Guide-to-NCEA-ENGLISH-March-2018.pdf
112. Ministry of Education. School deciles 2021. Available from: https://www.education.govt.nz/school/funding-and-financials/resourcing/operational-funding/school-decile-ratings/#How accessed October 2021.
113. Ministry of Education. School deciles: Ministry of Education; 2019. Available from: https://www.education.govt.nz/school/funding-and-financials/resourcing/operational-funding/school-decile-ratings/ accessed November 2019.
114. Berkman L, Macintyre S. The measurement of social class in health studies: Old measures and new formulations. In: Kogevinas M, Pierce N, Susser M, et al., eds. Social inequalities and cancer. Lyon: IARC Scientific Publications 1997:51-64.
115. Atkinson J, Salmond C, Crampton P. NZDep2018 Index of Deprivation, Interim research report. Wellington: University of Otago, 2019.
116. Ministry of Health. Mortality Collection data dictionary v1.6. Wellington: Ministry of Health, 2017. https://www.health.govt.nz/publication/mortality-collection-data-dictionary
117. Gauld R, Raymont A, Bagshaw PF, et al. The importance of measuring unmet healthcare needs. The New Zealand medical journal (online) 2014;127(1404):63-7.
118. Ministry of Health. National Minimum Dataset (hospital events) data dictionary version 7.9 2017. Available from: https://www.health.govt.nz/publication/national-minimum-dataset-hospital-events-data-dictionary accessed July 22 2022.
119. Stats NZ. Information about births. Wellington: www.stats.govt.nz, 2003.
120. New Zealand Health Information Service. 2001/2002 Ministry of Health Data Quality Audit Program. Coder's update, 2002:1-4.
121. Ministry of Health. The New Zealand Health Survey: Objectives and topic areas August 2010. Wellington: Ministry of Health, 2010.
122. Ministry of Health. Methodology report 2020/21: New Zealand Health Survey. Wellington: Ministry of Health, 2021. https://www.health.govt.nz/publication/methodology-report-2020-21-new-zealand-health-survey
123. Hoffman JIE. Chapter 18 - The Poisson Distribution. In: Hoffman JIE, ed. Biostatistics for medical and biomedical practitioners. Academic Press 2015:259-78. https://doi.org/10.1016/B978-0-12-802387-7.00018-4
124. Ministry of Health. Methodology Report 2018/19: New Zealand Health Survey. Wellington, NZ: Ministry of Health, 2019. https://www.health.govt.nz/publication/methodology-report-2018-19-new-zealand-health-survey
Disclaimer:
While every endeavour has been made to use accurate data in this report, there are currently variations in the way data are collected by various agencies that may result in errors, omissions, or inaccuracies in the information in this report. The Child Poverty Monitor does not accept liability for any inaccuracies arising from the use of these data in the production of this report, or for any losses arising as a consequence thereof.
ISSN 2357-2078
2022
Contact us:
New Zealand Child and Youth Epidemiology Service (NZCYES)
University of Otago
Dunedin
Suggested citation:
Duncanson M, Roy M, van Asten H, Oben G, Wicken A, Tustin K, McAnally H and Adams J. (2022) Child Poverty Monitor 2022 Technical Report. Dunedin. NZ Child and Youth Epidemiology Service, University of Otago
![]()
This work is licensed under a Creative Commons Attribution-NonCommercial-NoDerivatives 4.0 International License http://creativecommons.org/licenses/by-nc-nd/4.0/